⌚ Wearables
65.8% Is 50 of 76. The Office Cuff Found 42.
The only counts behind Google's Nature abstract: the watch finds 50 of 76 cases, an office cuff 42. The 80.6% figure is 50 divided by 62.
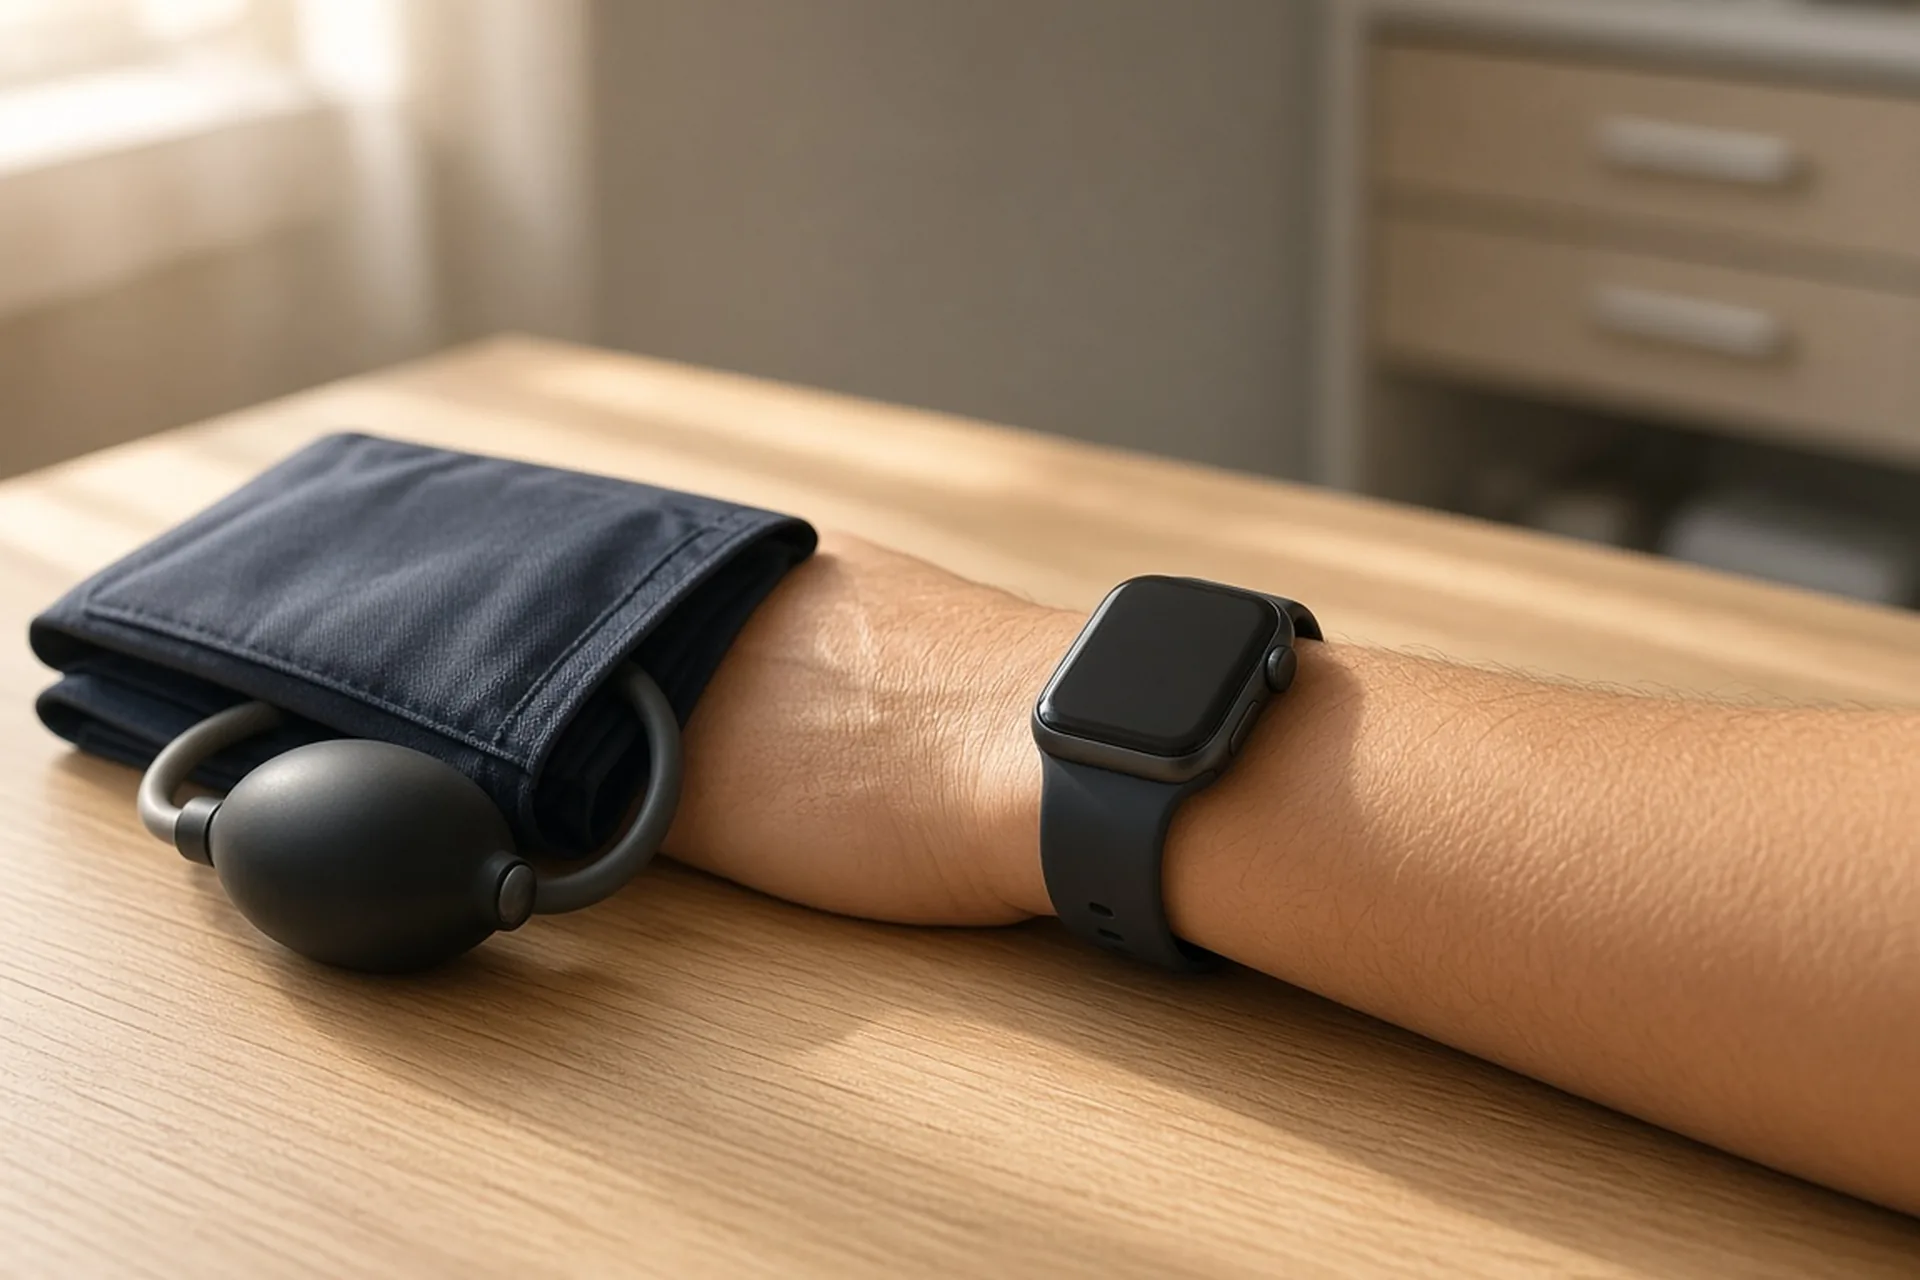
Fifty of seventy-six.
Divide 50 by 76 and the quotient is 65.789 percent, which is the 65.8 in the 5 November Nature abstract, while 108 cleared out of the other 120 is a specificity of 90.0 on the nose, and 50 true positives among 62 flags is 80.645 percent, the printed 80.6, all of it inside a prospective study of 196 adults with no known cardiovascular disease, on no blood pressure medicine, scored against 24-hour ambulatory monitoring. An office cuff on those same people finds 42 of the 76, raises the same 12 false alarms, and so posts 42 divided by 54, or 77.8 percent.
Eight people.
Every split of 196 was searched, and only the cells 50, 26, 12 and 108 reproduce the watch's three rounded percentages, just as only 42, 34, 12 and 108 reproduce the cuff's. Nature's press office said the next day that this sensitivity gap is not statistically significant, and the printed intervals already overlap, 54.0 to 76.3 percent against 43.4 to 66.7, because those bounds are the Clopper-Pearson 95 percent intervals on 50 of 76 and on 42 of 76, just as 83.2 to 94.7 percent is the interval on 108 of 120 and the predictive-value intervals sit on 50 of 62 and on 42 of 54, an overlap that is not itself a p-value. Eight people are what the press office compared.
One room, four cells, two tests
| Call | Hypertensive, 76 | Not, 120 | Predictive value |
|---|---|---|---|
| Watch, positive | 50 | 12 | 50/62 = 80.6% |
| Watch, negative | 26 | 108 | 108/134 = 80.6% |
| Office cuff, positive | 42 | 12 | 42/54 = 77.8% |
| Office cuff, negative | 34 | 108 | 108/142 = 76.1% |
A no is right 108 times in 134, 80.597 percent, the same rounded 80.6 as 50 divided by 62, which is what a room looks like when 76 of 196 people, 38.8 percent, already have the condition and the test still misses 26 of them.
Both tests share that 10 percent false-alarm rate, so the entire advantage is the likelihood ratio, sensitivity divided by 0.10, which is 6.58 for the watch and 5.53 for the cuff, a quotient of 1.19, the same figure as 50/12 divided by 42/12, nineteen percent more true cases per false alarm and not a new kind of test.
Among the 48 the clinic already flagged, a home cuff still wins
Google's research blog, posted that day by Paolo Di Achille and Ming-Zher Poh, gives the comparison the abstract skips: among the 48 people with an elevated first office reading, the watch is listed at 78.4, 90.9 and 96.7 percent sensitivity, specificity and positive predictive value, a return office visit at 67.6, 63.6 and 86.2, and multi-day home monitoring at 89.2, 81.8 and 94.3, and each trio has one integer solution at 48, all three of them sharing 37 people with sustained hypertension and 11 without.
| Confirmatory test | Of the 37 | False alarms, of 11 | Positive predictive value |
|---|---|---|---|
| Watch | 29 | 1 | 29/30 = 96.7% |
| Return office visit | 25 | 4 | 25/29 = 86.2% |
| Home cuff | 33 | 2 | 33/35 = 94.3% |
Home finds four more of the 37 than the watch, plus one extra false alarm, which is the whole of what the blog calls competitive, and no interval is printed beside that four-person gap. USPSTF already tells clinicians to confirm an office positive with ambulatory or home readings before treatment, and its account of the 2017 ACC/AHA guideline says it recommends the same out-of-office check. On the step both documents describe, the cuff you take home beat the wrist.
492,347 hours trained it. The app is a different sentence.
What the network emitted was a probability, not a blood pressure: the blog says a self-supervised model saw 492,347 hours of photoplethysmography and accelerometer traces from 2,109 people, 15 seconds at a time, and a logistic regression then took the multi-day average plus height, a stand-in for arterial path length, 233.45 hours a person once 492,347 is divided by 2,109, or 9.73 days if those hours never stopped, the total the press release calls "nearly 500,000." Its DOI is 10.1038/s41586-026-11336-3. Bylines are Google Research, with Shwetak Patel also at the University of Washington and Stephen Juraschek at Beth Israel Deaconess and Harvard.
Same post, two sentences that refuse each other: the findings "helped inform" Blood pressure trends inside Health Guardian, and the methods "are not indicative of any existing or upcoming commercial product feature or device capability." On the features page, Google names Pixel Watch 3, 4 and 5 with no subscription, plus Fitbit Edge and Fitbit Air on Google Health Premium, calls the Japan and Mexico tile Vascular Stress Trend, and says this is not a prescreener for hypertension, while the trends page says there is no blood-pressure number, asks for five continuous days a month and eight hours of good signal, recommends sleep, tells a High user to take seven cuff days, and wants weight kept current, whereas the research classifier uses height, and the product page repeats the wellness disclaimer. Five times eight is 40 hours, 17.1 percent of that 233.45-hour pretraining average, a wear-budget comparison only, not evidence that the tile is the Nature model.
80.6 percent is the room, not the wrist
Carry the same sensitivity and specificity out of that room. NCHS Data Brief 511, August 2021 through August 2023, puts US adult prevalence at 47.7 percent and awareness, among adults who have hypertension, at 59.2 percent, so the share who have it among people who would not report a diagnosis is prevalence times one minus awareness, divided by one minus prevalence times awareness: 0.477 times 0.408 is 0.194616, the denominator 1 minus 0.477 times 0.592 is 0.717616, and 0.194616 divided by 0.717616 is 0.2712.
At that 27.1 percent, positive predictive value is 0.658 times 0.2712, which is 0.1784, divided by 0.1784 plus the false-alarm term 0.10 times 0.7288, which is 0.0729, and 0.1784 over 0.2513 is 71.0 percent, 9.6 points under the study's 80.6, while an office cuff at 55.3 percent sensitivity and the same specificity lands at 67.3. Both figures fall once you leave a room that was 38.8 percent positive.
| Pool | Prevalence | Awareness | Screen-pool | Watch PPV | Watch NPV | Office PPV |
|---|---|---|---|---|---|---|
| Study, 196 people | 38.8% | Excluded | 38.8% | 80.6% | 80.6% | 77.8% |
| US adults, 18+ | 47.7% | 59.2% | 27.1% | 71.0% | 87.6% | 67.3% |
| Ages 18 to 39 | 23.4% | 27.2% | 18.2% | 59.4% | 92.2% | 55.2% |
| Ages 40 to 59 | 52.5% | 56.7% | 32.4% | 75.9% | 84.6% | 72.6% |
| Ages 60 and older | 71.6% | 73.7% | 39.9% | 81.4% | 79.9% | 78.6% |
Under 40 a positive is 59.4 percent, a coin flip that landed a little past center, while a negative is right 92.2 percent of the time; at 60 and older the negative falls to 79.9 percent, about one wrong reassurance in five, because that undiagnosed pool is already 39.9 percent hypertensive and a third of cases still produce no alert. Million Hearts still prints the prior cycle, 48.1 percent and 119.9 million adults in 2017 through March 2020, which the brief calls consistent with 47.7, and NCHS FastStats prints 49.1 percent for ages 20 and older, two different cuts that never entered the formula.
Nor did the abstract's "over half unaware," a slogan the WHO sheet of 25 September 2025 no longer supports: it counts 600 million unaware out of an estimated 1.4 billion adults aged 30 to 79, and it prints 44 percent beside that estimate, while the US brief's 59.2 percent awareness means 40.8 percent unaware. CDC's page of 2 June 2026 says about 1 in 6 and points at a JAMA Cardiology analysis that put unawareness at 17.8 percent in 2021 to 2023, a third cut that should not be subtracted from 40.8, so the arithmetic stays with the brief alone: 130 systolic, or 80 diastolic, or current medication.
What You Can Do
If the tile says High, take the seven cuff days to a clinician. Google says the feature is not a prescreener. Under 40, Not high is the better answer, 92.2 percent in this transport, and awareness in that band is only 27.2 percent, so it is not a clearance. Past 60, Not high is the weaker one, about one wrong reassurance in five if these rates held. Ask the age before treating 50 divided by 62 as the chance a High is real.
Limitations
Because the paper is paywalled, these counts are reconstructed from rounded percentages and checked against the abstract's intervals rather than copied from a crosstab, and a missing office reading would move the cuff's denominator. No ambulatory threshold, in millimeters of mercury, appears in the abstract or the blog, while Data Brief 511 uses 130 over 80 or medication, so a study rule of 125 over 75 or 140 over 90 would aim the transport at the wrong pool. Rates were assumed to travel from five volunteer sites, people with no known cardiovascular disease and no blood pressure medicine, onto every NHANES age band, which the study never shows. Confirmatory counts come from the blog and could be rounding on a smaller analyzed set, and no p-value appears here because the paired misses a McNemar test needs are not public. Clopper-Pearson agreement confirms the margins and not the comparison. Nothing here says Blood pressure trends has 65.8 percent sensitivity, which is the reading Google's own sentence forbids.
The Strongest Case Against This Analysis
Comparable to an office cuff is what the authors and the press office actually claimed, and eight extra detections in 76 cases, inside intervals that swallow each other, is a tie they already conceded. A tie with a cuff that misses 34 of 76 can still matter on days when nobody has an appointment, and the home cuff's four-person edge requires someone who owns one and inflates it, so coverage is the honest case for a wrist.
Grant all of that, and 80.6 percent is still a property of a room in which 76 of 196 people already had the condition, a four-person gap on 37 people is still not a win over a home cuff, and the Nature operating point still does not belong on a wellness tile whose maker says the research methods are not the product.
The Bottom Line
On 5 November 2026 Google published a watch system that, in the only integer table those percentages allow, caught 50 of 76 ambulatory cases and cleared 108 of 120 people without them, while an office cuff in the same study caught 42 and cleared the same 108.
Eight people, a gap the press office calls not significant, and an 80.6 percent figure that is simply 50 divided by 62. When a monthly High shows up, take the seven cuff days. When it says Not high, remember the 26.