Jet A Costs $6.50 a Gallon at One FBO and $9.00 at the One Next Door. The Posted Price Is Not the Price
In August 2026 the Government Accountability Office sent undercover callers to 45 fixed-base operators and found the fuel price is the one number you can see. Ramp fees, handling, parking, after-hours callouts, and taxes arrive by phone or on the invoice. Fuel is 35% of what it costs to fly a turbine airplane, contract fuel runs 15 to 30% below retail, and almost nobody audits the invoice against the contract.
The Problem
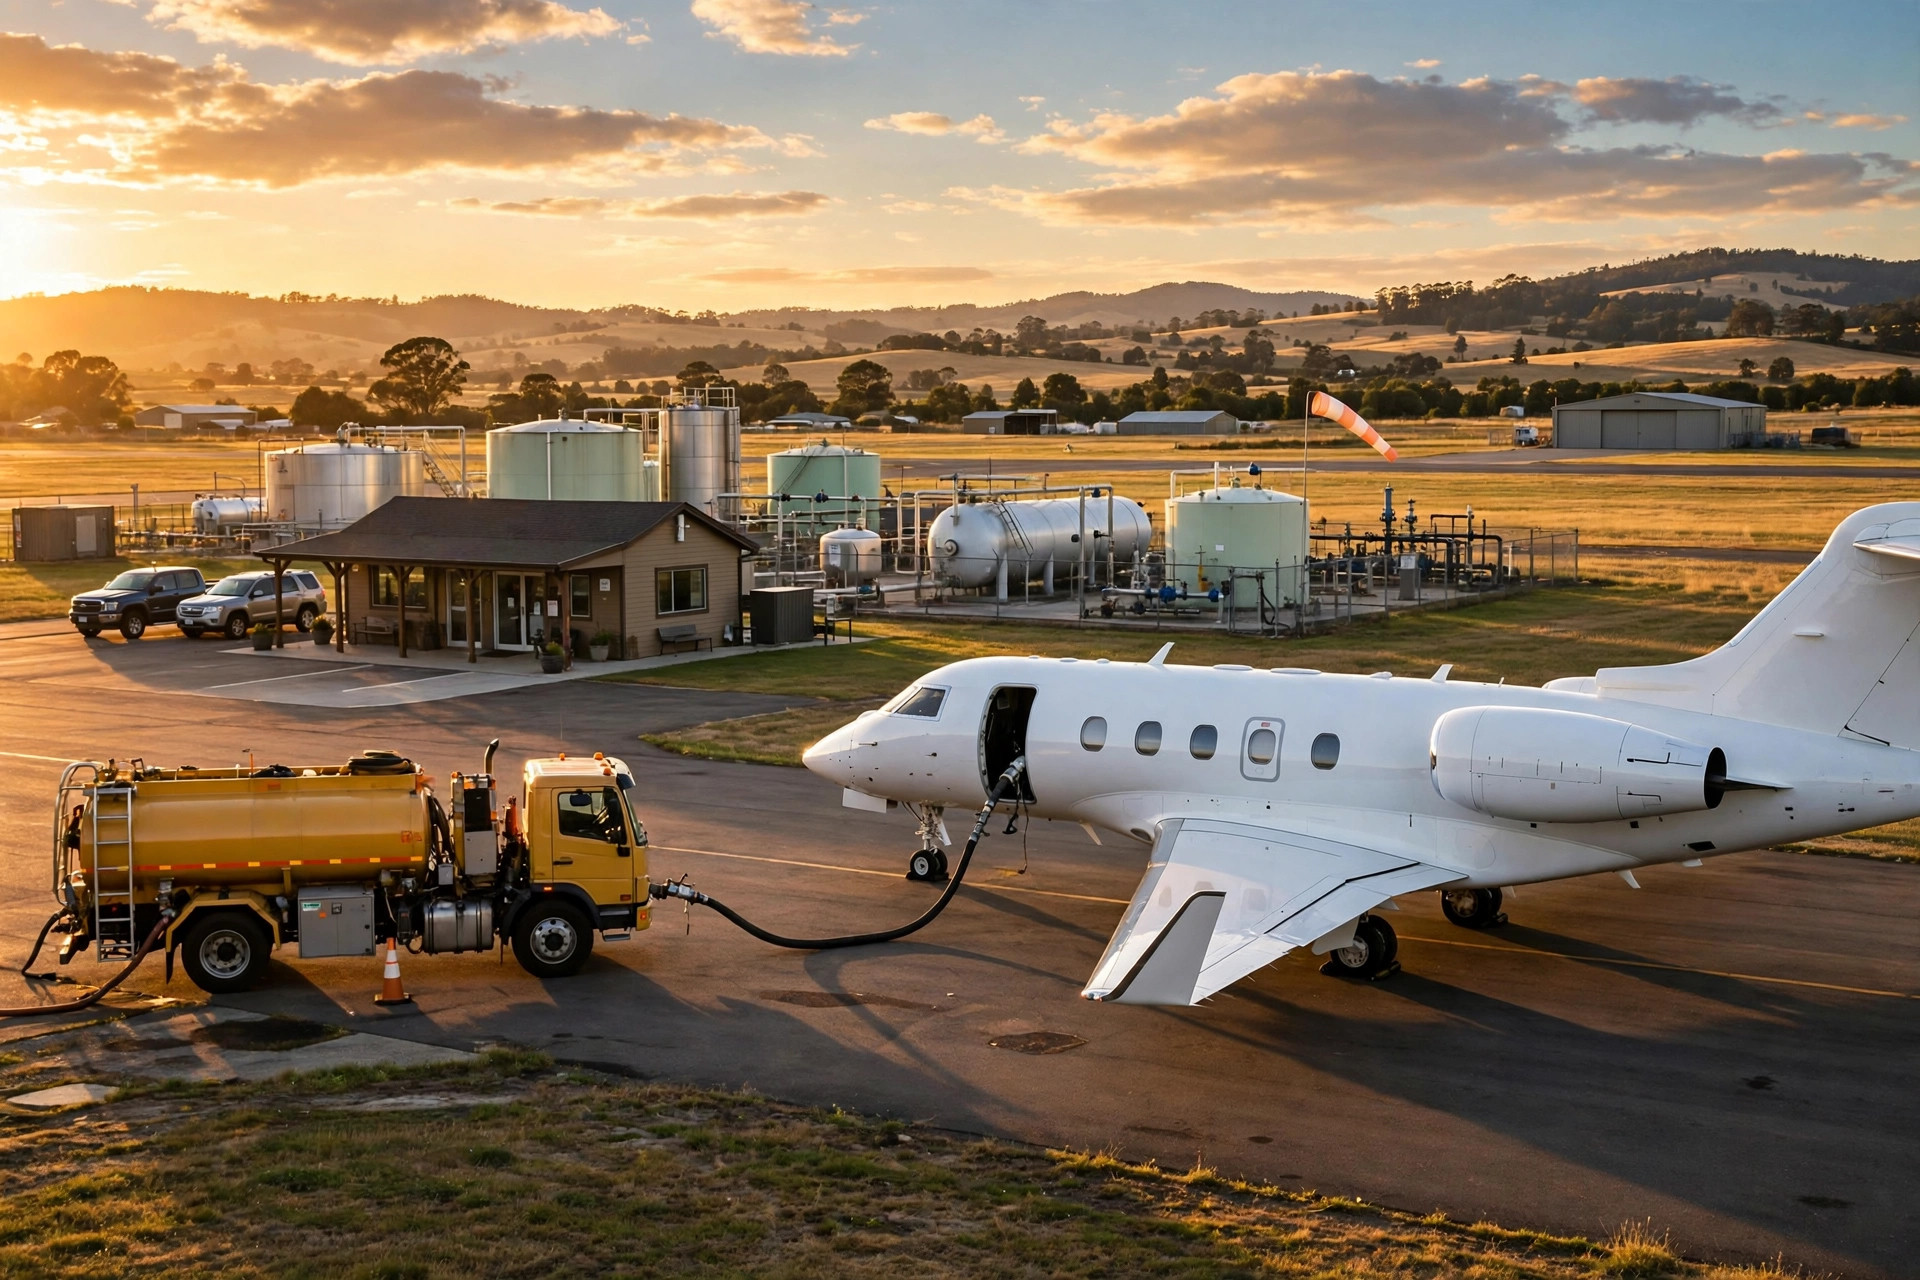
Every turbine airplane that lands at a general aviation airport buys fuel from a fixed-base operator, the FBO. As of March 2019 the GAO counted 3,070 FBOs operating at 3,016 airports in the contiguous United States. At most of those airports there is exactly one FBO, and at the busy ones there are two or three, often owned by chains. Fuel is roughly 35% of an aircraft's operating cost, which makes the price of Jet A the largest single line item a flight department manages, larger than crew, larger than maintenance reserves, larger than hangar rent.
Yet the price a pilot sees is not the price an operator pays, and the price an operator pays is not the price the trip costs. A posted Jet A price has three layers: the product itself, the into-plane fee for delivering it to the aircraft, and the airport or handling surcharge on top. Retail posted prices bundle all three at a premium, while a contract program separates them so the real cost is visible. Operators rarely pay list price. Contract fuel typically runs 15 to 30% below posted retail, and the spread between two FBOs on the same field can be wider than the spread between two cities. Atlantic Aviation typically prices retail Jet A $0.25 to $0.75 per gallon below Signature at the same airport. On a Gulfstream G650 that uplifts 3,000 gallons, that spread saves $750 to $2,250 per fuel stop.
Then come the fees the posted price never mentions. US FBOs charge a ramp fee when an aircraft buys no fuel, and waive it at a minimum uplift. Ramp and handling fees range from $50 at small regional FBOs to $800 or more at premium facilities, with the waiver kicking in at 50 to 200 gallons depending on aircraft size. Parking, overnight fees, after-hours callouts, lavatory and potable water service, GPU use, and de-icing each carry their own charge, and each varies by aircraft weight, time of day, and length of stay. A GAO report published August 11, 2026 tested exactly this: researchers posed as recreational pilots in covert calls to 45 FBOs at 40 general aviation airports between January and May 2026, then compared what they were told by phone with what four online sources showed. Fuel prices were widely available online and generally matched the phone quotes. Information on required fees was limited online but available by phone. In other words, the one number that is easy to find is the one number that matters least, because the fees decide the true cost of the stop.
Almost nobody checks the math after the fact. Fuel releases are authorized by email against a tail number, an airport, and a volume. Invoices arrive weeks later, often as PDFs, from multiple fuel programs, multiple FBO chains, and multiple card networks. A flight department flying 300 hours a year processes hundreds of fuel transactions across dozens of airports. Contract rates change weekly in the Americas. Volume tiers reset. Tax treatment differs by operator type and jurisdiction. A billed rate that drifts $0.40 above the contracted rate on a 1,000-gallon uplift is $400 on one stop, invisible in a monthly fuel bill that runs to six figures, and repeated across a fleet it becomes a rounding error that only ever rounds one way.
One airport shows how transparent this market could be. San Bernardino International Airport publishes its FBO pricing policy in full: retail Jet A is wholesale purchase cost plus tax plus a $1.75 markup, with 15% price discretion based on local market conditions; retail 100LL is wholesale plus tax plus a $1.00 markup; self-serve avgas is discounted $0.70 per gallon below retail; volume discounts run from $0.20 per gallon at 400 gallons to $1.00 at 10,000 gallons. That document, a public PDF updated July 1, 2025, is the exception. Most FBOs publish a single retail number and keep the formula, the tiers, and the fees behind a phone call.
Piston pilots face the same opacity at smaller dollar amounts. The EIA records US aviation gasoline deliveries of roughly 400,000 to 500,000 gallons per day, or about 160 to 180 million gallons a year, nearly all of it burned by the piston fleet. A 100LL price of $6.88 a gallon at one field and $5.40 at the field 40 miles away is a $1.48 spread on a 50-gallon fill, $74 per stop, for an owner who flies 100 hours a year. Small money per stop, real money per year, and the only tools for finding it are free listing sites that show the retail number and nothing else.
Market Size
Original TAM calculation: ARGUS TRAQPak tracks more than 1,000 Part 91, Part 135, and Part 91K fixed-wing operators in North America. The addressable core for a fuel-price and invoice-audit platform is operators with three or more turbine aircraft that buy fuel away from home base every week: an estimated 1,200 operators, including charter certificate holders, fractional programs, corporate flight departments, and aircraft management companies. At a blended $600 per month (a $350 tier for 1 to 3 aircraft, $750 for 4 to 10, $1,500 for 11 or more), the core SaaS TAM is $8.6 million in annual recurring revenue.
The second layer is piston owners. Of the roughly 204,000 active general aviation aircraft in the US, the large majority burn 100LL. A consumer tier at $99 per year that shows true all-in cost per airport, including fees and the cheapest nearby alternative, targeting 25,000 of the most active piston owners adds $2.5 million ARR.
The third layer is the FBOs themselves. The 3,070 FBOs counted by the GAO need to know what competitors charge, because their retail price is set against a wholesale cost plus a markup formula they guard closely. A pricing-analytics tier at $199 per month with 20% adoption adds $1.5 million ARR. Total realistic SAM: $12.6 million ARR, plus audit-recovery fees at 5% of verified overbilling on enterprise accounts. Year 3 target: 300 operator subscribers at blended $600 per month plus 8,000 piston subscribers plus 150 FBO subscribers equals $3.3 million ARR.
For scale, the US aviation fuel market was estimated at $25.4 billion in 2024, and EIA data puts total US jet fuel consumption at 618,600 thousand barrels in 2024, about 26 billion gallons. Airlines burn nearly all of that. General aviation is a small slice of the gallons and a large slice of the margin, because FBO retail markups of $1.00 to $1.75 per gallon sit on top of wholesale, and the buyers have the weakest price visibility in the fuel chain.
The Product
A neutral fuel-price intelligence and invoice-audit platform for turbine operators, piston owners, and FBOs, built around the all-in cost of a fuel stop rather than the posted retail number. Core modules:
- True-cost trip calculator: For any planned leg, the platform shows posted retail, contract rate, and all-in cost per gallon at every FBO on the route, including ramp fees, handling, parking, callout charges, taxes, and sustainable aviation fuel premiums. It recommends where to uplift and how much, weighing the waiver threshold at the expensive field against the price at the next stop.
- Tankering optimizer: Carrying cheap fuel to avoid an expensive field only works inside landing-weight and performance limits, and ReFuelEU now restricts how much fuel can be tankered into EU airports. This module computes the weight-aware, regulation-aware uplift for each leg, using the same logic flight departments now do by hand or with a $350-per-month tool that covers only the price search.
- Contract-fuel audit: Operators forward fuel invoices and releases. The platform matches each billed line against the contracted rate in force that week, the volume tier actually reached, and the correct tax treatment, then flags overbilling, missed tiers, duplicate charges, and additive fees like the $0.05-per-gallon fuel-system icing inhibitor charge that appears on some invoices and not others. Audit findings are exportable evidence for a refund claim, not just a dashboard number.
- Verified FBO fee database: The GAO gap, closed by data. Crowdsourced fee reports from operators, verified against published FBO policies and periodic direct confirmation, covering ramp, handling, parking, overnight, and callout fees by aircraft weight class at 3,000-plus FBOs. FBOs that publish full schedules get a verified badge and a free listing; FBOs that do not get flagged as unverified.
- Unleaded transition tracker: The FAA's EAGLE initiative targets a fleet-wide unleaded avgas solution by 2030, and GAMI's G100UL holds a fleet-wide supplemental type certificate issued in 2022. Availability is patchy: one airport sold more than a million gallons of leaded 100LL over two years while an unleaded alternative sat available on site. This module tracks G100UL and UL94 availability and pricing by airport, so piston operators can plan around the transition instead of discovering it at the pump.
- FBO pricing analytics: For FBO operators, anonymized benchmarks of retail and contract pricing by region, airport class, and chain affiliation, plus the volume-tier structures competitors use. An FBO that prices $1.75 over wholesale while the field next door prices $1.00 over wholesale learns it from data, not from losing a regular customer.
Unit Economics
| Metric | Value |
|---|---|
| Monthly subscription (Small flight dept, 1-3 aircraft) | $350/operator |
| Monthly subscription (Mid-size, 4-10 aircraft) | $750/operator |
| Monthly subscription (Large, 11+ aircraft) | $1,500/operator |
| Blended operator ARPU | $600/month |
| Consumer tier (piston owners) | $99/year |
| FBO pricing analytics tier | $199/month |
| Audit recovery fee | 5% of verified savings |
| Data infrastructure cost per subscriber/month | $38 |
| Customer acquisition cost | $2,200 |
| Expected LTV (30-month avg retention, 88% gross margin) | $15,840 |
| LTV:CAC ratio | 7.2:1 |
| Gross margin | 88% |
| Startup cost (18-month runway) | $1.8M |
| Break-even | 20 months |
Methodology note: LTV uses blended operator ARPU only: $600 × 30 months × 88% gross margin = $15,840. The 30-month retention assumption reflects the annual contract-fuel cycle: once an operator's invoice history and contract terms live in the audit system, switching means re-keying a year of releases and losing the overbilling baseline. CAC of $2,200 reflects concentrated distribution: NBAA-BACE, NATA chapter events, and the roughly 1,000 operators ARGUS tracks, a small enough universe that direct outreach and referral from early adopters does most of the work. Data cost of $38 per subscriber per month covers price-feed licensing, invoice OCR, and verification calls to FBOs. Payback period is about 3.7 months on operator accounts.
Go-to-Market
Phase 1 (months 1-9): Seed the fee database. Recruit 200 FBOs to publish full fee schedules in exchange for a verified listing and free pricing analytics for a year. Simultaneously launch the free piston tier, seeded with retail prices from public listings and fee reports from AOPA members, to build the crowdsourced layer. The piston tier is the top of funnel: every owner who checks a 100LL price before a cross-country flight is a potential referrer to a turbine operator.
Phase 2 (months 10-16): Monetize operators. Target the 100 largest Part 135 operators first, using a free 90-day invoice audit as the wedge: hand an operator a report showing what they overpaid in the last quarter, then charge to keep finding it. Attend NBAA-BACE and NATA events with the audit report as the demo, not a slide deck. Build the tankering optimizer on Phase 1 price and fee data.
Phase 3 (months 17-24): Launch FBO pricing analytics and enterprise audit for aircraft management companies that run fuel programs for dozens of owners. Approach the chains (Signature with 200-plus locations, Atlantic with 69, Jet Aviation with 30-plus) as data partners, not adversaries: they get benchmark data, the platform gets verified fee schedules. Publish a quarterly FBO Fuel Transparency Index ranking airports by how much of the true cost is visible before arrival, which creates public pressure on the laggards and free press for the platform.
Competitive Landscape
| Company | What It Does | Fee Transparency? | Pricing |
|---|---|---|---|
| FuelerLinx | Fuel price search and tankering for flight departments | No: prices, not the fee stack or invoice audit | $350/mo minimum |
| AirNav / FltPlan | Free fuel price listings at 4,500 FBOs | No: retail prices only | Free |
| ForeFlight | Flight planning with fuel prices as a feature | No: planning tool, not an audit tool | $99-299/yr |
| JetFuelX | Compares contract fuel prices across your own programs | No: compares your programs, not the market | Free |
| World Fuel / UVair / Colt | Sell contract fuel programs | No: sellers cannot audit themselves neutrally | Volume-based |
| Everest Fuel | Buying group, 55-65 cents/gal off via 4,000 aircraft | No: a discount club, not software | Membership |
| This startup | All-in cost, tankering, invoice audit, verified fee database | Core product: the true cost of the stop | $99/yr-1,500/mo |
Every existing tool solves one slice. FuelerLinx finds the cheap price and tells you when to tanker, but it charges a $350 monthly minimum and does not audit what you were actually billed. AirNav and FltPlan list retail prices for free, which is the number that matters least. JetFuelX is free and useful, but it only compares the fuel programs you already belong to. World Fuel, UVair, and Colt sell contract fuel, so they cannot be neutral auditors of the invoices their own programs generate. Everest proves the buying-power model works, with 55 to 65 cents per gallon off for 4,000 participating aircraft, but it is a discount club, not software, and it does nothing for the operator who wants to know whether last month's invoice matched the contract. Nobody combines the price search, the fee database, the tankering math, and the invoice audit in one product, and nobody is neutral: every incumbent either sells fuel or sells the search for fuel.
Why Now
Five forces converge on this startup.
First, the GAO put the gap on the federal record in August 2026. GAO-26-108578 was mandated by the FAA Reauthorization Act of 2024, and its finding is precise: fuel prices are visible, required fees are not. That is a regulatory tailwind with a paper trail. The next step in that sequence is pressure, formal or informal, for FBOs at federally funded airports to publish fee schedules. A platform that already holds the verified fee database is the obvious place that pressure lands.
Second, demand is at a record. North American private jet flight hours hit 5,419,973 in 2025, up 3.5% year over year, the second-best total on record. Part 135 charter flew 1,933,097 hours, up 3.3%. Fractional flying grew 9.4%. Charter and fractional together now account for 55.8% of North American flight hours. McKinsey's first State of Business Aviation report puts global departures at a record 3.9 million in 2025, with global flight hours up from 4.7 million in 2019 to 6.4 million in 2025. Every one of those hours burns fuel bought at opaque prices. Growth in hours is growth in the overpay.
Third, the unleaded transition creates a new dataset from scratch. EAGLE targets a fleet-wide unleaded solution by 2030, G100UL holds its fleet-wide certificate, and availability varies airport by airport with no central tracker. The first platform to map unleaded availability and pricing owns the dataset every piston operator will need for the next five years.
Fourth, consolidation made the pricing power visible. A consortium paid $4.73 billion for Signature Aviation in 2021, and KKR paid $4.475 billion for Atlantic Aviation the same year. Three chains now operate more than 300 FBOs between them. When the sellers consolidate, the buyers need neutral benchmarks, and the independents need to know how the chains price.
Fifth, the math changed. Sustainable aviation fuel carries a premium that varies by airport and blend, ReFuelEU limits tankering into European airports, and contract rates now move weekly. The rules of thumb flight departments used for a decade, tanker from home base, buy the minimum at the expensive field, no longer hold everywhere. A calculator that knows the current rules beats a rule of thumb.
Original Contribution: The Charter Overpay
A calculation nobody has published. Part 135 charter operators flew 1,933,097 hours in North America in 2025, according to ARGUS TRAQPak data. To convert hours to gallons, use a blended burn rate of 170 gallons per hour. That is an estimate, and the mix matters: a light jet burns roughly 150 to 200 gallons per hour, a turboprop under 100, a large-cabin jet over 300. At 170 gallons per hour, Part 135 burned about 329 million gallons of Jet A in 2025.
Contract fuel runs 15 to 30% below retail, which on a $7 retail gallon is $1.05 to $2.10. Not every uplift can capture the full gap: tankering is limited by weight and range, some airports have a single FBO, and small operators lack contract volume. Use a conservative $0.50 per gallon as the average capturable gap between what charter operators paid and the best available price on the same route. At that figure, Part 135 operators overpaid by roughly $164 million in 2025.
Run the sensitivity. At $0.25 per gallon the overpay is $82 million. At $1.00 it is $329 million. The piston side adds more: EIA aviation gasoline deliveries of about 170 million gallons a year, times the same $0.50 assumption, is another $85 million. Combined, general aviation operators paid roughly $250 million more for fuel in 2025 than the best available prices on their own routes would have required.
Make it concrete per operator. A 10-aircraft charter fleet flying 300 hours per aircraft per year burns about 510,000 gallons. At $0.50 per gallon, that fleet leaves $255,000 on the ramp every year. A $750-per-month subscription that recovers even a fifth of it pays for itself 5.7 times over. That is the sales pitch, and it is arithmetic, not a slogan.
Limitations
This analysis has several weaknesses that should be stated plainly.
First, the 170-gallon-per-hour blended burn rate is an estimate, not a measured figure. ARGUS publishes hours, not gallons, and the true fleet-average burn depends on the mix of light jets, midsize jets, large-cabin jets, and turboprops flying Part 135 in a given year. If the true average is 140 gallons per hour, the Part 135 overpay falls to about $135 million at the same $0.50 gap. If it is 200, the overpay rises to about $193 million. The order of magnitude holds; the point estimate does not.
Second, the $0.50-per-gallon capturable gap is a judgment call, not a measurement. The 15 to 30% contract discount is documented, but the share of uplifts where an operator could actually have paid the lower price is not. Single-FBO airports offer no alternative. Tankering is capped by landing weight. Some operators already hold the best contract rates. The $164 million figure assumes the average operator captures none of the gap today, which overstates the opportunity for the best-run flight departments and understates it for the worst.
Third, the GAO fee-transparency finding rests on a non-generalizable sample: 40 airports and 45 FBOs, selected to match the proportion of airport categories, with covert calls conducted over five months in 2026. It establishes that the fee gap exists and is systematic, not its exact size across all 3,070 FBOs. The 2019 GAO report reached a narrower conclusion, finding that FBO pricing had not been identified as a widespread area of concern, and AOPA's response was that the report missed the mark on sole-provider transparency. Two GAO reports, seven years apart, point in the same direction but with different force.
Fourth, the TAM assumes 1,200 operators will pay for a product that overlaps with tools they already own. Many flight departments already pay for FuelerLinx or rely on their fuel program's own portal. The realistic addressable set may be closer to 600 operators, which would cut the core SaaS TAM to about $4.3 million. The piston tier assumes 25,000 owners pay $99 a year for data that AirNav gives away free at the retail layer; the conversion case rests entirely on the fee layer being worth paying for, which is unproven until the database exists.
Strongest Counterargument
The most compelling case against this startup is that the market has already solved the part that matters, and the part that remains is too small and too hostile to monetize.
Start with who already has a solution. The operators who burn the most fuel, NetJets, Flexjet, VistaJet, and the large Part 135 fleets, already employ fuel desks, hold multiple contract programs, and run FuelerLinx or equivalent software. They negotiate rates directly with FBO chains and audit invoices in-house. They are the customers with the budget, and they need this product least. The operators who need it most, a three-aircraft charter company in the Midwest and a piston owner flying 100 hours a year, have the smallest budgets and the weakest willingness to pay for software. FuelerLinx already prices its minimum at $350 a month, which tells you what the market will bear at the low end, and it has not taken over the industry at that price.
Then consider the supply side. FBOs have no incentive to publish fee schedules. The GAO found fees are available by phone, which is exactly the level of disclosure that preserves pricing discretion while satisfying the letter of grant assurances. A crowdsourced fee database depends on operators reporting what they paid, and operators who got a good deal have no reason to share it, while operators who got a bad deal may misremember the details. Verification calls to 3,000 FBOs are a permanent cost center, and a single stale price in the database is the kind of error that costs a subscriber a bad fuel stop and costs the platform its credibility.
Finally, transparency does not create choice where none exists. At a single-FBO airport, knowing the ramp fee is $400 does not let you pay a different ramp fee. It lets you complain, and complaints at a federally obligated airport run into Grant Assurance 22, the fair-and-reasonable standard that the FAA has policed lightly for decades. The GAO's own 2019 report concluded pricing was not a widespread concern. The strongest version of this counterargument is that the posted fuel price is visible precisely because it is the competitive number, and the fees are invisible precisely because the market tolerates it: the buyers who care already negotiate, and the buyers who do not care will not pay $99 a year to start caring.
The Bottom Line
General aviation burns roughly half a billion gallons of fuel a year across turbine and piston fleets, at prices that vary by dollars per gallon between FBOs on the same field, with fees that the GAO confirmed in August 2026 are not visible online. The best-run operators already capture the contract discount. Everyone else pays retail plus fees they never see until the invoice arrives, and the arithmetic says the gap is worth roughly $250 million a year across the industry. The tools that exist solve slices: a price search here, a free listing there, a fuel seller's own portal. Nobody neutral owns the all-in cost of a fuel stop, the tankering math, and the invoice audit together. That is a small market, about $12.6 million of SaaS, but it is a market where the customer can measure the return in a single quarter of invoices.
What You Can Do
If you run a flight department or a charter certificate: pull twelve months of fuel invoices and match every billed line against the contract rate in force that week, including volume tiers and tax treatment. Compute your all-in cost per gallon, including every ramp fee you paid and every waiver you earned, by airport. If you cannot produce that number, you are the customer. If you fly piston: check the 100LL price and the fee schedule at your destination and at the field 40 miles away before every cross-country, and tanker from the cheap field when the math favors it. If you run an FBO: publish your full fee schedule, with the formula, the tiers, and the waiver thresholds. The GAO just made opacity a federal talking point, and the first FBOs to publish will be the ones the transparency index ranks at the top. If you build this: start with the audit, not the search. A free search competes with AirNav. A paid audit that hands an operator a refund claim has no free competitor.
Related
📰 Hangar and Tie-Down Rate Intelligence SaaS for General Aviation Airports — the structural twin: the same airports, the same operators, the same missing benchmark, applied to storage instead of fuel
📰 Fuel Procurement Intelligence and Micro-Hedging Platform for Independent Gas Stations — fuel-price intelligence for the other end of the market, where independent retailers face the same wholesale opacity
📰 Marina Slip Yield Management SaaS for Independent Harbor Operators — yield management for another constrained-supply market where institutional buyers outperform independents through data