System and Method for Longitudinal Monitoring of Structural Crack Growth Using Smartphone Photogrammetry with Adhesive Fiducial Markers and Sub-Pixel Image Correlation
A design disclosure: what a phone could do about foundation cracks, if somebody built it. No prototype exists yet.
Abstract
Foundation cracks worry homeowners because nobody can tell, by looking, whether a crack is growing. This disclosure describes a way to answer that question with a phone: stick two printed marker decals on either side of the crack, photograph them on repeat visits, and let software measure how far the two sides have moved relative to each other, down to about a tenth of a millimeter.
Disclosed is a system and method for longitudinal monitoring of crack width and in-plane shear displacement in concrete and masonry structures using only a commodity smartphone and a pair of adhesive fiducial markers. Two printed crosshair registration targets are bonded to the structure, one on each side of the crack, at a known nominal separation. At each survey visit the user photographs the marker pair with the phone; the app detects the targets, rectifies the image to a metric frame via planar homography solved by normalized direct linear transform with RANSAC outlier rejection, and measures the relative displacement of the two target centroids with sub-pixel refinement. Crack width is additionally measured directly from the crack edges in the rectified image along a medial-axis width profile. A printed millimeter scale on each decal calibrates true as-printed dimensions at commissioning, so consumer-printer rescaling cannot corrupt the metric frame.
Ambient temperature recorded at each visit feeds a thermal regression that separates reversible thermo-hygrometric cycling from irreversible structural growth, fitted only after twelve months of visits span a full seasonal cycle. Measured widths are compared against ACI 224R exposure-class limits with tiered advisories based on cumulative displacement, and multiple marker stations across a structure form a crack network map with per-station trend records exportable for a structural engineer.
Technical Field
This disclosure relates to structural health monitoring, specifically to optical measurement of crack displacement in concrete and masonry structures (cf. IPC G01B 11/16, measuring deformation using optical means) by means of smartphone cameras, adhesive fiducial targets, and image correlation techniques (cf. IPC G06T 7/00, image analysis for inspection).
Background
Cracks in concrete are normal; growing cracks are not. What matters is never whether a crack exists but whether it is moving, how fast, and in which direction. A stable 0.3 mm shrinkage crack in a foundation wall is a cosmetic note. That same crack widening 0.1 mm per year is a structural investigation. Distinguishing the two requires repeated measurement over months with enough precision to see past the noise of thermal expansion, and that is where current practice breaks down for homeowners.
For crack monitoring, the industry standard is the mechanical tell-tale gauge. Products such as the Avongard crack monitoring system fix two overlapping plates across the crack with screws or epoxy; as the crack opens, a cursor moves against a millimeter scale, readable to about 1.0 mm by eye or 0.1 mm with calipers across the gauge spigots. Structural engineers use it widely and it works, but it is manual, point-in-time, and interpretive: somebody must visit, read, and record, and the manufacturer's usage instructions recommend recording ambient temperature because seasonal changes move the structure (per the Plus Tell-Tale instructions), without providing any mechanism to separate that thermal movement from real growth. A homeowner who installs a tell-tale and checks it twice a year gets four numbers and no analysis.
Digital image correlation (DIC) is the laboratory answer to the same problem. Sutton, Orteu, and Schreier's work established sub-pixel displacement measurement from image sequences as a mature technique, and it is standard in materials testing laboratories. Field adaptations exist in research: smartphone-based crack detection using deep learning segments cracks in single images, and technical reports describe width measurement via medial-axis skeletonization with Euclidean distance transforms. But detection is not monitoring. A single segmented crack image gives a width number with no longitudinal frame of reference, no registration across visits, and no thermal compensation. Nothing in the art gives a homeowner a repeatable sub-pixel measurement tied to fixed physical markers, an automated separation of thermal cycling from structural growth, and threshold alerting against code-recognized crack width limits.
Related disclosures address adjacent problems but not this one. LITF-PA-2026-051 discloses building-level settlement detection from tiltmeter arrays processed by a graph neural network; it measures rigid-body rotation of the structure, not crack-level displacement. LITF-PA-2026-134 discloses GNSS-based foundation displacement monitoring with millimeter-level relative positioning over 24-hour observation sessions; it tracks absolute position of the building, needs sky visibility a basement wall does not have, and resolves nothing at the crack. Neither measures crack width, shear, or thermal-compensated growth at a defect.
Obviousness deserves a direct answer here. Mechanical tell-tales, digital image correlation, and smartphone cameras are each old, and a person of ordinary skill could photograph a crack with a phone. What is not obvious is the specific combination disclosed here: passive adhesive fiducial pairs that give any phone a repeatable sub-pixel frame of reference with no surveyor visit; a quality-gated homography pipeline that rejects bad captures instead of silently measuring them; a thermal regression that withholds judgment until a full seasonal cycle has been observed rather than fitting noise; and code-limit tiering that converts measurements into named actions. Avongard's paper record sheets record temperature; they do not regress it out. Laboratory DIC rigs achieve sub-pixel precision; they do not fit in a homeowner's pocket with a one-minute visit protocol. Instead, the contribution is the consumer system that makes longitudinal sub-pixel crack monitoring repeatable by non-experts, not any one of its components.
This disclosure fills that gap with a complete consumer-deployable method that: (a) fixes repeatable sub-pixel registration to the structure with adhesive fiducial markers, so any phone on any visit measures in the same frame; (b) measures both opening and shear displacement from marker centroid motion plus direct crack-edge width profiling; (c) logs temperature per visit and regresses out reversible thermal cycling to expose irreversible growth; (d) compares measured widths against ACI 224R exposure-class limits with tiered advisories; and (e) organizes multiple cracks into a network map with per-station trend records exportable for a structural engineer.
Detailed Description
1. Fiducial Marker Pair
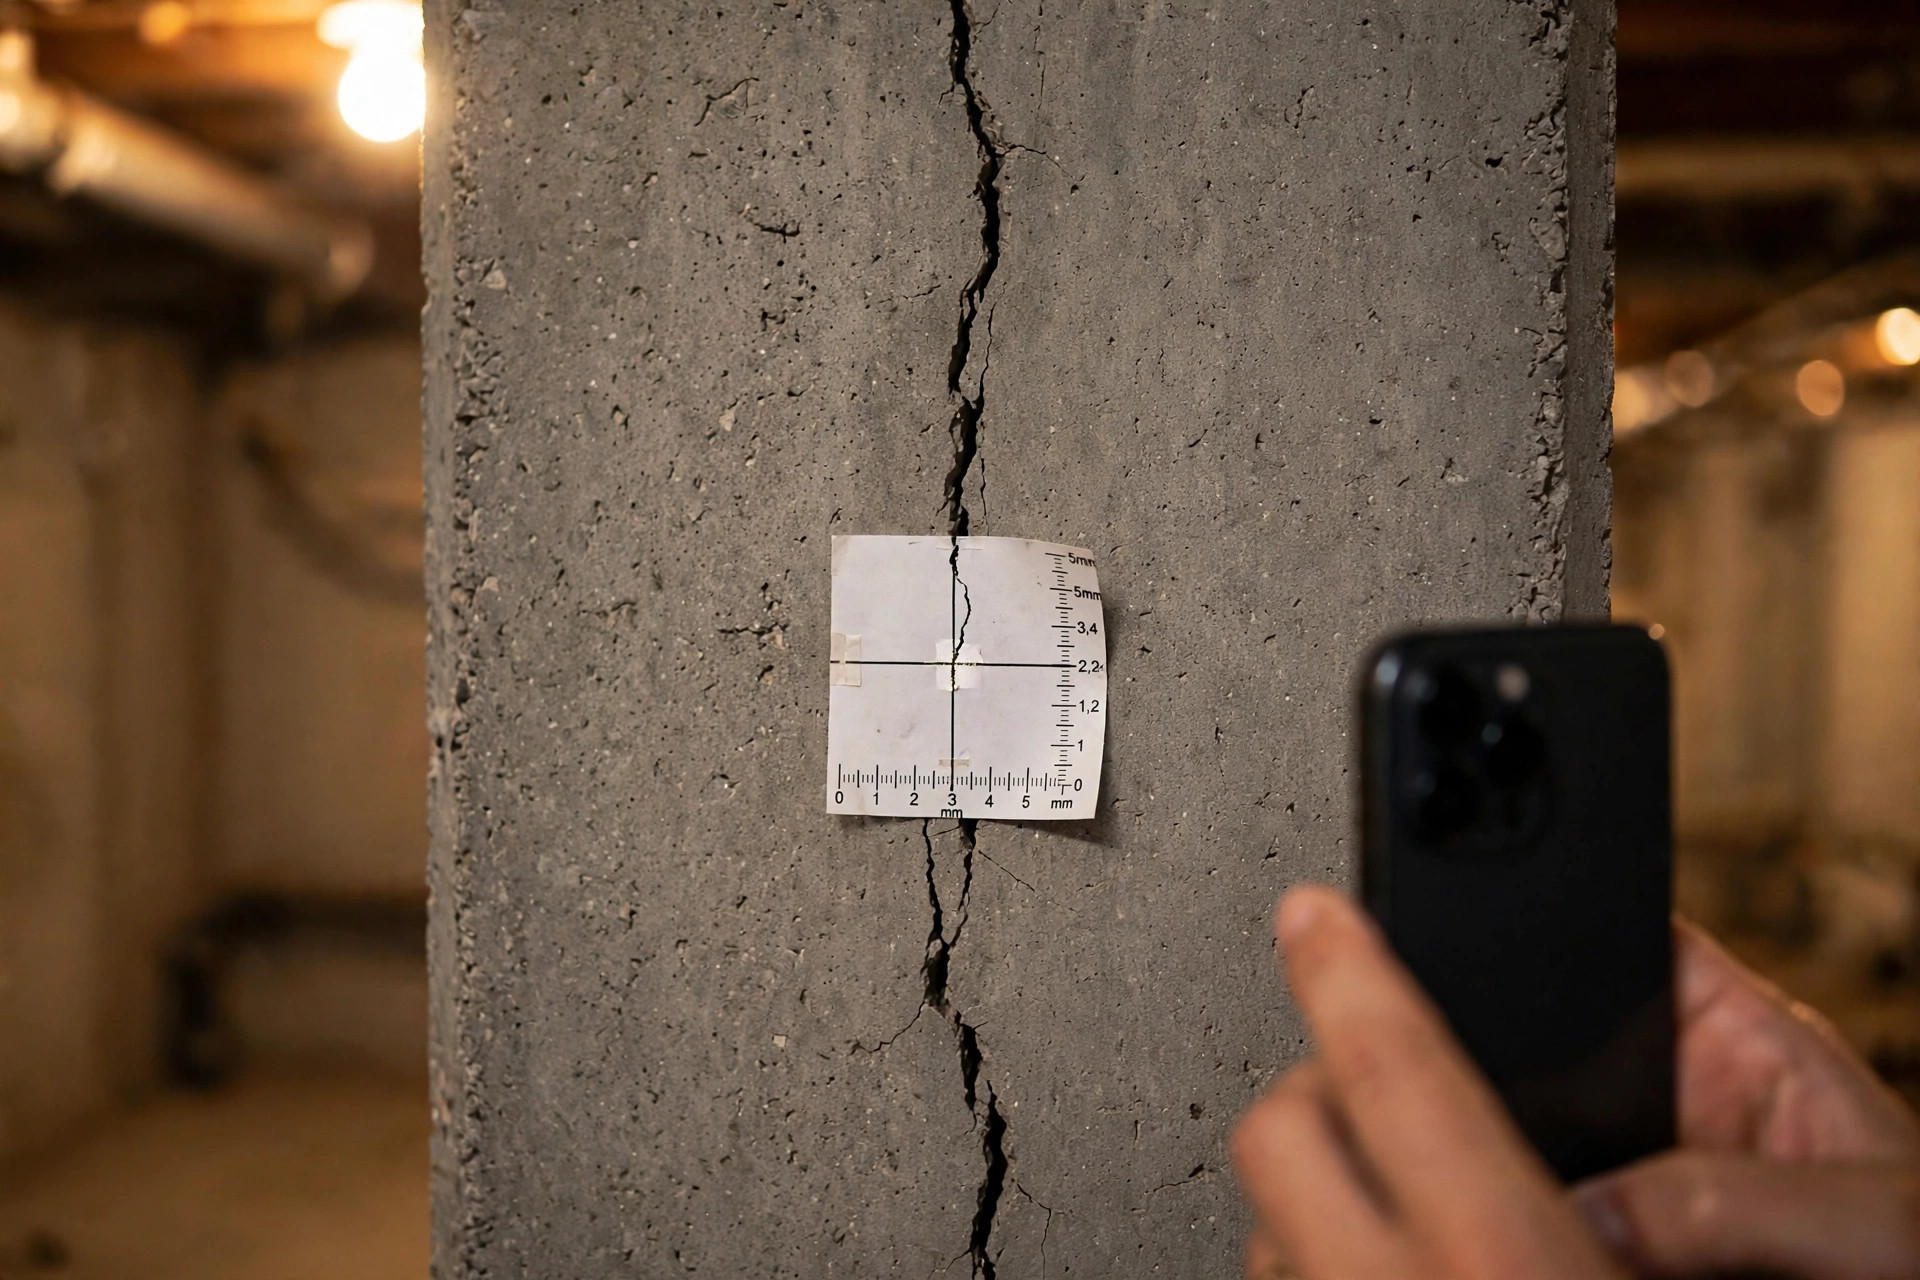
Each monitored crack receives one marker station: two adhesive fiducial decals bonded to the structure, one on each side of the crack, straddling it. Each decal carries three registration marks in an L arrangement (two concentric-circle targets plus one crosshair), each optimized for sub-pixel centroid detection, giving six correspondences per station image so the homography in Section 3 is overdetermined rather than exactly determined. Each decal also carries a printed station identifier readable by the app and a millimeter scale along one edge as a human-readable backup. Nominal center-to-center separation between the decals' primary targets is 60 mm, about 2.4 inches (design parameter); the exact as-installed separation is established at commissioning as described below. Decals are printed on weatherproof adhesive stock and bonded with construction adhesive or two-part epoxy after surface cleaning, following the same surface preparation used for mechanical tell-tales.
Consumer printers rescale. A PDF printed at 97 percent silently shrinks every "known" dimension on the decal, which would corrupt the metric frame if the app trusted the nominal print size. Calibration at commissioning is the defense: the app reads the decal's printed millimeter scale in the commissioning image to establish the true as-printed dimensions of the registration marks, and the user verifies the scale against a physical ruler as a sanity check. From then on the station's metric frame is anchored to the measured print, not the nominal file.
This two-decal arrangement is deliberate. A single card bridging the crack would either restrain the crack or tear; two independent decals move with their respective sides of the crack, and their relative displacement is the measurement. A printed station identifier lets the program distinguish stations when a structure has several, and the printed millimeter scale means a human with a loupe can always read an approximate width even if the app is unavailable.
2. Capture Protocol
At each visit the user holds the smartphone 20 to 30 cm from the wall, approximately perpendicular, with both decals and at least 2 cm of crack length beyond each decal in frame. An on-screen framing guide requires all six target centers visible before capture is allowed. Flash is enabled, because basement and crawlspace walls are dark and the measurement is geometric rather than photometric: consistent flash illumination beats variable ambient light for edge detection. Each visit captures three frames and keeps the sharpest by Laplacian variance, rejecting motion blur. Each visit records a timestamp, the station identifier, and ambient temperature entered manually or taken from local weather data for the visit timestamp. Phone internal sensors are not used for temperature: they measure device temperature, not air temperature. A visit takes under a minute per station.
3. Metric Rectification
Target detection finds the six registration mark centers in the captured frame. With six correspondences for the eight degrees of freedom of a planar homography, the system is overdetermined, and the app solves it with the normalized direct linear transform under RANSAC outlier rejection: a mark whose reprojection disagrees with the consensus is excluded rather than allowed to warp the frame. Warping produces a metric image at 10 pixels per millimeter (design parameter), which matches what a typical 12-megapixel phone wide camera resolves at the 20 to 30 cm standoff without upsampling interpolation. Per visit, the residual reprojection error is reported; visits with residual above 0.3 pixels (design parameter) are rejected with a prompt to re-shoot, because a bad homography corrupts every downstream measurement. With an overdetermined fit the gate fires meaningfully: an exactly determined four-point homography would always report zero residual. Commissioning stores the reference metric frame and the reference target centroid positions against which all later visits are compared.
Here is how the precision budget closes. Sub-pixel centroid refinement of a high-contrast circular target reaches roughly 0.1 to 0.2 pixels, which at 10 pixels per millimeter is 0.01 to 0.02 mm per target; differencing two decals doubles the variance contribution to about 0.03 mm. Placement, focus, and lighting variation across visits dominate the error, which is why the end-to-end precision target is set an order of magnitude coarser at 0.1 mm (design goal, unvalidated), about the thickness of a sheet of copy paper. Anything the method claims below that floor is noise presented as signal.
4. Sub-Pixel Displacement Measurement
Two complementary measurements are extracted from each rectified visit image. First, the marker measurement: a normalized cross-correlation of each decal window against its commissioning appearance provides coarse alignment, and each target centroid is then refined to sub-pixel accuracy by intensity-weighted centroiding within the detected circle. The vector between the two decals' centroids is compared to the commissioning reference. Perpendicular to the local crack direction, the component is the opening displacement; parallel to it, the shear displacement. Second, the crack-edge measurement: the crack is segmented in the rectified image, its medial axis is skeletonized, and a Euclidean distance transform yields a width profile along the crack path. Reported alongside the marker-derived opening is the width at the marker station cross-section, as an independent check; the two should agree within the measurement noise, and persistent disagreement flags a problem such as decal debonding or crack branching between the decals.
For opening displacement, the design precision target is 0.1 mm (design goal, unvalidated), matching what a skilled operator achieves with calipers on a mechanical tell-tale, but obtained automatically, longitudinally, and with a full audit trail of images. Shear displacement is reported against the same 0.1 mm precision target (design goal, unvalidated). Out-of-plane displacement, such as one side of the crack offsetting forward from the wall face, is not measured by this method; the homography assumes a planar wall, and significant out-of-plane motion appears as elevated reprojection residual rather than as a quantified value.
5. Thermal Disambiguation
Concrete expands and contracts with temperature at roughly 10 microstrain/°C. Across a 60 mm gauge length, a 20 degree seasonal swing in air temperature moves the decals about 0.012 mm. That number needs honest framing: it is roughly one-eighth of the 0.1 mm per-visit precision target (design goal, unvalidated), which means thermal motion is invisible in any single pair of visits. It matters only as a slow bias in multi-year trends, where an uncorrected seasonal cycle can masquerade as apparent growth on the order of hundredths of a millimeter per year (design arithmetic, unvalidated): small, but comparable to the slowest growth rates the method claims to resolve. Its job is to remove that bias, not to measure a per-visit signal that is not there.
Each visit's temperature is logged, and once a station has accumulated visits spanning at least twelve months, a full seasonal cycle, the program fits a thermal regression: measured opening equals a baseline plus a thermal coefficient times temperature deviation plus an irreversible growth term linear in time. That twelve-month gate is structural, not cautious. Six visits over six months cannot separate a twelve-month thermal cycle from linear growth, because a half cosine fitted over half its period is nearly collinear with a straight line; any "growth" extracted from a half-cycle fit is mostly misattributed season. Expect the fitted thermal coefficient to be positive and small; a fitted coefficient far from the concrete thermal expansion range flags a bad fit and the program withholds the separation. Before the twelve-month threshold is reached, the program reports total displacement with an explicit flag that thermal contribution is unresolved, rather than silently attributing seasonal motion to structural growth.
Two further honest limits. First, the thermometer measures air, not the wall. A below-grade foundation wall is thermally massive and lags air temperature by days to weeks, so the logged temperature is a proxy with unmodeled lag; the regression absorbs the lag into the fitted coefficient rather than correcting for it. Second, moisture moves concrete too. Hygroscopic swelling with seasonal soil moisture is the same order of magnitude as thermal expansion and is not separately measured, so the fitted coefficient is properly a thermo-hygrometric coefficient and moisture remains an unresolved confound. A crack that opens every wet spring and closes every dry fall will read as thermal cycling in this method; distinguishing the two would need a moisture measurement the method does not include.
This automated separation, with its gates and its stated confounds, is the principal advance over manual tell-tale practice, which records temperature on paper and leaves the interpretation to whoever reads the sheet months later.
6. Thresholds and Advisories
Measured widths are compared against the reasonable crack width guidance of ACI 224R-01 Table 4.1 for reinforced concrete under service loads: 0.41 mm for dry air or protective membrane exposure, 0.30 mm for humidity, moist air, or soil exposure, 0.18 mm for deicing chemical exposure, 0.15 mm for seawater and seawater spray with wetting and drying, and 0.10 mm for water-retaining structures. At commissioning, the user selects the exposure class; the default for a below-grade foundation wall is the soil exposure class at 0.30 mm. Two scope notes matter. First, ACI 224R addresses reinforced concrete; for unreinforced masonry the table is a reference point, not a code limit, and the app labels it as such. Second, the strictest class limit, 0.10 mm, equals the method's precision target (design goal, unvalidated): for water-retaining structures the method can report "at or below the limit within measurement noise" but cannot certify compliance.
Advisory tiers are defined on cumulative irreversible displacement over the monitored window, not on annualized growth rates, because the rates are not resolvable on homeowner timescales. Here the arithmetic is unforgiving: with 0.1 mm per-visit precision, discriminating a 0.05 mm per year growth rate at two sigma needs roughly four years of monthly visits (design arithmetic, unvalidated). A tier system built on rates would spend years in an indeterminate zone while implying precision it does not have. Cumulative displacement, by contrast, is directly measured. Tier 1, monitor: cumulative displacement below 0.2 mm, twice the per-visit precision target, meaning no resolvable movement. Tier 2, increased surveillance: cumulative displacement from 0.2 mm up to 0.5 mm, meaning resolvable movement that has not reached the action threshold; the program shortens the recommended revisit interval. Tier 3, consult a structural engineer: width exceeding the class limit, cumulative displacement above 0.5 mm, or a step change above 0.3 mm between consecutive visits, which suggests a discrete event rather than gradual movement and is cleanly resolvable at three times the precision target. Boundary values belong to the higher tier. All thresholds are design parameters, not validated engineering criteria, and the program states explicitly that it is a monitoring aid, not a structural assessment.
Tier 1 is not a clean bill of health. It means nothing resolvable has moved since commissioning; it says nothing about the crack's cause, about movement before the station was installed, or about cracks with no station. Exposure-class selection shifts every tier boundary, and a user who selects "dry air" for a damp foundation wall buys themselves a looser limit they have not earned; the commissioning flow shows the selected class and its limit on every report so the choice stays visible. False negatives are the failure mode that matters most: a debonded decal reads as zero movement, which is why Section 4's independent crack-edge check and Section 3's reprojection gate exist, and why any station that stops agreeing with its own edge measurement is flagged rather than reported as stable.
7. Crack Network Mapping
A structure typically has several cracks worth watching. A station registry tracks each installation: each station's identifier, wall location on a simple sketch or photo of the elevation, commissioning date, exposure class, and visit history. Per-station trend charts show opening, shear, and temperature-compensated growth over time with the advisory tier marked. A one-tap export assembles a PDF report with the station map, trend charts, visit images with the decals visible, and the threshold comparison, formatted for handoff to a structural engineer, home inspector, or insurer. It carries the same explicit statement that the data is a monitoring aid.
Two caveats govern the report's use. First, it is not a post-event inspection. After an earthquake, a flood, nearby blasting, or major excavation next door, the station history is useful context for the engineer, but nothing in the report substitutes for a professional inspection of the structure after a discrete event; the step-change trigger in Section 6 is a prompt to call, not a diagnosis. Second, sharing the report creates a record the homeowner does not control. An insurer could cite a Tier 1 history to dispute a later claim ("you knew the crack was stable, so this damage is new and excluded") or, conversely, demand ongoing monitoring as a policy condition once a Tier 2 appears. Its limits are stated on the report's face, and the homeowner should weigh that a clean-looking trend chart is still a document about their foundation before sending it to anyone with an economic interest in the answer.
8. Prospective Figures Description
No figures are rendered in this disclosure; the descriptions below specify what an implementing embodiment would depict.
- Figure 1 (illustrative): Marker station installation showing the two adhesive fiducial decals straddling a foundation wall crack, with target geometry, nominal 60 mm separation, station identifier, and millimeter scale annotated.
- Figure 2 (illustrative): Processing pipeline: captured frame with detected target centers, homography-rectified metric image, segmented crack with medial axis and width profile, and the opening versus shear displacement vector diagram.
- Figure 3: Example (illustrative): longitudinal trend chart for one station showing raw opening measurements, fitted thermal cycle, temperature-compensated irreversible growth line, and the ACI 224R class-limit threshold with tier boundaries.
- Figure 4: Example (illustrative): crack network map of a foundation elevation with five stations, per-station tier coloring, and the exported report layout.
Claims
- A system for longitudinal monitoring of structural crack displacement, comprising: a pair of adhesive fiducial decals configured to be bonded to a structure on opposite sides of a crack, each decal carrying at least three machine-readable registration marks of known geometry and a printed millimeter scale; a smartphone with a camera; a software application that calibrates true as-printed registration mark dimensions at commissioning from the printed millimeter scale, captures an image of the decal pair, detects the registration marks, rectifies the image to a metric frame via planar homography, and computes the relative displacement of the two decals between a commissioning visit and subsequent visits with sub-pixel centroid refinement; and a thermal disambiguation module that records ambient temperature at each visit and separates reversible thermo-hygrometric cycling from irreversible growth.
- The system of claim 1, wherein the application decomposes the relative displacement into an opening component perpendicular to the local crack direction and a shear component parallel to the local crack direction.
- The system of claim 1, wherein the application further segments the crack in the rectified image, skeletonizes the crack medial axis, computes a width profile via Euclidean distance transform, and reports the crack width at the marker station cross-section as an independent check on the decal-derived opening displacement.
- The system of claim 1, wherein the homography is solved from at least six mark correspondences by normalized direct linear transform with RANSAC outlier rejection, and wherein the application rejects a visit image when the homography reprojection residual exceeds a design threshold and prompts the user to re-capture.
- The system of claim 1, wherein the thermal disambiguation module performs the separation by fitting a thermal regression only after visits spanning at least twelve months, a full seasonal cycle, and wherein the application reports total displacement with an explicit unresolved-thermal flag until that duration threshold is satisfied.
- The system of claim 3, further comprising a threshold advisory module that compares measured crack width against ACI 224R exposure-class limits and issues tiered advisories for monitoring, increased surveillance, and structural engineer consultation based on cumulative irreversible displacement over the monitored window.
- The system of claim 6, wherein a step change in displacement between consecutive visits exceeding a design threshold triggers the engineer-consultation advisory independent of the absolute width.
- The system of claim 1, further comprising a station registry maintaining multiple marker stations across a structure, each with an identifier, wall location, exposure class, and visit history, and a network map display with per-station advisory tier coloring.
- The system of claim 8, further comprising a report generator that assembles the station map, per-station trend charts, visit images, and threshold comparisons into an exportable document carrying an explicit statement that the data is a monitoring aid and not a structural assessment.
- A method for longitudinal monitoring of structural crack displacement, comprising: bonding a pair of adhesive fiducial decals to a structure on opposite sides of a crack, each decal carrying at least three registration marks; calibrating true as-printed mark dimensions at commissioning by reading a printed millimeter scale on the decal; capturing a commissioning image of the decal pair with a smartphone camera and storing reference target positions; at each subsequent visit, capturing an image of the decal pair, detecting the registration marks, rectifying the image to a metric frame via planar homography solved by normalized direct linear transform with RANSAC outlier rejection, refining target centroids to sub-pixel accuracy, and computing opening and shear displacement relative to the commissioning reference; recording ambient temperature at each visit; and, after visits spanning at least twelve months, fitting a thermal regression that separates reversible thermo-hygrometric cycling from irreversible growth.
- The method of claim 10, further comprising comparing the temperature-compensated crack width against ACI 224R exposure-class limits and issuing a tiered advisory selected from continued monitoring, increased surveillance with shortened revisit interval, and structural engineer consultation, based on cumulative irreversible displacement thresholds.
Implementation Notes
Scope of this disclosure: This document is a design proposal. No prototype has been built and no field validation has been performed; all quantitative parameters in this disclosure (gauge length, pixel density, reprojection thresholds, precision targets, visit counts, advisory thresholds, and growth rates) are untested design choices.
Everything rests on the decal bond. If a decal debonds partially and shifts, the app reads phantom displacement. Three defenses are structural: surface preparation follows tell-tale practice (clean, sound concrete, no paint or efflorescence under the bond); the crack-edge width measurement in Section 4 provides an independent check that does not depend on the decals, and persistent disagreement between the two measurements flags the station for re-commissioning; and a sudden jump in reprojection residual between visits indicates the decal geometry changed, which triggers a re-commissioning prompt rather than a growth advisory.
Painted, patched, or spalling surfaces bound the method. Decals need sound substrate; the crack segmentation needs visible crack edges. A crack that has been filled with epoxy or caulk is no longer measurable by edge profiling, though the decal pair still tracks relative displacement across the repair, which is itself useful for verifying the repair holds. Fresh parging or Drylok coatings bury both the crack and the bond surface; stations should be installed on bare concrete or masonry.
Thermal disambiguation needs a full year. A station commissioned in October and revisited in November has two points and no thermal baseline; the program must not fit a line through noise. This twelve-month gate is deliberately conservative, because anything shorter confounds the seasonal cycle with the trend it is trying to extract, as Section 5 shows. Most foundation cracks a homeowner worries about are stable shrinkage cracks, and the honest early answer is usually that nothing has moved beyond thermal breathing. Treat the unresolved-thermal flag as a feature, not a limitation to be engineered away.
Changing phones changes the camera. A new phone means a new lens, new distortion, and a new sensor, so the program requires re-commissioning, a fresh reference frame, whenever the capture device changes; visit images record the device model so a mid-history phone swap is visible in the audit trail rather than silently absorbed. The old reference frame is retained for continuity but never extended.
Measurement misuse is a foreseeable failure mode. A home seller could install stations only on the cracks that look good and present the report as a clean bill of structural health; a buyer should treat any station map as the seller's selection, not a survey. Conversely, a Tier 3 advisory is not a condemnation: it is a prompt to hire a structural engineer, whose assessment, not the program's, governs. And no monitoring schedule overrides visible distress: a crack that is actively spalling, admitting water, or visibly wider than at the last visit is a call to a structural engineer now, not data for the next scheduled visit. Both limits are stated in the exported report.
All image processing runs on the device. Visit images with the decals visible are stored locally for the audit trail and the engineer report; no imagery is uploaded. Only per-station displacement indices, visit metadata, and trend aggregates leave the device, and then only for backup or the user's own multi-device access.
Prior Art References
- Avongard crack monitoring kit: Mechanical tell-tale crack gauges; two-plate overlapping gauges read to 1.0 mm by eye, 0.1 mm with calipers; manual reading with paper record sheets and a recommendation to record ambient temperature
- ACI 224R-01, "Control of Cracking in Concrete Structures," American Concrete Institute: Table 4.1 guide to reasonable crack widths for reinforced concrete under service loads (0.41 mm dry air, 0.30 mm humid/soil, 0.18 mm deicing chemicals, 0.15 mm seawater, 0.10 mm water-retaining structures)
- Sutton, M. A., Orteu, J.-J., and Schreier, H. W., "Image Correlation for Shape, Motion and Deformation Measurements," Springer, 2009: Sub-pixel digital image correlation methods for displacement and strain measurement
- Concrete crack detection technical report: Crack width measurement via medial-axis skeletonization and Euclidean distance transform with spatial calibration scale
- LITF-PA-2026-051: Building-level foundation settlement detection from tiltmeter arrays; rigid-body rotation measurement, distinct from crack-level displacement
- LITF-PA-2026-134: GNSS-based foundation displacement monitoring with millimeter-level relative positioning over 24-hour observation sessions; absolute position tracking, distinct from sub-millimeter crack monitoring