Only 0.47% of the Homes Destroyed in LA's Fires Are Rebuilt. This Startup Owns the Paperwork Between Insurance Check and Front Door
Sixteen thousand structures burned in January 2025. Insurers have paid $22.4 billion. Yet fewer than one in two hundred destroyed structures had finished reconstruction by late 2026. A house does not get rebuilt by a check. It gets rebuilt by a permit, five or six draw releases, a dozen inspections, and a contractor who stays paid. That chain has no owner.
The Problem
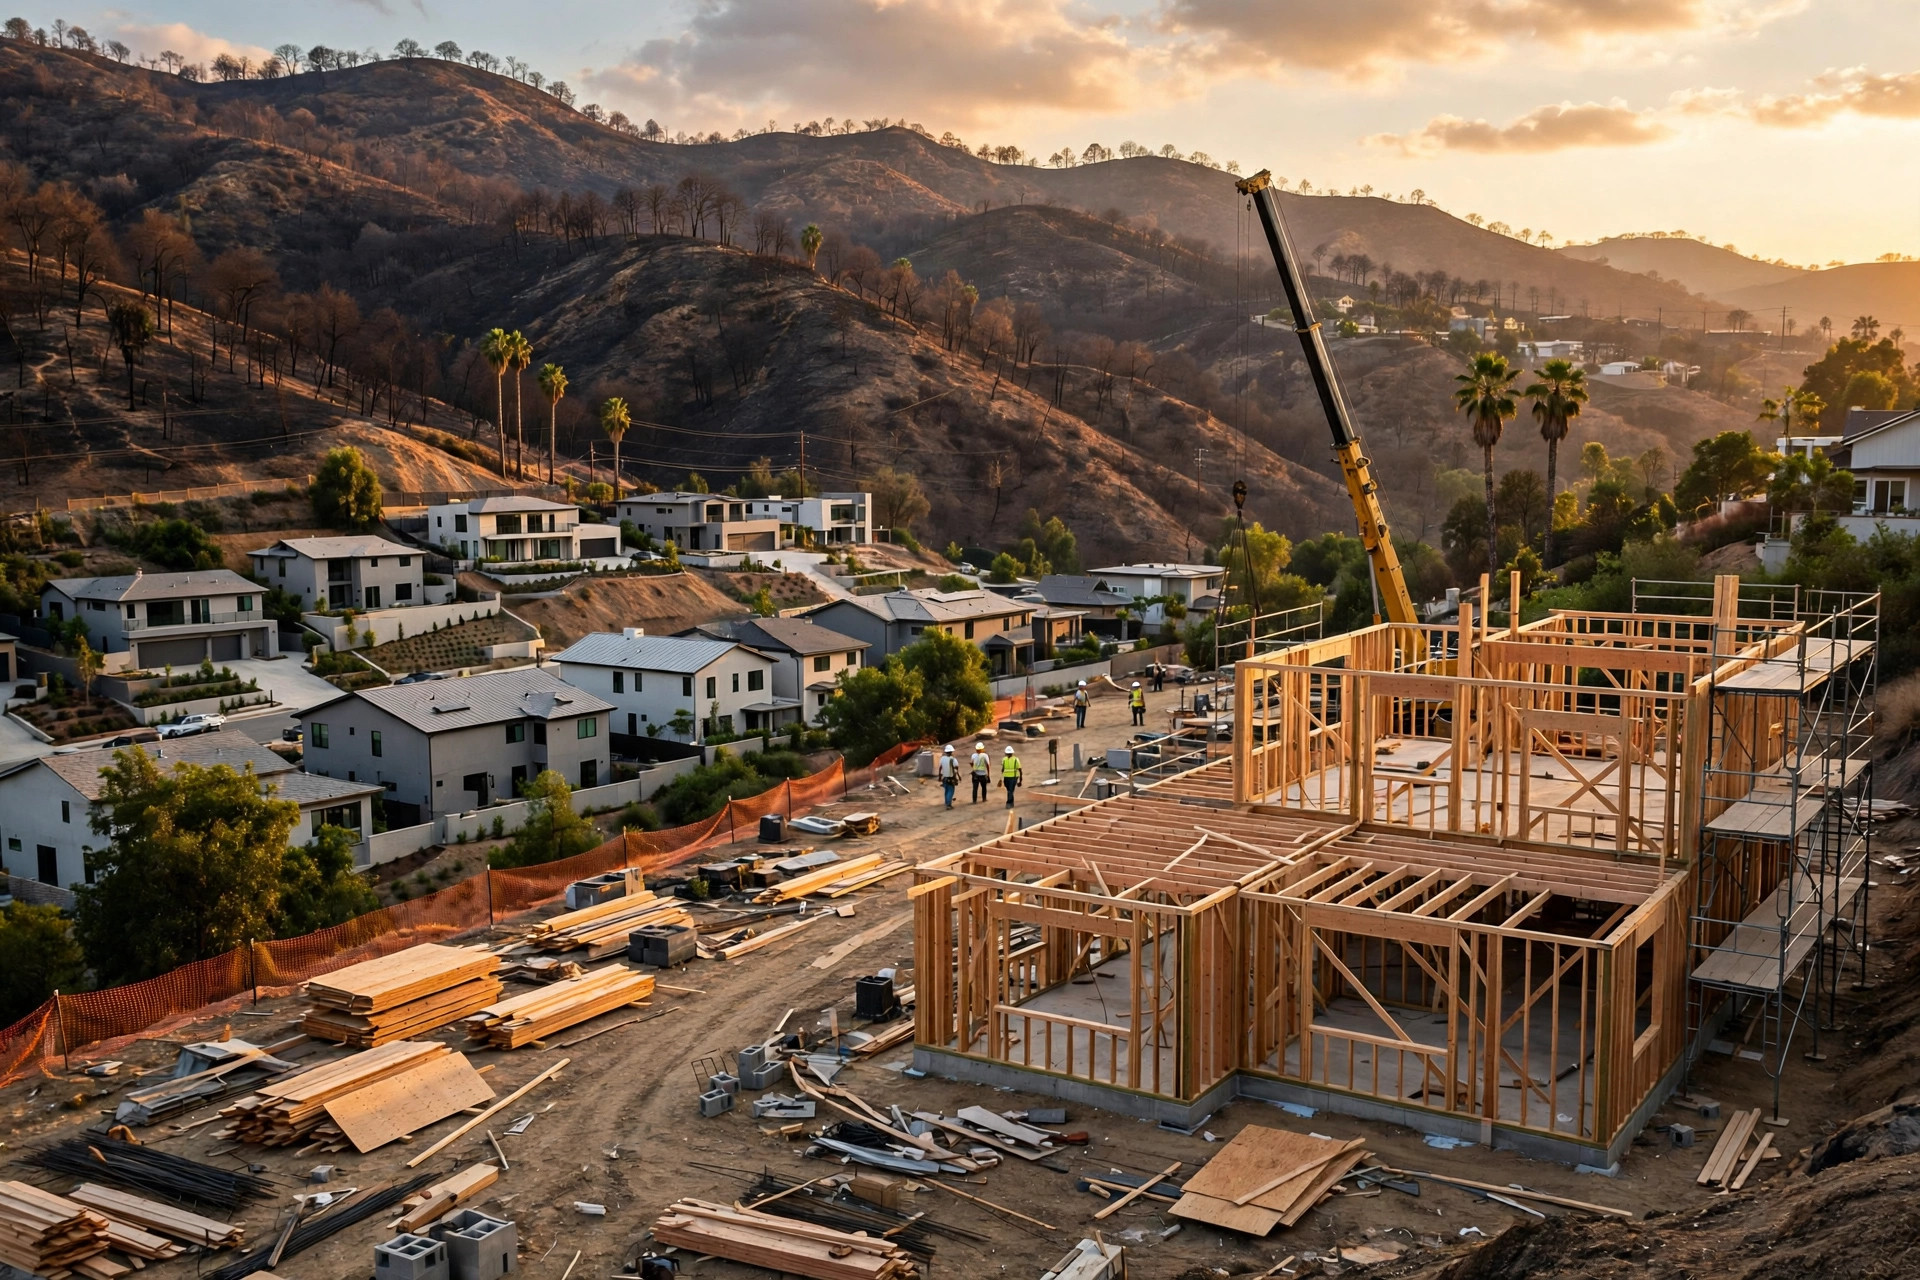
Start with the scale, because it still shocks. Palisades and Eaton erupted hours apart on January 7, 2025, killed 31 people, and destroyed roughly 16,250 structures across 37,469 acres, according to a Los Angeles County economic update reported in late 2026. Palisades alone destroyed 6,837 structures, and Eaton destroyed 9,418. Early modeler Verisk put insured losses at $28 billion to $35 billion, and the California Department of Insurance later reported insurers had paid more than $22.4 billion on 42,121 claims, with 94% fully or partially paid, as reported by Beinsure from CDI figures. Money, in other words, moved, while houses did not.
By the third county economic update, 26.7% of destroyed structures had received rebuild permits, a pace the report called on par with the fastest recovering wildfires in the country. Only 0.47% had completed reconstruction and received occupancy approval. Permit application to issuance averaged 79 days across both fire areas, per that same update. In January 2026, the county had counted more than 2,800 rebuilding and repair permits issued, while only about one fifth of damaged parcels had even submitted a permit application, according to LA County and LAEDC. Read those two snapshots together and a pattern emerges. Permitting got faster while completion stayed rare, which means something between permit and occupancy, some slow and mostly invisible coordination failure, eats years.
That something is a four party coordination failure, and every party is acting rationally inside its own rules, because an insurer that pays slowly protects its reserves, a servicer that holds funds protects its collateral, a contractor that demands deposits protects its crews, and a homeowner who signs whatever is put in front of them is usually just trying to get back into a house before the next school year starts. An insurer settles a claim, often in pieces, and disputes scope, code upgrade coverage, and contents. A mortgage servicer holds the insurance proceeds in escrow and releases them in draws tied to inspected milestones, because the loan is secured by a lot with no house on it. A contractor needs deposits and steady draws to keep crews and materials scheduled, and will not carry a job for months while paperwork circles. A homeowner, displaced and paying rent, must translate between all three while also picking a design, clearing a lot, and satisfying a city or county permit desk. No single party sees the whole file, so the file stalls.
October 2026 proved the stall is not anecdotal. California's Department of Financial Protection and Innovation ordered mortgage lenders and servicers to report how they handled insurance proceeds for LA fire survivors, after receiving more than 160 complaints about delayed or disputed disbursements, according to WRE News. Governor Newsom had written to lender associations in July 2026 complaining about survivors waiting over a month for proceeds, and directed the state to track institutions that took longer than 10 business days to release funds without an expedited appeals process. In August 2025 he had already signed AB 493, requiring institutions to pay homeowners interest on escrowed insurance funds. Regulators, in short, now treat draw release as an enforcement item. Servicers need auditable draw evidence, and homeowners need someone to produce it. Neither side has a shared system for doing so.
Costs make delay expensive in a way that compounds. Rebuild costs in California commonly run $570 to $800 or more per square foot, with pre-construction work such as debris removal, soil testing, engineering, and permits routinely consuming $75,000 to $200,000 before construction starts, according to a Tect rebuilding cost guide. Wildland Urban Interface code upgrades added $13,070 to a 1,750 square foot Altadena home in a 2025 Headwaters Economics and IBHS study cited by that guide. Temporary housing over an 18 to 36 month rebuild runs $72,000 to $180,000 in California Department of Insurance figures cited by a Frontline Wildfire cost comparison. Every month a draw sits unreleased is a month of rent paid on top of a mortgage on an empty lot, plus a crew that may take another job. Delay is not neutral, because delay is a second bill.
Market Size
Base TAM calculation: Take the remaining pipeline first, not the burned total. If 26.7% of 16,250 destroyed structures have rebuild permits, about 11,900 structures have no rebuild permit yet. Reports put single family homes destroyed above 11,000, so use 11,000 homes as the conservative LA rebuild cohort still ahead, excluding outbuildings and commercial structures that would only raise the number. Price them at an assumed $750,000 average rebuild cost. That assumption sits below a $570 per square foot rate applied to a 1,800 square foot home, which alone exceeds $1 million, and below Palisades luxury rebuilds, while staying above smaller Altadena homes. It is deliberately conservative for a mixed cohort. At that assumption, the remaining LA construction pipeline is about $8.25 billion (11,000 x $750,000). Sensitivity matters here: at $600,000 the pipeline is $6.6 billion, and at $900,000 it is $9.9 billion. An orchestration business that charges for permit management, draw administration, inspection evidence, and contractor payment coordination can plausibly capture about 2.5% of construction value across fees and subscriptions, which puts the LA pipeline revenue pool near $206 million. That pool is one time, spread over five to seven years of rebuilding, not annual recurring revenue, and any pitch that annualizes it without saying so is misleading.
SAM (five year target): Aim at 2,000 LA homes, about 18% of the remaining 11,000 home cohort, served over five years. At the blended revenue per project in the unit economics table below, about $18,600, that cohort yields roughly $37 million in cumulative revenue. That is the serviceable market for one focused operator, not the whole pipeline, because the operator will not win Palisades luxury design build clients who already have architects, nor Altadena owners who sell their lots instead of rebuilding, nor owners who rebuild with a single trusted contractor and no intermediary. Lot sales are real leakage, and they shrink every cohort estimate that assumes otherwise. A startup that assumes every burned parcel becomes a customer is counting houses that will never be built by their original owners.
Expansion beyond LA comes in two directions. First, the next fire: California will have one, and a product built for LA County and City of Los Angeles permitting, with servicer draw workflows already encoded, ports to the next county faster than a general contractor expands. Second, pre-fire readiness: the California FAIR Plan, the insurer of last resort, faced about $4 billion in claims from the LA fires and needed a $1 billion assessment on member carriers, according to Morningstar DBRS, while its total exposure reached $696 billion. A readiness subscription that keeps a home's insurance file, photos, inventory, and hardening record current, priced at $19 a month, would need only 5% adoption among roughly 696,000 FAIR Plan policyholders to add about $7.9 million in annual recurring revenue. That line is speculative until a single insurer or servicer agrees to accept its records, so treat it as an option, not as the core pitch.
The Product
A rebuild orchestration platform that owns the file from insurance settlement to certificate of occupancy, without becoming the general contractor. Homeowners hire their own licensed contractor, and the platform works for that contractor rather than replacing them. The platform makes that contractor, the servicer, the insurer, and the permit office work off one timeline. Five modules carry the job:
- Permit and code file: Parcel specific checklists for City of Los Angeles and LA County paths, including self certification and pre-approved standard plans where eligible, plus Wildland Urban Interface and Title 24 requirements for the specific lot. Every submission, correction, and clearance lives in one dated record, so a homeowner never re-explains a lot to a new reviewer.
- Draw and escrow administration: Draw requests assembled with photos, inspection reports, invoices, and lien releases in the format servicers actually accept, with a clock on every request. When a servicer holds funds past the state's 10 business day benchmark, the file shows it, dated, with the exact missing document named. Interest on escrowed funds under AB 493 gets tracked, not assumed.
- Contractor verification and payment: License, insurance, and complaint checks before signing, milestone based payment schedules tied to inspected work, and payment released only against evidence. Contractors get paid faster when their evidence is clean, which is the incentive that makes them use the system instead of routing around it.
- Insurance scope tracker: Settlement, supplemental claims, code upgrade coverage, and contents, each tracked against the rebuild budget, so a $40,000 code upgrade gap surfaces in month two, not at framing when the money is gone.
- Homeowner timeline: One plain language timeline, one next action, one owner for that action. Displaced families do not need a dashboard with 40 widgets. They need to know what happens this week, who owes it, and what document unblocks it.
Trust by design: This product touches traumatized people and large sums, so its ethics are part of its moat, not a policy page. No paid lead selling to contractors who bid blind. No percentage of a homeowner's settlement taken as a silent referral fee. No marketing to fire victims in the first weeks after a disaster. Contractor rankings must disclose who paid for placement, or placement must not be sold at all. The platform must never hold client construction funds in its own operating account; draw money moves through regulated escrow or servicer channels, with the platform as administrator and evidence keeper. A company that profits from confusion after a fire will be regulated out of existence, and should be.
Unit Economics
| Metric | Value |
|---|---|
| Onboarding fee (per home) | $2,900 |
| Active rebuild subscription | $249/month x 18 months avg |
| Draw administration (per home) | 1.5% of $750,000 managed proceeds |
| Blended revenue per completed rebuild | $18,600 |
| Gross margin (after verification and inspection costs) | 72% |
| Contribution per rebuild | $13,400 |
| Customer acquisition cost | $2,800 |
| LTV:CAC ratio | 4.8:1 |
| Monthly burn (14 person team) | $200,000 |
| Startup cost (18-month runway) | $3.6M |
| Break-even | About 270 active projects, month 14 on the ramp below |
Methodology note (Table 1): Blended revenue is $2,900 plus $4,482 in subscription fees over 18 months plus $11,250 in draw administration, rounded to $18,600. Contribution of $13,400 is that revenue at 72% gross margin. Monthly contribution per active project is roughly $744 ($13,400 divided by 18 months), so covering a $200,000 monthly burn requires about 269 active projects at once, not 269 completed projects ever. CAC of $2,800 assumes a referral motion through nonprofit rebuild hubs, insurance brokers, and servicer partnerships, plus in person presence at county one stop permit centers, not paid search targeted at fire victims. A paid ads model would be both more expensive and ethically worse. The $3.6 million raise covers 18 months for 14 people (6 engineers and product, 3 rebuild case managers with construction backgrounds, 2 partnerships and servicer relations, 1 designer, 1 compliance lead, 1 CEO), plus legal review for escrow and contractor referral rules. If average rebuild duration stretches to 24 months, subscription revenue per project rises but break-even slips, because contribution is recognized more slowly; if draw administration pricing is capped by servicer agreements, revenue per project falls toward $12,000 and break-even needs about 400 active projects. Both sensitivities belong in the fundraise deck.
Competitive Landscape
| Company / Channel | What It Does | Gap This Startup Exploits | Pricing Signal |
|---|---|---|---|
| Builders Alliance | Nonprofit portal from 10 homebuilders, with pre-designed turnkey homes filtered by lot, zoning, and price, pitched at or below average insurance proceeds | Builder selection, not file orchestration. Once a homeowner picks a builder, permit, draw, and insurer coordination still falls to the homeowner and builder. | Free portal; builder contract priced separately |
| PaliBuilds / Bidsy | Palisades marketplace plus contractor bidding software, with more than 200 general contractors and subcontractors onboarded | Strongest direct competitor in Palisades, and contractor side only. It does not administer servicer draws or insurer scope tracking as its core product. | Marketplace; contractor software pricing not disclosed |
| LA Rebuild Hub (Center by Lendistry) | Nonprofit guidance hub with webinars and step by step information on insurance, permitting, architects, contractors, and financing | Information, not administration. A webinar does not file a draw request or chase a servicer. | Free |
| Design-build general contractors | Full service rebuilds from design through construction, including firms marketing 200-plus prior fire rebuilds | One contractor per home, capacity constrained, and conflicted: the builder grades its own payment milestones. No independent draw evidence for the servicer. | Full rebuild contract, typically $600,000-plus |
| Restoration giants and local permit expediters | Emergency restoration, debris and repair work, or permit running for a fee | Point services. Restoration ends before a rebuild starts. An expediter files papers but does not manage insurance scope or draw releases. | Project fees; expediter fees vary |
| Mortgage servicer draw desks | In house inspection and disbursement of escrowed insurance proceeds | Built for the lender's risk, not the homeowner's timeline. Inspection scheduling and document requirements are opaque to the borrower, which is exactly what generated 160-plus DFPI complaints. | No direct homeowner fee; cost buried in servicing |
| This startup | Independent orchestration: permit file, draw administration, contractor payment evidence, insurance scope tracking, one timeline | Only product whose customer is the homeowner's file itself, usable with any contractor, any servicer, and either city or county permitting. | $2,900 plus $249/month plus 1.5% draw administration (seeking $3.6M seed) |
Table 2 shows a market full of helpers and empty of owners. Nonprofits give information, builders build houses, and servicers protect loans, and none of those jobs, done well, adds up to owning the file between them. Each is necessary and none is sufficient, because a rebuild fails at the handoffs between them. PaliBuilds is the competitor to watch, since a contractor marketplace with 200-plus onboarded firms could add draw administration faster than a new entrant can add contractor supply. The defense is independence: a marketplace owned by builders will struggle to be trusted as the neutral party that withholds a payment when work is incomplete, while a homeowner paid orchestrator can.
Go-to-Market
Phase 1 (months 1-8): Win Altadena first, not Palisades. Altadena has more middle income owners, tighter insurance proceeds, and a county permitting path where a standardized file helps most. Partner with LA Rebuild Hub style nonprofits for referrals, staff a desk near the county one stop permit center, and sign two servicers to accept the platform's draw evidence format. Target 120 active projects and zero paid ads to fire victims.
Phase 2 (months 9-16): Expand to Palisades and Malibu with city permitting workflows, add pre-approved standard plan handling, and sign one insurer to accept scope tracking as supplemental claim evidence. Contractor verification becomes a selling point for servicers, who get fewer failed inspections. Target 400 active projects and monthly break-even.
Phase 3 (months 17-24): Productize the draw evidence format as a standalone servicer tool, so servicers pay per file even when the homeowner did not buy the full concierge product. Begin encoding the next California county's permitting and fire code rules before the next fire, not after it. Target 1,000 cumulative completed or active projects and a Series A on servicer and insurer contracts, not homeowner subscriptions alone.
Why Now
Five forces converge in the next twelve months, and the first is the newest.
First, draw delays became a regulatory enforcement item in October 2026. DFPI ordered lenders to account for their handling of insurance proceeds, with a response deadline of October 29, 2026, after 160-plus complaints. Servicers that could previously treat draw timelines as internal process now face a paper trail problem. A vendor that produces that paper trail, in their format, on their clock, is selling compliance, not convenience.
Second, the construction wave is still ahead, not behind. With 73.3% of destroyed structures still without a rebuild permit, the busiest years of LA rebuilding have not happened yet. A company founded now enters before the peak, while a company founded in 2029 will enter a declining pipeline.
Third, permitting itself changed. Los Angeles launched its first self certification pilot for Palisades rebuilding in June 2025 and expanded it to civil engineers in February 2026, with the mayor's office reporting Palisades plans approved in half the time of pre-fire citywide single family projects and more than 70% of home permit clearances no longer required, according to Mayor Bass's office. LA County launched its own self certification pilot for unincorporated areas, with at least 20% of self certified plans subject to random audit, per LA County Recovers. New permit paths reward software that encodes them. Paper checklists go stale in a quarter.
Fourth, insurance economics now punish a bad rebuild for years. FAIR Plan rates rose 29.1% effective October 15, 2026, after a requested 35.8% increase, and rebuilding to current Wildland Urban Interface standards plus documented hardening affects future insurability and premiums. Homeowners who rebuild cheap and undocumented may save in 2027 and pay every year after. A file that proves hardening is an insurance asset, not just a construction record.
Fifth, the competitive window is still open outside Palisades. PaliBuilds owns mindshare in one wealthy neighborhood. Builders Alliance offers designs, not administration. No independent orchestrator has signed servicers at scale. Twelve months from now, either this startup or a servicer vendor will own the draw evidence format, and formats, once adopted by three servicers, are hard to displace.
Original Contribution: The Draw Delay Tax
$13,200 per home. $145 million across the remaining LA cohort. That is the avoidable temporary housing cost of draw delays running past the state's benchmark, and it is a calculation nobody has published in this form. Start with the benchmark: California directed attention to institutions taking longer than 10 business days to release insurance proceeds. Take a typical rebuild with five draw releases. Assume, conservatively and illustratively, that actual release averages 30 calendar days per draw, a figure consistent with survivors reporting waits over a month, but not a measured statewide average (see Limitations). Excess delay per draw is about 20 days. Across five draws, excess delay is 100 days, or about 3.3 months. Temporary housing costs $3,000 a month at the low end of the cited range ($72,000 over 24 months) and $5,000 a month at the high end ($180,000 over 36 months), for a midpoint of $4,000 a month. Multiply 3.3 months by $4,000 and the draw delay tax is about $13,200 per home, paid in rent while the homeowner's own insurance money sits in escrow. Multiply by 11,000 remaining homes and the avoidable pool is about $145 million. Contractor remobilization, material repricing, and permit expiry costs are excluded, so the true cost of delay is higher, not lower, than this number. The point is not precision to the dollar. The point is that servicer delay is priced in rent, month by month, and nobody in the chain currently owns that price.
Run the same arithmetic from the servicer's side, where a single servicer holding $750,000 per home across 1,000 homes controls $750 million in escrow, and the pitch sharpens, because at AB 493 interest on those funds belongs to homeowners, so delay no longer earns the holder free interest, but delay still creates complaint, examination, and litigation risk that a complete draw file removes. A draw file that is complete, photographed, inspected, and timestamped on first submission converts a complaint risk into an audit asset. Servicers should pay for that conversion, which is why the Phase 3 servicer tool matters more than homeowner subscription growth alone.
Limitations
Several weaknesses in this analysis deserve direct statement. First, permit and completion percentages come from different reports with different definitions and dates. County and city counts, repair permits versus rebuild permits, and parcels versus structures do not reconcile cleanly, so 26.7% permitted and 0.47% completed should be read as the best recent aggregate, not as an audited census. Second, rebuild cost per square foot ranges come from vendor guides and contractor marketing, not from audited project level data, and the $750,000 average rebuild assumption is an illustrative blend, not a reported median. At different averages the pipeline moves by billions, as shown in the sensitivity range. Third, the 30 day average draw release in the Original Contribution is an illustrative assumption anchored to reported waits over a month, not a measured mean; DFPI complaints prove friction exists, not its average length. If actual excess delay averages 10 days per draw instead of 20, the draw delay tax halves to about $6,600 per home. Fourth, the TAM assumes most remaining owners rebuild. Lot sales, buyouts, and owners who walk away shrink the cohort, and Palisades lot market activity suggests that leakage is material. Fifth, contractor and servicer adoption is unproven. A platform that no major servicer accepts is a nicer spreadsheet, not a business, and servicer procurement cycles run longer than startup runways. Sixth, money transmission and contractor referral rules vary by state and by servicer agreement; a draw administration fee that looks like a percentage of insurance proceeds may trigger licensing or disclosure requirements that a $3.6 million seed budget must fund from day one.
Strongest Counterargument
The best case against this startup is that the problem solves itself without a new company, in three parts, each serious.
First, free help may be good enough. LA Rebuild Hub gives guidance, Builders Alliance gives designs, and a competent general contractor already coordinates permits and draws as part of a full contract. Homeowners who hire well do not need a fourth party. The startup is selling coordination to buyers who may already have a coordinator, namely their builder, and charging $18,600 for a service the builder bundles.
Second, servicers will fix draws under regulatory pressure without buying a startup's format. DFPI's October 2026 order, AB 493 interest rules, and Newsom's public pressure give servicers every incentive to staff up, publish timelines, and automate inspections themselves. If the three largest servicers ship a decent draw portal in 2027, the independent orchestrator loses its wedge and becomes a redundant layer.
Third, the pipeline is finite and the clock is cruel. LA rebuilding peaks, then declines, and a company built for one disaster cohort must either find the next fire, which cannot be scheduled, or pivot to general renovation orchestration, where Houzz, BuildZoom style marketplaces, and general contractors already compete. A $37 million five year SAM is a good services business and a questionable venture business, unless servicer contracts turn it into recurring infrastructure. The honest exit may be acquisition by an insurer, a servicer vendor, or a builder platform, not an independent public company.
These objections have weight, and the answer to all three is the same: independence plus evidence. Builders cannot credibly certify their own payment milestones to a servicer. Servicers cannot credibly grade their own delay to a regulator. Free portals cannot file a draw. The product that survives is the one whose records both sides accept when they disagree, and that trust, once earned across hundreds of files, is harder to copy than a portal or a design library.
The Bottom Line
Los Angeles did not fail to fund rebuilding, because insurers paid $22.4 billion, and yet funding without coordination turned out to be almost as slow as no funding at all for families measuring progress in rent checks rather than press releases. That is the gap. It failed to coordinate rebuilding, and coordination failure has a price measured in rent, in crews lost to other jobs, and in families still displaced nearly two years after the fire. Permits got faster, self certification arrived, and still fewer than one in two hundred destroyed structures had finished reconstruction. The next bottleneck is not a form. It is a file that four parties share and nobody owns. Whoever owns that file, with records both homeowners and servicers trust, owns the rebuild. That is a smaller, harder, and more honest business than a marketplace that promises to rebuild a city. It is also the one that gets a family back into a house.
What You Can Do
If you lost a home in the Palisades or Eaton fires: demand a written draw schedule from your servicer before construction starts, with the exact documents required for each release, and keep every inspection report, photo, and invoice in one dated file, because the file is your leverage when a release stalls. Ask your contractor for milestone payments tied to inspected work, not calendar dates, and get code upgrade coverage in writing from your insurer before framing. If you are a contractor: publish your license, insurance, and fire rebuild history in a verifiable form, and submit draw evidence complete on first filing, because clean evidence is now the fastest way to get paid. If you are a servicer or insurer: adopt a common draw evidence format and a 10 business day clock with a named appeals contact, before the next DFPI data request makes the format for you. And if you are a founder: build for Altadena's budget constraints first, not Palisades luxury, because a product that only works where insurance proceeds exceed rebuild cost will never serve the owners who need coordination most. The rebuild is not over. The paperwork is the rebuild.
Related
📰 Wildfire Defensible Space Compliance SaaS for California Property Owners — the prevention side of the same risk: clearing and documenting defensible space before a fire, not after one
📰 Syracuse Replaced 700 Lead Pipes Last Year. The EPA Requires 1,400. Nobody Sells the Software for the Other 700. — another orchestration gap, where permits, contractors, and funding move at different speeds
📰 Fiber Broadband Permit & Milestone Tracking SaaS for BEAD Subgrantees — permit and milestone tracking as a product, applied to infrastructure instead of homes