26 Million Kids Ride 480,000 School Buses. 21,200 Drivers Are Missing, and the Routing Software Is Stuck in the 1990s.
America runs the largest mass transit system in the country every school morning, and it runs it on software built before the smartphone, on routes drawn by hand, with parents calling the office to ask where the bus is. The driver shortage made the old way unworkable. The electric bus transition will break it completely. Somebody has to rebuild the routing layer.
The Problem
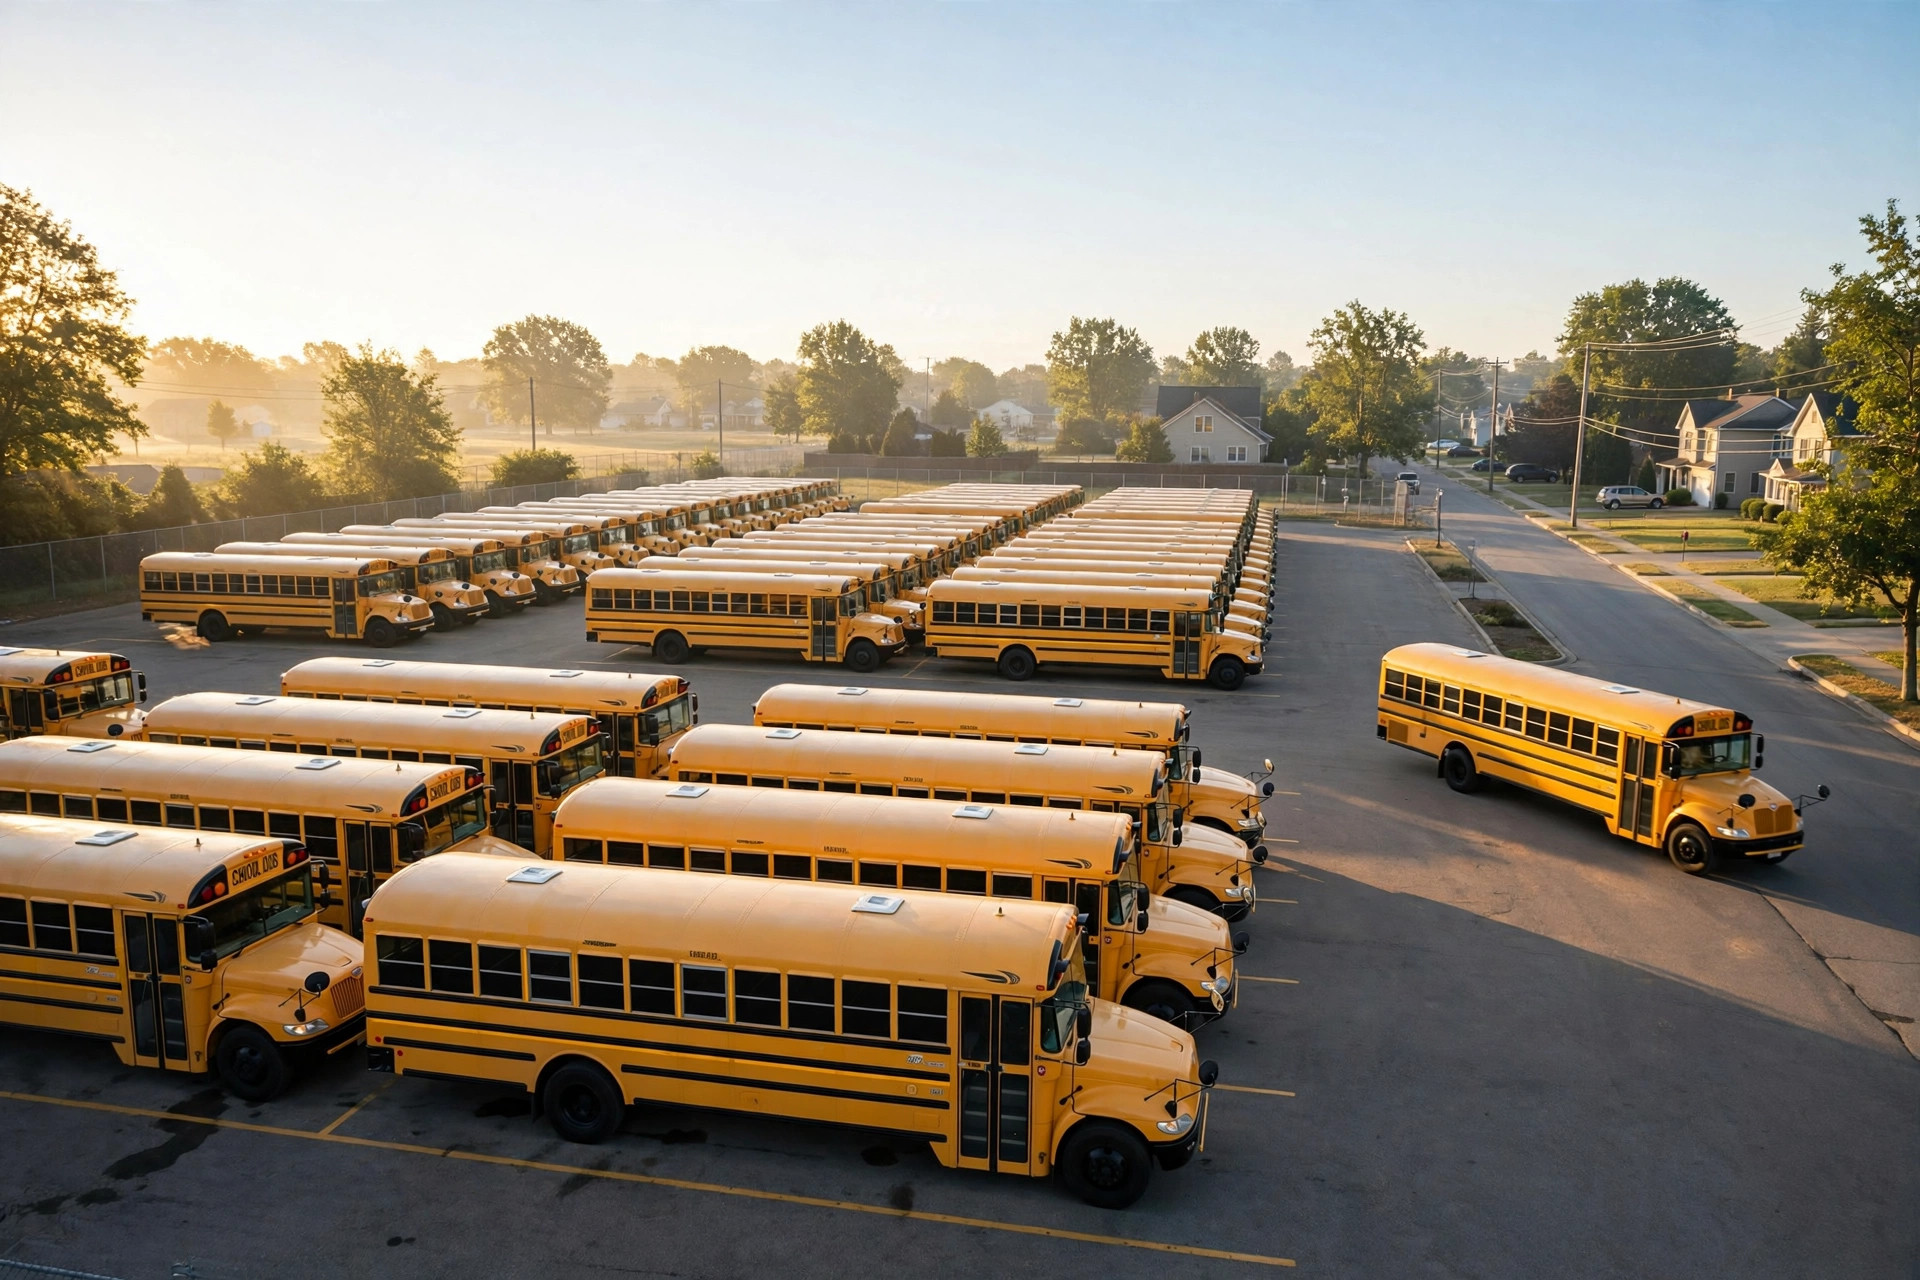
Every school day, about 480,000 yellow buses carry roughly 26 million children to and from school. The fleet is two and a half times the size of every other form of mass transportation in the country combined, transit buses, intercity buses, commercial airlines, and rail included. The buses drive about 6 billion miles a year and make roughly 10 billion student trips, which makes it the biggest transportation operation in America, and almost nobody thinks about it until it fails.
It is failing in slow motion. The National Center for Education Statistics puts public spending on pupil transportation at $27.9 billion in 2018-19, or $1,152 for every student transported, and that was before the post-pandemic cost surge. A 2025 survey by the Associated Press-NORC Center and HopSkipDrive found that 81% of school administrators say bus driver shortages are a problem in their district, including 46% who call it a major problem. A quarter of districts have responded by cutting or shortening routes, and the 2026 edition found 71% of administrators had experienced at least one documented consequence in the past year: longer rides, missed pickups, staff burnout, canceled extracurricular transport. The Economic Policy Institute counts 21,200 fewer school bus drivers employed in August 2025 than in August 2019, a 9.5% decline, with the private contractor workforce down 28.8% over the same period. Employment ticked up about 1.1% in the most recent year, a recovery of about 2,300 drivers against a hole measured in tens of thousands.
Here is what a shortage does to a transportation department: a district with 60 buses and 52 drivers cannot run 60 routes, so it consolidates, which means longer rides, earlier pickups, later drop-offs, and more kids standing at stops in the dark. It means the transportation director spends the morning reassigning routes by hand and the afternoon answering parent phone calls, while teachers and office staff step away from their core duties to drive buses or manage car lines, which 83% of districts had staff do at least a few times a year, and 54% did weekly, according to NPR Illinois' report on the survey. Every one of those workarounds is a routing problem. Fewer drivers have to cover the same students, and the only lever that does not cut service is better routes.
The second shock is the electric transition. The EPA's Clean School Bus Program set aside $5 billion to replace diesel buses with electric and clean-fuel models. About $2.8 billion has been awarded to more than 1,280 districts, funding about 8,725 buses, and more than 5,100 electric buses were already in service by July 2025. An electric bus costs $300,000 to $440,000 against $98,000 to $154,000 for diesel, according to the Government Accountability Office, and it also has a range that shrinks in cold weather, a charging window that competes with the morning route, and a manufacturer base that just watched Lion Electric go bankrupt in December 2024 after taking roughly $160 million in program funds. In February 2026 the EPA moved to restructure the program toward multiple fuels and canceled the 2024 rebate round, which means districts are about to run mixed fleets of diesel, electric, propane, and gas buses, each with different range, refueling, and cost profiles, on routing software designed when every bus burned diesel and range was never a constraint.
And the most expensive routes are the ones nobody optimizes at all. Special education transportation and McKinney-Vento transport for homeless students are legally mandated, door-to-door, and planned by hand in most districts, and the bills show it: Fall River, Massachusetts, expects to spend about $17 million on busing this school year, with special education rides at $9.08 million of it and rides for homeless students at $3.57 million. A regular education bus there now costs $741 a day, and Massachusetts averaged $13,825 per special education student transported in fiscal 2024, across nearly 62,000 students. These are small numbers of students on very expensive routes, and they are the routes where a routing engine earns its keep fastest, because every redundant mile is a mile driven in a van with one child in it.
Why the Current Tools Miss the Mark
The incumbents are real companies with real market share, and that is exactly the problem, because they won the market in the 1990s and 2000s, and their products still carry that era's assumptions: desktop software, annual contracts negotiated by quote, implementations measured in months, and a data model built around routes rather than students.
| Company | What They Do | What's Missing |
|---|---|---|
| Tyler Technologies (Versatrans / Traversa) | The largest provider, with more than 1,900 districts using Versatrans and 7 million students transported by districts on the platform. Routing, boundary planning, fleet management, and the Ride 360 parent app, sold as one enterprise suite. Used by about 30% of the 100 largest districts, per a 2019 announcement, including a statewide deal in South Carolina signed in 2020. | Quote-based enterprise pricing, multi-month implementation with data migration and training, a parent app that is an add-on to a route-centric system, and no energy-aware EV routing, no ridership verification, and no special-transport module. |
| Transfinder | Routefinder PLUS routing with the Stopfinder parent app, the Wayfinder driver app, and Tripfinder for field trips, sold as a full transportation suite. The company says one in three North American students ride buses routed with its technology, and it keeps winning districts, including seven in Ohio and five in New Jersey in 2026. | Separate apps mean separate logins, data, and invoices, on desktop-era workflows under a modern skin, with opaque pricing and optimization treated as a feature rather than the product. |
| Edulog | A long-standing routing and operations platform with a parent portal, widely deployed in large districts and state-level systems across the country. | Earlier-generation interface and deployment, weak real-time GPS so the parent portal shows the plan more reliably than the bus, no EV energy modeling, and state reporting that varies by state. |
| Zonar | Zonar Bus Suite combines routing, dispatch, field trips, GPS, and parent communication, with Z Pass ridership tracking and electric bus state-of-charge data. | Quote-based enterprise pricing, onboarding that grows involved as modules combine, and a telematics-first heritage: routing arrived through acquisition, and there is no special-transport dispatch or ROI story built for a small district. |
| Samsara | Connected operations platform combining GPS tracking, AI dash cameras, vehicle diagnostics, and driver safety, with an AI ridership tool for school districts launched in May 2026 and devices preinstalled on new IC Bus school buses. | Built for many industries, so school routing is less mature than dedicated tools, with quote-based pricing plus hardware and more platform than a smaller fleet needs. |
| BusPlanner | All-in-one district system covering routing, route optimization, dispatch, live tracking, maintenance, field trips, parent communication, and ridership tracking. | Quote-based pricing, a smaller ecosystem than the largest platforms, and no energy-aware EV routing or special-transport dispatch. |
| HopSkipDrive | A rideshare network for the small-group trips buses serve badly, including special education, McKinney-Vento, and foster care, and the backer of the 2025 and 2026 State of School Transportation reports. | A per-ride service, not a routing platform: it fills gaps at rideshare prices without ever routing the fleet. |
| BusBoss | Affordable routing aimed at small districts, positioned as the low end of the market with pricing to match. | Basic optimization, thin or absent parent tracking, and no EV or ridership-verification story: cheap precisely by doing less. |
| Spreadsheets and Google Maps | The actual incumbent for thousands of small districts: a routing spreadsheet, a shared map, and the transportation director's memory. | No optimization, ridership data, parent communication, state reporting, or audit trail: every route change is manual, every driver absence is a crisis, and the largest addressable segment buys nothing today. |
Here is the pattern: the combined suites exist, and Zonar, BusPlanner, and Samsara all bundle routing, ridership, and parent communication in some form, but they sell as quote-based enterprise platforms with multi-month onboarding, built for large districts and contractors. The small and mid-size districts that still route by hand get a routing tool, a tracking app, or nothing. Nobody sells the whole operation, routes, ridership, parents, energy, and the special-transport desk, as one product a 40-bus district can adopt in weeks. That is the opening.
What Gets Built
A cloud routing and operations platform for K-12 transportation, built for the districts the incumbents ignore and the contractors who run multi-district fleets, and organized around six components that cover routing, ridership, parents, energy, special transport, and reporting.
1. Student-centric routing engine: The data model starts with the student, not the route, and every rider carries eligibility, address, school, bell time, special needs, and IEP transportation requirements. The optimizer builds routes from that data using open routing engines and a vehicle-routing solver, with constraints the incumbents treat as afterthoughts: maximum ride time by grade, wheelchair lift capacity, aide requirements, one-way streets and railroad crossings, and bell-time staggering. Re-optimization is a button press, not a consulting engagement, so when three drivers call in sick, the dispatcher re-runs the morning in minutes and sees exactly which stops move and which ride times breach policy.
2. Ridership verification: A badge or card tap when a student boards and alights, plus GPS on every vehicle, closes the gap that costs districts real money. Routes are planned for assigned riders, but a meaningful share of assigned riders never ride, and districts keep running buses for ghosts. Ridership data also feeds state reimbursement, since several states allocate transportation aid on reported ridership, and a district that can prove who rode, when, and on which route defends its aid claim with data instead of estimates. With it, the bus becomes a counted service instead of a scheduled hope.
3. Parent app that answers the only question parents ask: Where is the bus. Live map, estimated arrival, push alerts for delays, and a message channel to the transportation office. Districts field a constant stream of "where is the bus" calls every morning, and each call is staff time, which is why the app exists: to delete those calls. It shows only a family's own child's bus, with location sharing scoped to the route and the school day, and no student data stored on the device beyond the session.
The trust question deserves its own paragraph, because this product tracks the live location of children. Parent accounts require opt-in consent, location history is kept only for the school day plus a short dispute window and then deleted, and no location data is sold or shared outside the district and its contractor. The sensitivity is highest for McKinney-Vento and foster children, where a live location can expose a shelter or a foster home, so those routes default to the narrowest sharing: the assigned guardian sees the bus, nobody else sees the child, and the district controls the retention clock. A breach notification plan and a named data-protection contact are part of onboarding, not an afterthought, because a parent app that shows the wrong child's bus once loses the district's trust for years.
4. Energy-aware EV and mixed-fuel routing: The module the transition forces into existence. Each vehicle carries a fuel or charge profile, battery capacity, consumption per mile by temperature, charger location and speed, and dwell time, so the optimizer will not assign a 140-mile winter route to a bus with 120 miles of cold-weather range. It schedules charging into the midday gap between morning and afternoon runs and flags routes that only work if the bus charges at a depot it cannot reach. As the EPA program shifts toward propane, gas, and hydrogen alongside electric, the same model extends to any fuel, because the constraint is the vehicle's energy budget, not its brand.
5. Special-transport dispatch: A separate workflow for the expensive tail, special education, McKinney-Vento, foster care, and out-of-district placements, covers trips that are door-to-door, low-occupancy, and legally mandated, which makes them the worst fit for bulk routing and the best fit for a dedicated optimizer that batches compatible trips, respects aide and equipment constraints, and prices each trip so the district can see what it costs. A 5% efficiency gain on those routes is worth more than a 5% gain on the regular fleet.
6. State reporting and contractor billing: The unglamorous module that closes the sale. Every state has its own transportation report and aid formula, and incumbents monetize the state-specific templates, while the platform generates them from the same ridership data it already collects. For contractors, it produces per-route cost and per-district billing from actual miles and hours: the data a contractor needs to renegotiate and a district needs to audit.
What One Fewer Bus Is Worth
This is the calculation the pitch stands on, so here are the inputs, in the open, with every assumption stated plainly enough for a transportation director to redo the math on a whiteboard.
A school bus costs roughly $53,000 a year to run, fully loaded. The pieces: a driver at the median wage of $22.45 an hour working about 5.5 hours a day for 180 school days earns about $22,200, and benefits and payroll taxes add roughly 30%, bringing the driver to about $29,000. Fuel is about 12,000 miles a year at roughly 7 miles per gallon, or about 1,700 gallons at $3.80, which is about $6,500, while a diesel bus costs $98,000 to $154,000, so call it $125,000 over a 13-year life, or about $9,600 a year in depreciation. Maintenance, insurance, and tires run about $8,000, which brings the total to about $53,000 per bus per year.
Check that number against the national total. Multiply $53,000 by 480,000 buses and you get about $25.4 billion, against NCES's $27.9 billion in actual pupil transportation spending. Administration, special-education vans, and contractor margin explain the gap, which is exactly what you would expect. The comparison is approximate in one direction: the NCES total excludes capital outlay, while the $53,000 includes about $9,600 of depreciation, so the model slightly overstates the operating side.
Now run it for a mid-size district with 60 buses, which spends about $3.2 million a year running them, and if re-optimization and ridership verification cut 3 buses, a 5% reduction, the district saves about $159,000 a year, every year. The software costs $15 per bus per month, or $10,800 a year for 60 buses, and the return is about 15 to 1. Even at a 2% reduction, barely more than one bus, the saving is about $53,000 to $64,000 against an $11,000 subscription, or roughly 5 to 1. The product does not need to be clever; it needs to delete one bus out of fifty and prove it did.
Revenue Model
| Revenue Stream | Amount | Notes |
|---|---|---|
| Core routing (per bus, monthly) | $15 | Routing engine, dispatch, driver app, and state reporting, billed per active vehicle. |
| Parent tracking and ridership verification (per transported student, yearly) | $3 | Badge tap on boarding, GPS, and parent app. A 3,000-rider district pays $9,000 a year, and the verification data doubles as the state-aid defense. |
| EV energy-aware routing module (per bus, monthly) | $8 | Charged only on electric and alternative-fuel vehicles, and small today against the funded fleet of about 8,725 buses. |
| Special-transport dispatch (per vehicle, monthly) | $25 | Vans and small buses on special education, McKinney-Vento, and foster routes, priced higher because the routes are hand-built and the savings per vehicle are the largest. |
| Field-trip and activity-trip module (per district, monthly) | $99 | Trip requests, driver assignment, and billing for sports and field trips, which most districts still run on paper forms and phone calls. |
| Implementation and onboarding (one-time) | $2,500-7,500 | Data import, stop validation, route audit, and dispatcher training, priced by fleet size and deliberately cheap. |
Unit economics on a 60-bus district: Core routing at $15 per bus per month is $10,800 a year, parent tracking for 3,000 transported students at $3 is $9,000, and with the field-trip module at $1,188 and a modest EV module, the district pays about $22,000 a year. Acquisition cost is $3,000 to $6,000 through state pupil-transportation conferences and the NAPT and STN events where transportation directors gather. Districts keep transportation software for years once routes, stops, and parent accounts live in it, so at a 5-year average retention, lifetime value is about $110,000 against a $4,500 midpoint acquisition cost, or roughly 24 to 1.
Market Size
TAM: The software market, not the $27.9 billion operations spend, is core routing at $15 per bus per month across 480,000 buses, or $86.4 million a year, plus parent tracking and ridership verification at $3 per transported student per year across 24.2 million transported students, or $72.6 million. Field-trip, dispatch, and EV modules add roughly $30 million by our estimate, for a total addressable market of about $190 million a year for K-12 routing and tracking software in the United States. The 26 million figure counts every child who rides a school bus; the 24.2 million counts students transported at public expense, the NCES basis for the per-student price, so the two numbers describe different universes. Add private school fleets, charter networks, and head-start transport and the figure pushes toward $250 million.
SAM: The reachable slice is districts with under 200 buses, which is most of the roughly 13,000 districts in the country, plus private contractors running multi-district fleets. The 100 largest districts are Tyler and Transfinder territory and are excluded from the near-term target, which leaves about 60% of the fleet by our estimate, or roughly $115 million a year.
SOM (year 3): 80 districts averaging 40 buses, with 60% attaching parent tracking. At roughly 50 students per bus, the districts transport about 160,000 students, so 60% attach means about 96,000 tracked students. Core routing on 3,200 buses at $15 a month is $576,000, parent tracking for those 96,000 students at $3 is $288,000, and special-transport dispatch and field-trip modules add about $100,000, for a total of approximately $964,000 ARR. That is about 0.8% of SAM and 0.6% of the districts in the target segment. A routing product that cannot win 80 of 13,000 districts in three years does not have a distribution problem; it has a product problem.
Why Now
The driver shortage is structural, not cyclical. Since 2019, the workforce has shrunk by 21,200 drivers, the contractor segment is down nearly 29%, and wages have had to rise just to stabilize hiring, because the labor pool of part-time drivers willing to split shifts at dawn and mid-afternoon is finite. Using fewer drivers better is the only remaining lever, and that is a routing problem with a software answer: the 2026 State of School Transportation report shows the shortage still producing documented consequences in 71% of districts, so waiting for hiring to recover is a plan to keep cutting routes.
The electric transition breaks diesel-era routing. The funded fleet is already on the road while the program that paid for it is being restructured toward multiple fuels and a major manufacturer has gone bankrupt mid-delivery. A district that ordered electric buses on diesel assumptions will discover the mismatch on the first cold morning, and energy-aware routing, which models range against temperature and schedules charging into the midday gap, goes from a nice feature to a condition of operating the fleet at all.
Parents now expect to see the bus. The parent who tracks a pizza and a rideshare will not accept calling the school office to ask where the bus is, and the districts that have shipped a parent app report the call volume drop as the first visible win. Parent tracking crossed from amenity to expectation while the incumbents were still selling it as a module.
The most expensive routes are the least optimized. Special education and McKinney-Vento transport now dominate district busing budgets, and Massachusetts pays an average of $13,825 per special education student transported. These routes are planned by hand because the general routing tools handle them badly, so a product that starts with the expensive tail instead of the bulk fleet finds buyers with the largest pain and the clearest ROI.
The routing math got cheap. Open routing engines and vehicle-routing solvers do in open source what cost the incumbents millions to build in the 1990s, and commodity GPS trackers cost tens of dollars instead of hundreds. The product is no longer the solver but the workflow around it: student data, bell times, state reports, parent apps, and the dispatcher's morning, which is a product a small team can build in a year, and the window will not stay open once an incumbent rebuilds.
Startup Costs
| Category | Cost | Notes |
|---|---|---|
| Platform engineering (12 months) | $340K | 2 backend + 1 frontend + 0.5 routing specialist. Student data model, solver integration, dispatch console, driver app, parent app, state reporting generator. The solver is open source; the hard part is the data model and the constraints districts run on: bell times, ride-time caps, lift capacity, aide rules. |
| Routing engine and map data | $25K | Self-hosted open routing engine, commercial map data, geocoding for address validation, and routing quality testing against incumbent output. |
| GPS hardware and ridership pilot kit | $20K | 50 GPS trackers and badge readers for pilot fleets, validating tap-on, tap-off ridership and GPS-to-route matching before any customer pays for hardware. |
| Pilot program (5 districts, 6 months) | $30K | Free platform access, dedicated onboarding, stop validation, and a before-and-after audit of buses, miles, and ride times, measured, not asserted. Target districts of different sizes, at least one with electric buses in service. |
| FERPA, COPPA, and student data compliance | $30K | Legal review of student location data handling, data processing agreements, SOC 2 Type I readiness, and parent consent flows. Location data on minors is the highest-stakes data a school vendor holds. |
| Sales, conferences, and content (year 1) | $40K | NAPT, STN Expo, and state pupil transportation events. A white paper on the true cost per bus, using the open calculation in this article, is the lead magnet. |
| Cloud infrastructure and operating buffer (12 months) | $35K | Cloud hosting, time-series GPS data, map tile serving, customer support, insurance. |
| Contingency | $40K | Procurement delays, long RFP cycles, and the first district needing a state report format nobody has built yet. |
| Total | $560K |
Limitations
The $53,000 per-bus figure is a constructed estimate, not an audited cost, because driver hours vary by district, diesel prices move, and maintenance costs rise with fleet age, so a district with an old fleet or a union contract will see a different number. Run the calculation with local inputs before quoting a saving to a board. The NCES spending total is from 2018-19, the latest year in the detailed table, and post-pandemic costs have risen since, while the 5% route reduction is a planning assumption, not a measured result from a product that does not exist yet, so pilot districts must measure buses, miles, and ride times before and after, and publish the result even if it is 2%. Fall River's projection carries its own flag: the district's slides list line items summing to $15.26 million against the $17.06 million total.
The driver shortage is improving at the margin, with employment up about 1.1% in the most recent year of EPI data, and a faster recovery would soften the urgency without removing the case for better routes. Electric bus adoption is uncertain after the 2026 program restructuring and the Lion Electric failure, so if the revamped program slows awards, the energy-aware module matters later rather than sooner. State aid formulas can also cut against efficiency: where aid follows reported ridership or route counts, a district that deletes a ghost route can lose money on paper even as it saves money in reality.
Small districts are slow buyers: a $22,000 annual subscription still needs a board vote in many districts, an RFP in some, and a budget line in all of them, and sales cycles of 6 to 12 months are normal. Parent location data raises real privacy questions, and a single mishandled incident, a parent app showing the wrong child's bus, would damage trust faster than any feature could rebuild it, which is why the consent, retention, and breach-notification commitments in the build section are product requirements, not marketing copy.
Strongest Counterargument
Tyler and Transfinder already own this market, and owning it is the moat: Tyler serves more than 1,900 districts, Transfinder routes one in three North American students, and both have the references, the state report templates, and the procurement relationships that win RFPs. Switching costs are brutal, because route data, stop history, staff training, and parent accounts all live in the incumbent system, and a startup's optimization edge is maybe 3 to 5%, which the incumbents can match with an EV module and a better parent app in a product cycle or two. The history of school software is a graveyard of better products that lost to distribution.
That case is strong, and it defines the strategy: do not attack the top, because Tyler's statewide deals and the 100 largest districts are not the market; the market is the thousands of districts still routing in spreadsheets, the contractors running fleets across district lines who cannot use a district-licensed tool, and the special-transport desk that the incumbents treat as an afterthought. Win the long tail with a product that onboards in weeks instead of months, prove the bus deletion with measured before-and-after audits, and let the reference districts do the selling. If the incumbents rebuild, they will rebuild for their largest customers first. The risk is real. The wedge is real too.
The Bottom Line
America moves 26 million children on 480,000 buses every school day, spends $27.9 billion doing it, and cannot find enough drivers to staff the routes, while the software that plans those routes was built before the smartphone, the parent app is an add-on, and the electric buses arriving now need routing that understands energy, not just miles. A modern platform that routes from student data, verifies who actually rides, shows parents the bus, and models the fuel or charge in every vehicle can delete one bus out of fifty and return fifteen dollars per dollar spent. The incumbents own the top of the market, and the bottom, thousands of districts still running routes by hand, is open.
What you can do: If you are a transportation director, pull your route list and count the buses that run below half full on an average Tuesday, then ask your vendor what a re-optimization would save and whether it can prove it with ridership data. If you are a parent, ask your district whether it knows how many assigned riders actually board, and what its parent app shows when the bus is twenty minutes late. If you are a builder, start with five districts that will give you their student and stop data for a free route audit, measure buses and miles before and after, and publish the audit, because a routing startup that can show its work wins, and one that only claims it cannot.
Related
📰 School IAQ ASHRAE 241 Compliance SaaS — the same buyer, the school district, with a different compliance gap and the same sticky, budget-line sale
📰 Small Fleet Backoffice Automation — the same fleet operations problem for private operators, where dispatch, billing, and driver paperwork eat the margin
📰 EV Charger Uptime Compliance SaaS — the other half of the electric transition, where the charger network the buses depend on has to actually work