RV & Boat Storage Yield Management SaaS for Independent Lot Operators
The average American RV is driven about 20 days a year and stored for the other 345 (RVIA 2021 owner study). Dedicated RV and boat storage facilities more than doubled from roughly 800 to nearly 1,800 between 2023 and 2025, and Toy Storage Nation's research claims demand is five times current supply. Yet the operators pricing those spaces share no common dataset for what a space should cost. Even the largest operator in the industry publishes only coarse city-level bands: Charlotte $44 to $140 a month, San Diego $155 to $281, Tampa $76 to $343. No within-market benchmark exists anywhere. That is not price discovery.
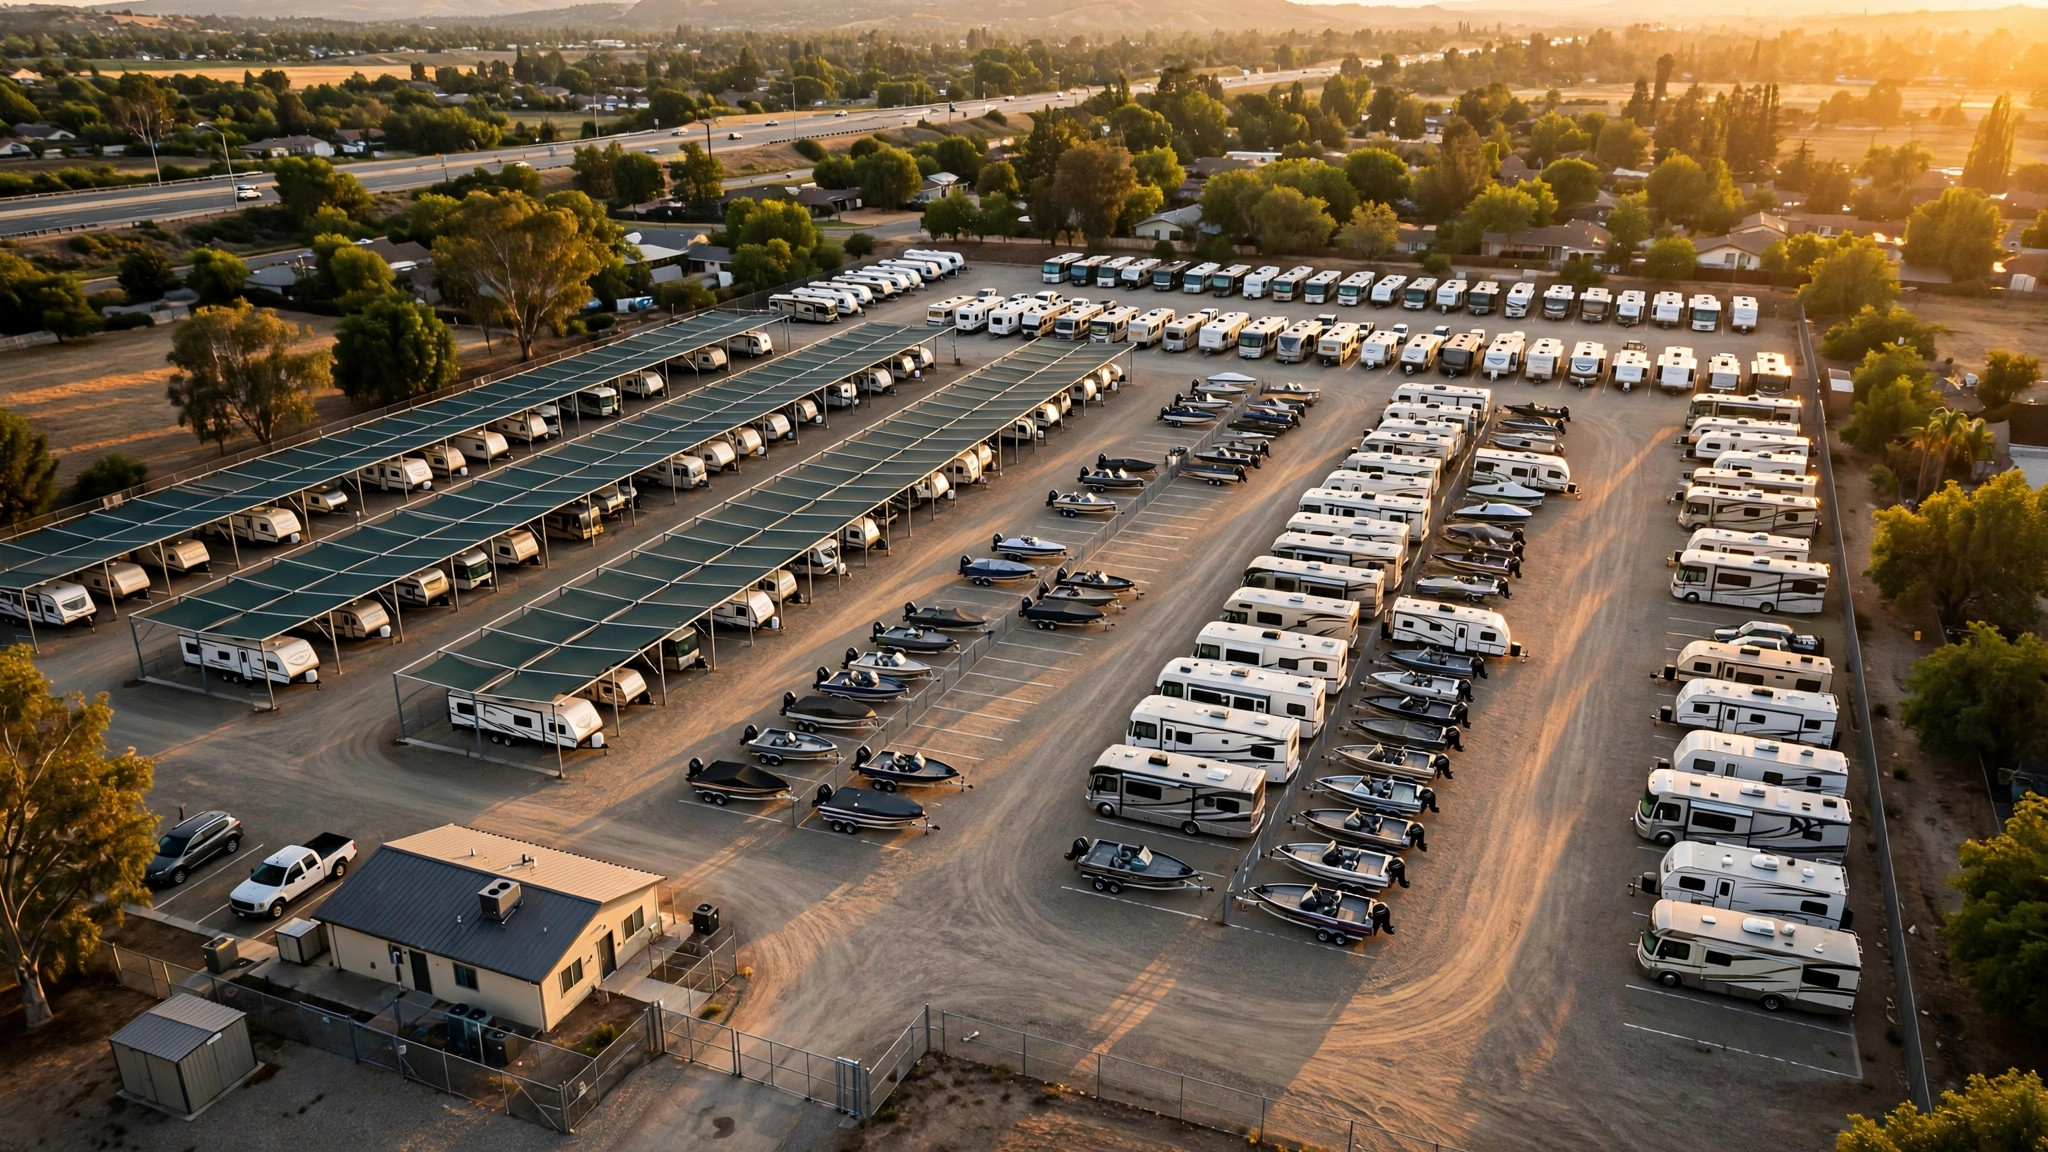
The pitch in one sentence: an STR-style rate benchmark for the 9,600 operators of RV and boat storage, an industry where demand is five times supply and even the largest operator publishes no market-level rate data.
The Problem
- 11.2 million households owned an RV in 2021, up 62% since 2001 (RVIA demographic study, Ipsos)
- 8.1 million current RV-owning households under the revised 2025 methodology, with 16.9 million more intending to buy within five years (RVIA)
- An estimated 11 million registered boats in use (National Marine Manufacturers Association)
- 2.2 million RVs and 1.6 million boats newly registered in the last five years alone (Toy Storage Nation)
- RVIA expects RV shipments to reach up to 366,100 units in 2026
- 23 million Americans planned an RV trip for fall 2026
- Toy Storage Nation puts the combined figure at nearly 25 million households owning an RV or a boat (its own estimate, from a workshop-promotion release; note it exceeds the 8.1M plus ~11M registration bases above, implying multi-vehicle households and unregistered craft)
Almost none of them can park it at home. HOA restrictions on oversized vehicles in driveways have tightened steadily as new housing developments spread, in most jurisdictions: the vehicle is used a few weeks a year and must live somewhere secure for the rest. (Arizona has limited HOA authority over parking on public roadways, but driveway storage of oversized vehicles remains restricted in most markets; the trend is still toward restriction.) Dedicated boat and RV storage facilities are the industry's answer, and capital has noticed. Between 2023 and 2025 the count of dedicated facilities more than doubled from approximately 800 to nearly 1,800, with 56 under construction and 162 more in planning as of early 2025. Toy Storage Nation reports facilities in growth markets at occupancy above 95% with wait lists for specific space sizes.
Yet the analytical layer of this industry does not exist. The 1,800 dedicated facilities plus thousands of self-storage sites with outdoor vehicle parking set space rates by local habit: last year's rate card, a glance at the competitor's fence banner, or whatever the previous owner charged. Extra Space Storage's own city guides illustrate the vacuum at the top of the industry: Charlotte runs $44 to $140 a month, San Diego $155 to $281, Tampa $76 to $343. Those are coarse city-level bands from the largest self-storage operator in the country, a company with REIT-scale revenue management, and each band spans everything from uncovered gravel to enclosed buildings, all length brackets, which is precisely the granularity gap the product would fill. No within-market benchmark is published anywhere. Not by Extra Space, not by anyone. The absence is the opportunity: there is no published number for what a 35-foot covered space actually rents for within a 20-minute drive of any given lot.
Sophisticated buyers already price this inefficiency into acquisitions. A published case study of a December 2025 deal lays out the arithmetic:
| Deal metric | Value |
|---|---|
| Spaces (outdoor and canopy) | 368 |
| Site size | 13.6 acres |
| Purchase price | $4.75 million ($12,900 per space) |
| Day-one NOI at ~89% occupancy | $518,000 |
| Phase 1 capital / projected NOI lift | $369,000 / $187,000 |
| Stabilized gross revenue / NOI | $1.53 million / $1.12 million |
| Stabilized value at 6.0% cap rate | $18.7 million |
| Projected levered IRR | 24.7% |
The buyer's year-one plan lists an "immediate rate push to street levels" as the first value-add item, ahead of tenant insurance rollout, retail, and propane profit-shares. Translation: even professional acquirers underwrite a rate increase on day one, because the prior owner was charging below what the market would bear and had no data telling them so. The 24.7% levered IRR is, in large part, a rate-opacity arbitrage. One caveat on the source: this case study was published by the buyer as a deal-marketing piece, so treat the forward projections as aspirational rather than realized.
Market Size
Original TAM calculation: Start with the demand side. Using the 2025 RVIA figure of 8.1 million RV-owning households and approximately 11 million registered boats, and applying the observed usage figures (RVs used about 20 days a year per the RVIA 2021 owner study; boats used about 54, per Toy Storage Nation), stored vehicle-days per year total (8.1M x 345) + (11M x 311) = 6.22 billion, or 17.0 million vehicle-years of inventory sitting idle annually. Not all of it rents commercial space; assume conservatively that 30% of RVs and 20% of boats pay for off-site storage. These are judgment calls, not surveyed figures, and they are the load-bearing assumptions of the whole derivation: no national survey of where the other 70 to 80% of vehicles live exists. The basis for the estimate is circumstantial but directional, in the sunbelt growth markets where dedicated facilities report 95%+ occupancy and wait lists, HOA coverage in new developments is near-total, and the published case-study lot itself ran at 89% occupancy from day one. The sensitivity analysis in Limitations bounds the effect of being wrong. Implied commercial demand: 2.43 million RV spaces plus 2.2 million boat spaces, or 4.63 million rented spaces.
On the supply side, Yardi Matrix tracks fewer than 2,000 dedicated facilities (cited in Toy Storage Nation's reporting). At an average of roughly 350 spaces per facility (the December 2025 case study had 368), dedicated supply is about 630,000 spaces. Add a generous estimate of 5,000 self-storage facilities each contributing 80 vehicle spaces on average (400,000 spaces) and total professional supply is roughly 1.03 million spaces against 4.63 million spaces of implied demand, a 4.5x gap. Treat this as a consistency check rather than a second independent finding: the idle-days math is the same fleet-and-penetration model rescaled by usage days, and the 5x figure it corroborates comes from a workshop-promotion press release with undisclosed methodology, not from audited research. One model corroborating a trade claim is suggestive, not conclusive.
The software TAM sits on the operator side. Addressable operators: 1,800 dedicated facilities plus an estimated 15% of the 52,000 self-storage facilities (SSA, 2026) that offer meaningful outdoor vehicle parking, or roughly 7,800 sites. Total: approximately 9,600 facilities. At $249/month Standard (benchmarking plus annual rate optimizer) and $549/month Premium (full yield engine plus lease-up intelligence), with a 60/40 split, blended ARPU is $249 x 0.6 + $549 x 0.4 = $369/month. TAM: 9,600 x $369 x 12 = $42.5 million in annual recurring revenue. The 15% figure is a judgment call, so bound it: at 10% of self-storage facilities the addressable base is 7,000 and TAM is $31 million; at 20% it is 12,200 facilities and $54 million. Year 3 target: 450 facilities at blended $369/month = $2.0 million ARR, plus a developer-side feasibility product (see below) contributing another $0.4 million. This is a vertical-SaaS TAM, not a venture-scale one: the business case is a profitable $2M to $5M ARR niche product with pricing power, not a unicorn.
The Product
A rate intelligence and yield management platform purpose-built for vehicle storage operators, combining anonymized transaction data from participating lots with public signals to produce real-time benchmarks and optimization recommendations. Core modules:
- Space-rate benchmarking: The foundational dataset, and the one that does not exist anywhere. Rates broken out by product type (uncovered gravel, covered canopy, enclosed building), vehicle length bracket (under 20 feet, 20-30, 31-40, 41+ feet), and market tier, with occupancy-weighted medians rather than advertised street rates. An operator outside Phoenix should be able to see that a 35-foot uncovered space in their corridor rents at the 30th or 70th percentile, something no fence-banner survey can tell them
- Seasonal yield engine: Vehicle storage has the sharpest seasonality of any storage asset class. Boats in northern markets sit from October to April; RV demand peaks with summer trip planning. The engine recommends seasonal rate adjustments and, more importantly, optimal lease structures: which markets support 12-month contracts at a premium to seasonal pricing, and where the operator is effectively giving away the peak months at annual-contract rates
- Ancillary revenue optimizer: The December 2025 case study's Phase 1 plan shows where the hidden margin lives: tenant insurance rollout targeting 45% penetration, a retail counter with RV and marine supplies, and zero-capital profit shares on ice and propane. Most independent lots sell none of these. This module benchmarks ancillary penetration against participating facilities and prices the gap in dollars per space per year
- Lease-up and feasibility intelligence for developers: With 56 facilities under construction and 162 in planning, developers are the fastest-growing customer segment. They need corridor-level feasibility data: implied demand from registrations, competitive supply within a 20-minute drive, and realistic lease-up timelines. Toy Storage Nation's Troy Bix estimates nearly 70 projects per month would be needed to meet demand; the operators actually building those 218 facilities are underwriting blind without market data
- Occupancy sensing without manual reporting: The cold-start data problem is solvable with hardware that costs under $200 per gate: camera-based space counting that feeds occupancy directly into the benchmarking pool. Operators contribute data passively instead of filling out surveys, which is the only contribution model that works in an industry where the average independent operator has no data staff, no analyst, and no slack for software that asks for extra work. The cameras count occupied and empty spaces, not people and not license plates, and the hardware ships with a compliance mode that deletes imagery after counting. Tenant notice plus written data-retention policies are part of the onboarding checklist, not an afterthought, because state image-capture rules vary and mishandling them would poison the data network faster than any competitor could.
Unit Economics
| Metric | Value |
|---|---|
| Monthly subscription (Standard: benchmarking + annual optimizer) | $249/facility |
| Monthly subscription (Premium: yield engine + feasibility intel) | $549/facility |
| Blended ARPU (60/40 split) | $369/month |
| Data infrastructure cost per subscriber/month | $22 |
| Data acquisition cost per subscriber/month | $15 |
| Customer acquisition cost | $2,400 |
| Expected LTV (30-month avg retention) | ~$10,000 |
| LTV:CAC ratio | 4.2:1 |
| Startup cost (18-month runway) | $2.4M |
| Break-even | 19 months |
Methodology note: Gross margin derives as ($369 blended ARPU minus $22 data infrastructure minus $15 data acquisition) / $369, roughly 90%. LTV of ~$10,000 assumes 30-month average retention at that margin, mirroring STR-style hotel benchmarking products, whose customers become dependent on the data during their annual pricing cycle. In vehicle storage that cycle is the spring rate reset before the RV season, and the stickiness logic is identical: once the benchmark informs the one decision that sets a year's revenue, dropping the subscription means pricing blind again. CAC of $2,400 reflects a fragmented, owner-operator market where the SSA trade shows and Toy Storage Nation workshops are the distribution channels. The $2.4M startup budget assumes a 9-person team: 4 engineering (platform plus the camera-based occupancy pipeline), 2 data science, 2 sales, 1 founder. That works out to roughly $178,000 fully loaded per person-year over 18 months, which fits an early team mixing senior hires with junior ones. Payback period on CAC: 7.2 months at the 90% gross margin. The 19-month break-even is underwritten on reaching roughly 400 paying facilities by then; against a year-3 target of 450 with monetization starting in month 9, that ramp is the plan's most aggressive assumption.
Go-to-Market
Phase 1 (months 1-8): Seed the data network in the three densest vehicle-storage corridors: the Phoenix-Tucson corridor, central Florida, and the Dallas-Fort Worth metroplex. Recruit 120 operators to install the sub-$200 gate camera and contribute anonymized occupancy and rate data in exchange for free benchmarking access. Target through the SSA regional chapters and Toy Storage Nation workshops, where the professionalizing segment of the industry already gathers. These three markets cover the sunbelt demand core where reported 95%+ occupancy and wait lists make operators most receptive to pricing data.
Phase 2 (months 9-16): Monetize with the $249/month Standard tier. Expand to six more markets: Atlanta, Denver, Nashville, Charlotte, San Antonio, and the Inland Empire. Launch the seasonal yield engine trained on Phase 1 occupancy curves. Begin integrating with existing management software (Storable, SiteLink) so operators who already run one of those platforms can pipe rate and occupancy data automatically rather than relying solely on the camera feed.
Phase 3 (months 17-24): Launch the $549/month Premium tier with the ancillary revenue optimizer and the developer feasibility product at $1,200/report or $6,000/year per developer seat. Approach the consolidators and REITs (Extra Space, Public Storage) who are adding vehicle storage to their portfolios as enterprise clients needing corridor-level benchmarking for acquisition underwriting. Enterprise tier at $3,000/month per portfolio, minimum 8 facilities.
Competitive Landscape
| Company | What It Does | Rate Intelligence? | Pricing |
|---|---|---|---|
| Storable (incl. SiteLink) | Self-storage management software, payments, websites | No: runs your facility, does not benchmark your rates | Software tiers from ~$100/mo; payments take-rate |
| StorEDGE | Facility management and online rentals | No: operational platform | From ~$150/mo |
| 6Storage | Modern self-storage management software | No: operations, not analytics | From ~$59/mo |
| Tenant Inc. | Self-storage operating platform | No: manages units, does not price the market | Contact sales |
| Toy Storage Nation | Industry media, education, workshops | No: education and deal flow, not operator analytics | Event-based |
| Yardi Matrix | CRE research and supply tracking | Partial: tracks development pipeline, not operator rate benchmarks | Enterprise research subscriptions |
| This startup | Rate benchmarking + yield management for vehicle storage | Core product: anonymized market-rate analytics | $249-549/mo |
The gap is the same one that existed in every comparable industry before its analytics layer was built. Storable and its peers are operations platforms: they process payments, manage gate codes, and run the website. They answer "how do I run my lot" not "what should I charge." Toy Storage Nation built the industry's media and education layer and Yardi Matrix tracks the development pipeline, but neither sells an operator the one number that matters: what a 35-foot covered space actually rents for within a 20-minute drive, adjusted for occupancy. That dataset does not exist, and the company that assembles it owns the industry's pricing infrastructure.
Why Now
Five forces are converging. The industry is professionalizing at startup speed: the dedicated facility count doubled in two years, 218 projects are under construction or planned, and the buyer pool has shifted from local landlords to operators running published case studies with IRR targets. Professionalizing industries buy analytics; informal ones do not. The window between "industry exists" and "industry has a data standard" is when the standard gets set.
Institutional capital is validating the asset class at prices that only make sense with rate optimization. The December 2025 deal at $12,900 per space with a 24.7% levered IRR target works because the buyer underwrites a rate push on day one. Every acquisition thesis in this sector has the same first line item, and every buyer needs benchmarking data to size it. The acquirers are the enterprise tier.
Demand keeps strengthening. RVIA projects up to 366,100 RV shipments in 2026, 16.9 million households intend to buy an RV within five years, and new housing developments keep adding HOA-governed rooftops whose owners cannot park an RV at home. Toy Storage Nation's Troy Bix calls vehicle storage "where self-storage was 25 to 30 years ago," and self-storage grew from a fragmented curiosity into a $50 billion-plus industry on the back of exactly this dynamic: constrained supply, durable demand, and eventually, data.
The cold-start data problem is solvable now in a way it was not five years ago. Sub-$200 cameras with on-device space counting can report occupancy without the operator typing anything. The industry's data gap was always about collection rather than analysis, and cheap vision hardware closes it.
The REITs are coming. Extra Space Storage already offers RV, boat, and camper storage at select locations, with dedicated vehicle-storage landing pages for markets like El Segundo (averaging $246/month), Charlotte, San Diego, and Tampa. Public Storage and CubeSmart are expanding the same way. When the REITs bring their revenue-management infrastructure to vehicle storage, independent operators either get the same analytical capability from a vendor or get outpriced. The consolidators did this to independent hotels, apartment operators, and self-storage owners. The playbook is public.
Original Contribution: The 4.5x Gap, Derived From Idle Days
A calculation nobody has published: The industry's standard claim, from Toy Storage Nation's research, is that five times the current supply of RV and boat storage is needed to meet demand. That number is usually cited, not derived. Here is a bottom-up derivation from usage data, offered as a consistency check rather than a second independent study, that lands in the same place.
Start with the fleet: 8.1 million RV-owning households (RVIA 2025, revised methodology) and roughly 11 million registered boats (NMMA). Apply the observed usage figures: RVs used about 20 days a year sit idle 345 days; boats used about 54 days (Toy Storage Nation) sit idle 311 days. Total idle inventory: (8.1M x 345) + (11M x 311) = 6.22 billion vehicle-days per year, equivalent to 17.0 million vehicles stored year-round. Apply a conservative commercial-storage penetration of 30% for RVs and 20% for boats, consistent with HOA coverage in suburban markets: 2.43 million plus 2.2 million, or 4.63 million rented spaces of implied demand.
On the supply side: fewer than 2,000 dedicated facilities (Yardi Matrix, via Toy Storage Nation's reporting) at roughly 350 spaces each gives about 630,000 spaces. Add a generous 5,000 self-storage facilities each contributing 80 vehicle spaces (400,000), for total professional supply near 1.03 million spaces. Implied demand of 4.63 million against supply of roughly 1.03 million yields a 4.5x gap. The idle-days arithmetic and the trade estimate point the same direction: the country needs roughly five times its current vehicle-storage supply. But the arithmetic is a consistency check on shared inputs, not a second independent measurement, so weight it accordingly.
Read the gap honestly, though. Part of the implied boat demand is already served at marinas and is not latent shortage; the gap is better understood as formal-versus-informal market share than as pure unmet demand. Much of the "missing" 3.6 million spaces is currently absorbed by farmers' fields, unlisted lots, and home driveways in markets without HOA enforcement. The opportunity is an informal market waiting to be formalized, which is exactly what happened to self-storage.
Limitations
Three weaknesses should be stated plainly. Start with the penetration assumptions behind the 4.5x gap: the 30% and 20% commercial-storage figures are estimates, not surveyed numbers. Rural RV owners overwhelmingly store at home on acreage; urban boat owners often use marinas rather than storage lots. If true commercial penetration is 20% of RVs and 12% of boats, implied demand falls to about 2.9 million spaces and the gap shrinks to roughly 3x. Still a shortage, but a less dramatic one, and the sensitivity is wide.
Next, the supply estimate. The 350-space average per dedicated facility is anchored on a single deal-marketing case study, which is the thinnest possible evidence for a market-wide parameter. Class A canopy facilities run larger; rural gravel lots run smaller. The 1.03 million total professional supply figure could be off by a factor of two in either direction, and the informal sector (farmers renting field space, unlisted lots) is by definition uncounted and may absorb more demand than the model allows.
Finally, the hardware adoption risk. The camera-based occupancy data collection assumes operators will install and maintain hardware, and the average independent lot operator runs lean on technology spending. Hardware adoption in that demographic is the graveyard of many proptech pitches. If camera uptake stalls, the product falls back to self-reported data, which is exactly the survey model that has failed to produce this dataset for a decade. And even where cameras are installed, tenant notice and image-retention policies are a genuine compliance surface, not a checkbox: gate cameras inevitably capture people and vehicles incidentally on entry and exit, which is exactly why state image-capture and retention rules vary and why the compliance mode matters. Mishandling this would poison the data network faster than any competitor could.
Strongest Counterargument
The most compelling case against this startup is that vehicle storage may be too local, too seasonal, and too relationship-driven for centralized rate intelligence to matter. Consider the actual customer: a retired couple in Prescott who have rented the same uncovered space for their fifth-wheel for nine years at $95 a month. The operator knows them, knows their rig, and knows they will leave over a $20 increase because their neighbor with a field charges $75. The operator's pricing reflects a relationship, not missing data: they know exactly what the local alternatives cost because there are four of them, and they know exactly what each tenant will tolerate because they have known them for a decade.
Hotel revenue management worked because demand is anonymous, transactional, and high-frequency: thousands of room-nights a month, guests you will never see again, rates that can move daily. A 200-space storage lot turns over a handful of tenants a month, each locked into annual contracts, each a neighbor. The analytical value of daily rate optimization on an asset that re-prices annually is a fraction of what it is in hotels. The benchmarking insight, that your corridor's 35-foot covered median is $180 and you charge $140, is real, but capturing it requires raising rates on people you see at the grocery store, in a business where the wait list is the retention strategy and goodwill is the moat. The marina industry's experience is instructive: the same STR-style pitch has been available to marina operators for years, and most still price by CPI plus a phone call, because the social economics of a 200-tenant community asset resist optimization. Vehicle storage lots are marinas without the water.
The second half of the counterargument is timing risk on the demand side. RV shipments peaked during the pandemic and the 2026 projection of 366,100 units, while a recovery, remains well below the 600,000-unit 2021 peak. If the RV installed base plateaus or shrinks as pandemic buyers sell, the shortage thesis weakens and the pricing power that makes yield management valuable erodes. Software that optimizes rates in a shortage is valuable; software that optimizes rates in a glut is a cost center.
The counter to the counter is that the relationship model and the data model are not enemies. The operator who knows the retiree couple personally can use a benchmark to discover they are $40 below the corridor median, and then decide deliberately whether to keep the discount as a retention investment or close the gap. The problem today is not that operators choose loyalty over revenue. It is that they cannot see the price of the loyalty they are giving away. The cyclicality half of the objection deserves the concession: if the RV installed base shrinks, rate optimization becomes a cost center rather than a profit engine. The honest bull case is that churn and retention analytics matter most in a glut, knowing which tenants to keep when spaces sit empty, but the shortage thesis would not survive a reversion to the 2021 shipment peak in reverse.
The Bottom Line
Vehicle storage is where self-storage was 25 to 30 years ago: a fragmented, mom-and-pop industry with constrained supply, durable demand, and institutional capital arriving with rate-optimization playbooks. The derived 4.5x gap and the trade claim point the same direction, but only the first shows its work. Dedicated facilities doubled in two years, 218 more are in the pipeline, and buyers are paying $12,900 per space for deals that only pencil with a day-one rate push. Most operators price without shared market data, the absence of any published within-market benchmark is the evidence, and the REITs are bringing revenue management whether the independents buy it or not. The cold-start data problem is the real risk, and the camera-based collection model is unproven at scale. But the window is open now: the standard gets set during professionalization, not after it.
What You Can Do
If you operate a vehicle storage lot with 50 or more spaces: pull your rate card by space type and length bracket for the last three years, then check the advertised rates of every competitor within a 20-minute drive. If your 35-foot covered space is more than 15% below the corridor median, you are subsidizing your tenants and do not have a mechanism to know it. The same benchmark cuts the other way: it also flags when you are overcharging and at risk of losing tenants. Data is symmetric; the examples here skew upward because the industry's bias runs that way, but a benchmark that only ever says "raise" is a sales tool, not an instrument. Track your occupancy monthly by space type; if you are above 95% with a wait list and have not raised rates in two years, the market is telling you something your rate card is not. One honest caveat before you act on any of this: capturing the spread means real rate increases on long-term tenants, many of them retirees on fixed incomes, and the goodwill cost of raising a nine-year tenant from $95 to $140 is a genuine business risk. Operators who price by relationship rather than data are not necessarily pricing wrong; they are pricing a different asset, one that includes the tenant's loyalty. If you are a self-storage software founder: your platform already holds the occupancy and rate data that would seed this product, and you are monetizing only the operational layer. The analytical layer is where the defensible margin lives, and in vehicle storage, nobody has built it.
Related
📰 Dynamic Pricing SaaS for Independent Self-Storage: yield management for the parent industry that vehicle storage is 25 years behind
📰 Marina Slip Yield Management SaaS for Independent Harbor Operators: the STR benchmarking model applied to boats that float instead of boats on trailers
📰 GA Hangar Rate Intelligence: another "constrained supply, no price discovery" asset class with identical data-gap dynamics