System and Method for Early Wildfire Detection and Ember Transport Corridor Prediction Using Distributed Consumer Weather Station Microclimate Anomaly Fusion and Physics-Informed Neural Networks
Abstract
Disclosed is a system and method for detecting wildfire ignition events and predicting ember transport corridors in near-real-time by fusing data streams from the existing distributed network of consumer-grade weather stations. The system ingests barometric pressure readings at 1-minute resolution from stations within a configurable radius (default: 50 km) and applies wavelet decomposition to isolate pressure perturbations in the 0.001–0.1 Hz band characteristic of fire-induced convective circulations. Concurrent anomalies in wind vector fields (sudden directional convergence toward a point source), temperature (localized spikes exceeding the diurnal prediction envelope by ≥2°C), humidity (rapid drops below the fire weather threshold of 15% RH), and particulate matter concentration (PM2.5 readings from co-located low-cost sensors exceeding 35 µg/m³ with no regional baseline shift) are fused via a spatiotemporal graph neural network (GNN) that models station-to-station relationships as edges weighted by distance, elevation difference, and terrain roughness. A physics-informed neural network (PINN) layer embeds the Rothermel fire spread equations and Albini ember lofting model as soft constraints, enabling the system to predict fire perimeter evolution and ember transport corridors at 30-meter spatial resolution with 5-minute temporal updates. The system operates on commodity cloud infrastructure, requires no dedicated fire-detection hardware, and issues geofenced alerts to residents in predicted ember landing zones 15–45 minutes before ember arrival.
Field of the Invention
This invention relates to wildfire detection and prediction, specifically to the use of crowdsourced consumer weather station networks combined with physics-informed machine learning for early fire detection, spread modeling, and ember transport corridor forecasting without dedicated fire-sensing infrastructure.
Background
Wildfire suppression costs in the United States exceeded $4.3 billion in federal spending alone in 2024 (NIFC), with insured losses from the 2025 Los Angeles fires estimated at $30–40 billion (NAIC). The 2018 Camp Fire in Paradise, California killed 85 people and destroyed 18,804 structures. In every post-incident analysis, a consistent finding emerges: detection latency kills. The Camp Fire was reported to Cal Fire at 6:33 AM; by 6:45 AM, ember-driven spot fires had already jumped the Feather River, 1.5 miles from the ignition point. Twelve minutes of detection delay translated to a 1.5-mile head start for the fire.
Current wildfire detection systems include:
- Satellite remote sensing: GOES-16/17 provides fire detection via the 3.9 µm shortwave IR band at 5-minute intervals with 2 km spatial resolution. Schroeder et al. (2014) demonstrated GOES detection latency of 4–33 minutes after ignition, depending on fire radiative power and cloud cover. VIIRS (Suomi NPP, NOAA-20) achieves 375 m resolution but revisits only every 12 hours. Neither satellite system can detect small fires (<0.1 ha) or fires obscured by canopy, terrain, or smoke.
- Camera networks: ALERTCalifornia operates over 1,100 pan-tilt-zoom cameras across California with AI-assisted smoke detection (Pano AI, Fireball International). Detection latency: 5–15 minutes for visible smoke. Limitations: nighttime performance degrades significantly, fog and low clouds cause false positives, and camera networks require ongoing maintenance at $5,000–$15,000 per installation per year.
- Dedicated sensor networks: Dryad Networks deploys solar-powered IoT gas sensors (CO, H₂, VOCs) on trees. N5 Sensors produces MEMS-based gas detector arrays. Both approaches require dense physical deployments in fire-prone areas at $50–$200 per node, with ongoing maintenance. Coverage is inherently limited to instrumented zones.
- RAWS (Remote Automated Weather Stations): The RAWS network operates approximately 2,200 stations across the western US, measuring wind, temperature, humidity, and fuel moisture. Stations report at 1-hour intervals (too coarse for detection) and are spaced 15–50 km apart (too sparse for localization).
Meanwhile, a parallel sensing infrastructure has emerged organically: consumer weather stations. WeatherFlow-Tempest alone reports over 100,000 active stations globally, each sampling wind speed, wind direction, temperature, humidity, barometric pressure, UV, solar irradiance, and precipitation at 1-minute intervals. PurpleAir has deployed over 70,000 PM2.5 sensors. Davis Instruments (Vantage Pro2/Vue), Ambient Weather, and Ecowitt add tens of thousands more. In California's wildland-urban interface (WUI), consumer station density typically exceeds 5 stations per km² in suburban areas adjacent to fire-prone wildlands.
The scientific basis for detecting fires via pressure perturbation is well-established. Heilman et al. (2023) documented pressure perturbations of 0.5–3.0 hPa at distances of 100–500 m from prescribed burns, with characteristic frequencies in the 0.005–0.05 Hz band driven by fire-atmosphere coupling. Clements et al. (2019) measured pressure deficits of 1–5 hPa within fire convection columns during the 2017 Lick Fire. Modern MEMS barometers (Bosch BMP390, resolution 0.003 hPa, noise 0.01 hPa at 1 Hz) in consumer weather stations are sensitive enough to detect these perturbations at distances of 1–10 km, depending on fire size and atmospheric stability.
The gap in the art is a system that: (a) leverages the existing consumer weather station network as a wildfire detection and prediction layer without requiring any new hardware deployments, (b) fuses multi-modal microclimate anomalies (pressure, wind, temperature, humidity, particulates) across stations using graph-based machine learning to detect and localize ignition events, (c) predicts ember transport corridors by embedding fire physics models within the neural network architecture, and (d) issues geofenced alerts to residents in predicted ember landing zones before embers arrive.
Detailed Description
1. Data Ingestion and Normalization
The system continuously ingests telemetry from consumer weather station APIs and data-sharing networks:
- WeatherFlow Tempest: REST API (
swd.weatherflow.com/swd/rest/) and WebSocket (wss://ws.weatherflow.com/) provide per-device observations at 1-minute intervals. Fields: barometric pressure (±0.06 hPa accuracy), wind speed/direction (ultrasonic, 3-second gust), temperature (±0.3°C), humidity (±1.8% RH), UV index, solar irradiance, lightning strike distance/count. - PurpleAir: REST API (
api.purpleair.com/v1/sensors) provides PM2.5 concentration at 2-minute intervals from dual Plantower PMS5003 laser scattering sensors. The system applies the EPA correction factor (Barkjohn et al., 2022) for wildfire smoke conditions. - Weather Underground / PWS Weather / CWOP: Citizen Weather Observer Program (CWOP) and Weather Underground aggregate data from Davis, Ambient Weather, and Ecowitt stations via APRS and HTTP upload. Temporal resolution varies (1–10 minutes).
- Public weather APIs: NWS NDFD grids (2.5 km resolution, hourly) and HRRR model output (3 km, hourly) provide regional baseline forecasts for anomaly detection.
Each station's readings undergo quality control: range checks (e.g., sea-level pressure 870–1084 hPa), temporal consistency checks (rejecting readings where pressure changes >5 hPa in 1 minute without a corresponding regional shift), and spatial consistency checks (flagging stations whose readings diverge >3σ from their 5 nearest neighbors during non-event periods). Stations with >10% rejected readings in a rolling 24-hour window are temporarily excluded.
Barometric pressure readings are reduced to sea level using station elevation and the hypsometric equation, then detrended by subtracting a 2-hour rolling mean to isolate perturbation signals from synoptic-scale pressure changes (weather fronts, diurnal tides).
2. Fire-Induced Pressure Perturbation Detection
The physical mechanism: a wildfire creates a convection column that draws surface air inward and upward. This generates a measurable pressure deficit at the surface near the fire. The magnitude follows an approximate inverse-square relationship with distance, modulated by fire intensity (kW/m fireline intensity) and atmospheric stability (Brunt-Väisälä frequency).
The system applies continuous wavelet transform (CWT) using a Morlet wavelet to each station's detrended pressure time series, extracting power spectral density in three frequency bands: (i) 0.001–0.005 Hz (period 200–1000 s): large convective circulations associated with established fires >10 ha, (ii) 0.005–0.02 Hz (period 50–200 s): medium-scale fire-atmosphere coupling, and (iii) 0.02–0.1 Hz (period 10–50 s): turbulent fluctuations from active flame fronts.
An anomaly score is computed per station per minute as the ratio of current wavelet power to the 7-day baseline power in each band, weighted by atmospheric stability (more weight in unstable conditions where convective signals propagate further). When the anomaly score exceeds a configurable threshold (default: 4.0σ) at two or more stations within a 20 km radius simultaneously, the system flags a candidate fire detection event.
3. Multi-Modal Anomaly Fusion via Spatiotemporal GNN
Pressure perturbation alone cannot reliably distinguish fire from other mesoscale phenomena (thunderstorm outflow, dust devils, microbursts). The system fuses five data channels per station into a unified detection framework:
- Pressure perturbation score (from Section 2)
- Wind convergence metric: For each station, the system computes the angular deviation between the station's wind direction and the bearing to each candidate ignition point. Fire-driven inflow produces systematic wind convergence toward the fire. A convergence index is computed as the mean cosine similarity between observed wind vectors and the predicted inflow vectors across all stations within 15 km.
- Temperature anomaly: The difference between observed temperature and the station's diurnal prediction model (trained on the preceding 30 days of data, accounting for time-of-day, cloud cover, and wind speed). Nearby fires produce temperature spikes of 2–10°C at downwind stations within 5 km.
- Humidity drop rate: The time derivative of relative humidity. Fire-driven air entrainment replaces moist surface air with dry upper-level air, producing RH drops of 5–15% over 10–30 minutes at stations within the fire's inflow region.
- PM2.5 anomaly: Where PurpleAir or equivalent sensors are co-located, the PM2.5 concentration normalized against the regional baseline (median of all sensors within 50 km). Smoke from a new ignition produces localized PM2.5 spikes (>35 µg/m³ above baseline) at downwind stations within 15–60 minutes depending on wind speed and distance.
These features are fed into a spatiotemporal graph neural network (ST-GNN) where nodes represent weather stations and edges connect stations within 25 km of each other. Edge weights encode inverse distance, elevation difference (fires in valleys may not produce detectable signals at ridgetop stations), and terrain roughness (from 30 m SRTM digital elevation data, which affects wind channeling). The GNN uses a GAT (graph attention network) architecture with 3 message-passing layers, allowing each station to attend to its neighbors' features weighted by learned relevance. Temporal dynamics are captured via a GRU (gated recurrent unit) layer operating on 30-minute sliding windows of node features.
The GNN outputs two predictions per time step: (i) a binary fire detection probability per grid cell (500 m resolution), and (ii) an estimated ignition location (latitude, longitude) with uncertainty ellipse. Training data consists of historical fire incidents (CAL FIRE incident archive, NIFC SIT-209 reports) matched with archived weather station data from the same spatial-temporal window. Negative examples are drawn from high-wind, high-heat, low-humidity events where no fire occurred.
4. Ember Transport Corridor Prediction via Physics-Informed Neural Network
Once a fire is detected and localized, the system shifts to predicting where embers will land. Ember transport (spotting) is the primary mechanism by which wildfires breach containment lines and enter residential areas. During the 2018 Camp Fire, embers traveled up to 1.5 miles ahead of the flame front. During the 2025 Palisades Fire, ember-driven spot fires ignited structures in Pacific Palisades while the main fire was still in Topanga State Park.
The ember transport prediction module uses a physics-informed neural network (PINN) that embeds two foundational fire models as differentiable loss terms:
- Rothermel fire spread model (Rothermel, 1972): predicts rate of spread as a function of wind speed, slope, fuel moisture, and fuel bed properties. The PINN encodes Rothermel's equations (no-wind rate of spread, wind factor φ_w, slope factor φ_s) as physics constraints in the loss function, forcing the neural network to produce fire perimeter predictions that are consistent with fire physics while allowing learned corrections for effects not captured by Rothermel (e.g., terrain-channeled winds, fine-scale fuel heterogeneity).
- Albini ember lofting model (Albini, 1983): predicts maximum lofting height and downwind transport distance for firebrands as a function of firebrand mass, shape (drag coefficient), updraft velocity, and horizontal wind profile. The model parameterizes firebrands into three classes: light (bark flakes, <1 g, transport 200–500 m), medium (twig sections, 1–10 g, transport 500–1500 m), and heavy (bark chunks, 10–100 g, transport 100–500 m but with higher ignition probability on landing).
The PINN takes as inputs: (i) the detected fire location and estimated perimeter (from the GNN), (ii) wind vector fields interpolated from surrounding weather stations at 100 m resolution using Kriging with a spherical variogram, (iii) terrain data (30 m SRTM DEM: elevation, slope, aspect), (iv) fuel type and condition maps (LANDFIRE 30 m fuel model grids, updated annually), and (v) atmospheric stability estimate (Brunt-Väisälä frequency derived from temperature lapse rate between stations at different elevations).
Outputs are: (i) predicted fire perimeter at t+5, t+15, t+30, and t+60 minutes, rendered as probability contours (50%, 75%, 95%) on a 30 m grid, and (ii) ember landing probability maps at the same time steps, showing the spatial distribution of expected ember density (embers/m²/hour) by firebrand class. Areas where the predicted ember density exceeds a configurable ignition threshold (default: 0.1 embers/m²/hour for heavy class, 1.0 for medium, 10.0 for light) are flagged as ember landing zones.
5. Geofenced Alert System
When the system predicts ember landing in populated areas, it generates geofenced alerts through multiple channels:
- Push notifications: Integration with smartphone weather apps (WeatherFlow, Weather Underground, PurpleAir) to deliver location-targeted alerts to users whose registered station or phone GPS falls within the predicted ember corridor. Alert text includes estimated time to ember arrival, recommended actions (close windows, clear combustibles from rooflines and decks, prepare for possible evacuation), and a link to the live prediction map.
- CAP (Common Alerting Protocol) feeds: Machine-readable alerts in OASIS CAP 1.2 format for integration with IPAWS (Integrated Public Alert and Warning System), enabling distribution via Wireless Emergency Alerts (WEA), Emergency Alert System (EAS), and NOAA Weather Radio.
- API endpoints: RESTful API serving prediction GeoJSON for consumption by fire agency dispatch systems, utility companies (pre-emptive de-energization decisions), and emergency management platforms (evacuation route planning).
Alert urgency levels follow a three-tier structure: (i) Watch (fire detected within 20 km, current wind direction could bring embers within 2 hours), (ii) Warning (ember corridor predicted to reach the area within 60 minutes), and (iii) Immediate (embers predicted within 15 minutes or already landing in adjacent areas).
6. Continuous Model Calibration
The system continuously calibrates against ground truth by matching its predictions to confirmed fire incidents reported via 911 dispatch (CAD data), satellite confirmations (GOES, VIIRS active fire detections), and camera network confirmations (ALERTCalifornia). False positive events are labeled and fed back into the training pipeline. The GNN's attention weights are logged and analyzed to identify which station features and spatial relationships are most predictive, enabling iterative improvement of the detection algorithm.
Seasonal calibration accounts for the strong dependence of fire behavior on fuel moisture content, which varies from >200% in spring green-up to <5% in late-season dead fuels. The system ingests NFDRS dead fuel moisture indices and adjusts detection thresholds accordingly, reducing sensitivity during wet periods (fewer false positives) and increasing sensitivity during critical fire weather (Red Flag Warnings).
7. Figures Description
- Figure 1: System architecture showing data ingestion from consumer weather station APIs, quality control pipeline, wavelet-based pressure perturbation detection, multi-modal feature extraction, spatiotemporal GNN fire detection, PINN ember corridor prediction, and geofenced alert delivery.
- Figure 2: Wavelet scalogram of barometric pressure perturbation recorded at a WeatherFlow Tempest station 3.2 km from a prescribed burn, showing characteristic power increase in the 0.005–0.02 Hz band beginning 8 minutes after ignition.
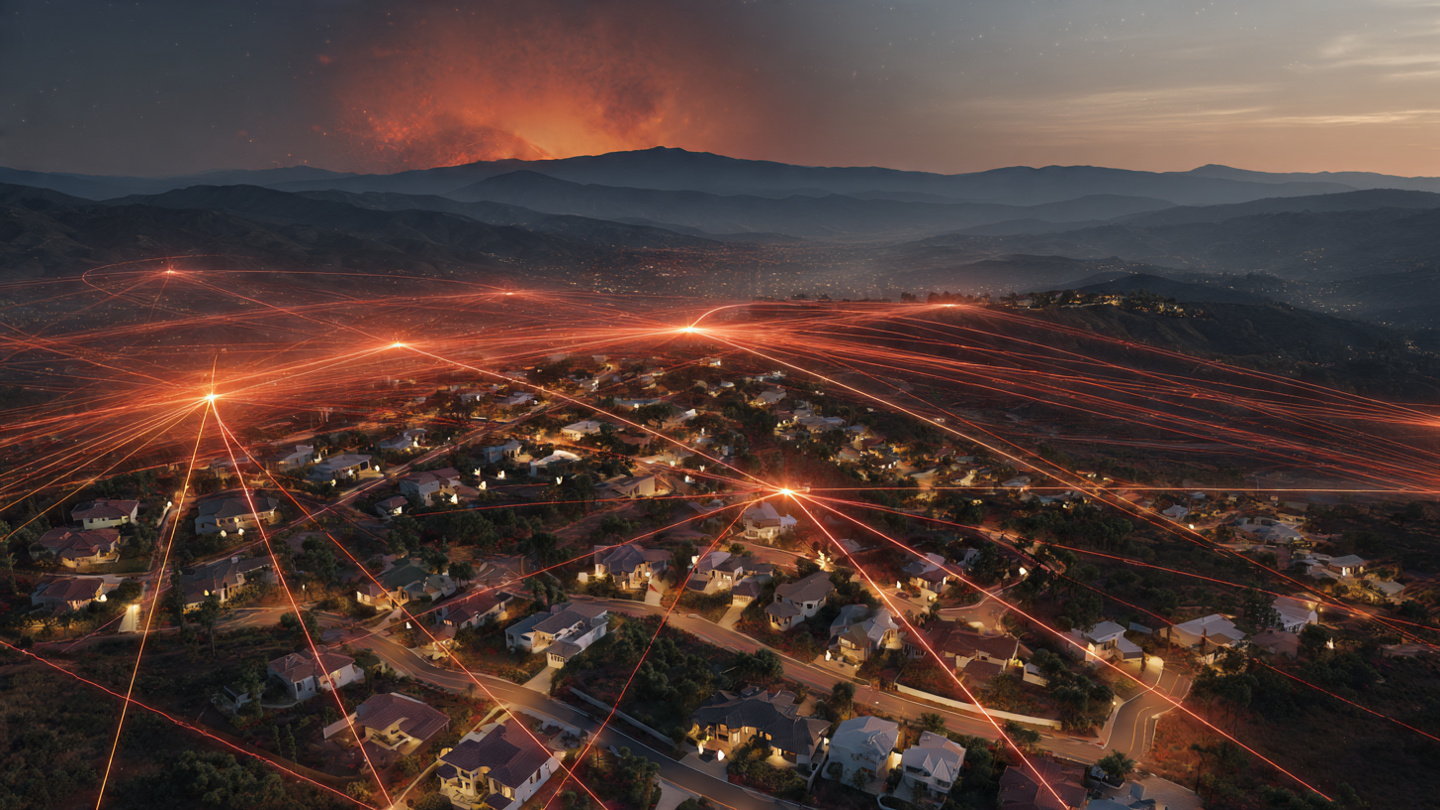
- Figure 3: Wind convergence vector field during a simulated wildfire event, showing consumer weather station wind vectors (blue arrows) rotating to converge on the estimated ignition point (red marker).
- Figure 4: Predicted ember landing probability map overlaid on a terrain hillshade of the 2018 Camp Fire area, showing predicted heavy-class ember corridors (red), medium-class (orange), and light-class (yellow) transport zones at t+30 minutes after detection.
- Figure 5: Spatiotemporal GNN graph structure showing weather station nodes (circles), edges weighted by distance and terrain (line thickness), and attention weights (color intensity) during a fire detection event.
Claims
- A system for detecting wildfire ignition events using data from distributed consumer-grade weather stations, comprising: a data ingestion module that receives barometric pressure, wind speed, wind direction, temperature, and humidity readings from a plurality of consumer weather stations at sub-5-minute intervals; a pressure perturbation detection module that applies wavelet decomposition to detrended barometric pressure time series to identify fire-induced convective signatures in the 0.001–0.1 Hz frequency band; and a multi-modal fusion module that combines pressure perturbation scores with wind convergence metrics, temperature anomalies, humidity drop rates, and particulate matter concentrations to produce a fire detection probability for geographic grid cells.
- The system of claim 1, wherein the multi-modal fusion module comprises a spatiotemporal graph neural network in which nodes represent individual weather stations and edges encode spatial relationships weighted by inter-station distance, elevation difference, and terrain roughness derived from digital elevation model data.
- The system of claim 1, further comprising an ember transport corridor prediction module that uses a physics-informed neural network embedding Rothermel fire spread equations and Albini ember lofting models as differentiable loss constraints, producing spatial probability maps of ember landing density at configurable time horizons.
- The system of claim 3, wherein the ember transport prediction module ingests interpolated wind vector fields from surrounding weather stations, 30-meter digital elevation model data, fuel type and condition maps, and atmospheric stability estimates derived from temperature readings at stations at different elevations.
- The system of claim 1, further comprising a geofenced alert module that issues location-targeted notifications to users within predicted ember landing zones, including estimated time to ember arrival, via integration with consumer weather station applications and the Common Alerting Protocol (CAP) for distribution through governmental alert systems.
- A method for predicting wildfire ember transport corridors comprising: detecting a wildfire ignition event by fusing multi-modal anomaly signals from a distributed network of consumer weather stations; estimating fire location and initial perimeter from spatial patterns of pressure perturbation, wind convergence, and temperature anomaly across the station network; computing wind vector fields at 100-meter resolution by spatial interpolation of consumer station wind observations; and applying a physics-informed neural network that embeds fire spread and ember lofting physics models to produce ember landing probability maps at 30-meter spatial resolution with 5-minute update intervals.
- The method of claim 6, wherein detecting a wildfire ignition event comprises applying continuous wavelet transform to barometric pressure time series from each station to extract power spectral density in frequency bands characteristic of fire-induced convective circulations, and flagging candidate events when wavelet power anomaly scores exceed a threshold at two or more stations within a configurable radius simultaneously.
- The method of claim 6, further comprising continuously calibrating detection thresholds based on seasonal fuel moisture conditions by ingesting National Fire Danger Rating System indices, reducing detection sensitivity during high-moisture periods and increasing sensitivity during critical fire weather conditions.
- The system of claim 1, wherein quality control of station data comprises range checks, temporal consistency checks rejecting readings where pressure changes exceed a threshold without a corresponding regional shift, and spatial consistency checks flagging stations whose readings diverge beyond a configurable number of standard deviations from their nearest neighbors during non-event periods.
- The system of claim 2, wherein the spatiotemporal graph neural network uses a graph attention network architecture with temporal dynamics captured by gated recurrent units operating on sliding windows of node features, trained on historical fire incidents matched with archived consumer weather station data and negative examples drawn from high-fire-risk weather conditions where no fire occurred.
Implementation Notes
A proof-of-concept implementation can be constructed using publicly available APIs (WeatherFlow REST API, PurpleAir API v1, Weather Underground PWS API) and open-source components (PyTorch Geometric for GNN, NVIDIA Modulus or DeepXDE for PINN, GDAL for terrain processing, LANDFIRE data downloads). The compute requirements for real-time inference across a 50 km radius with 200 stations are modest: a single GPU instance (e.g., AWS g5.xlarge, $1.01/hour) can process the full pipeline (ingestion, QC, wavelet analysis, GNN inference, PINN prediction) in under 10 seconds per update cycle, well within the 60-second data arrival interval.
The primary engineering challenges are: (i) obtaining sufficient labeled training data (historical fires with matched station telemetry), addressable via the CAL FIRE incident archive (100,000+ incidents with GPS coordinates and timestamps since 2013) cross-referenced with archived WeatherFlow and PurpleAir data; (ii) handling heterogeneous station quality (consumer sensors are less calibrated than RAWS), addressable via the spatial consistency QC module and learned station reliability weights in the GNN; and (iii) managing false positives from non-fire mesoscale events (dust devils, thunderstorm outflows, prescribed burns), addressable via multi-modal fusion and integration with prescribed burn permit databases (CAL FIRE burn permits are public record).
Prior Art References
- NIFC Suppression Cost Statistics — Federal wildfire suppression spending data
- NAIC Wildfire Insurance Data — Insured loss estimates for major wildfire events
- Schroeder et al. (2014) — GOES satellite fire detection latency and performance
- ALERTCalifornia — Camera network for wildfire detection
- Dryad Networks — IoT gas sensor network for forest fire detection
- RAWS Climate Archive — Remote Automated Weather Station network
- Heilman et al. (2023) — Fire-induced barometric pressure perturbation measurements
- Clements et al. (2019) — Pressure deficits in fire convection columns
- Barkjohn et al. (2022) — EPA correction factor for PurpleAir PM2.5 during wildfire smoke
- Rothermel (1972) — Mathematical model for predicting fire spread
- Albini (1983) — Firebrand lofting and transport model
- LANDFIRE — Landscape Fire and Resource Management Planning Tools (fuel maps)
- WFAS NFDRS — National Fire Danger Rating System dead fuel moisture indices
- WeatherFlow-Tempest — Consumer weather station network (100,000+ stations)
- PurpleAir — Consumer PM2.5 sensor network (70,000+ sensors)
- Bosch BMP390 — MEMS barometric pressure sensor (0.003 hPa resolution)