System and Method for Detecting and Localizing Concealed Moisture Intrusion in Building Envelopes Using WiFi Channel State Information from Existing Indoor Wireless Access Point Infrastructure with Temporal Deep Learning and Dielectric Anomaly Mapping
Abstract
Disclosed is a system and method for detecting and localizing concealed moisture intrusion events within building wall, floor, and ceiling assemblies by analyzing WiFi channel state information (CSI) captured from existing indoor wireless access point infrastructure. Modern WiFi 5/6/6E/7 access points operating under IEEE 802.11ac/ax/be standards transmit orthogonal frequency-division multiplexing (OFDM) signals across 52 to 2,048 subcarriers per spatial stream, each carrying independently measurable amplitude and phase information. When electromagnetic waves at 2.4 GHz, 5 GHz, or 6 GHz propagate through building assemblies, their attenuation and phase shift are governed by the complex permittivity of the materials in the propagation path. Water has a relative permittivity of approximately 78 at 2.4 GHz, compared to 2.0–2.5 for dry gypsum drywall, 4–8 for dry concrete, and 1.5–2.0 for dry wood framing. When moisture infiltrates a wall cavity through roof leaks, plumbing failures, condensation, or rising damp, the effective permittivity of the affected building assembly section increases by 5× to 30×, producing measurable changes in the CSI amplitude and phase across the subcarrier spectrum. The system continuously monitors CSI data from all access-point-to-client and access-point-to-access-point links in a mesh WiFi deployment, applies a temporal convolutional network (TCN) trained on paired CSI measurements and ground-truth moisture sensor data to detect anomalous dielectric changes consistent with moisture intrusion, and uses multi-path triangulation across overlapping AP coverage zones to localize the moisture event to a specific wall section, floor bay, or ceiling cavity. By operating on data already collected by commercial mesh WiFi systems at zero incremental hardware cost, the system provides continuous whole-building moisture monitoring that would otherwise require hundreds of dedicated point sensors at $30–150 each, enabling early detection of concealed leaks days to weeks before visible damage such as paint blistering, mold growth, or structural degradation appears.
Field of the Invention
This invention relates to building envelope integrity monitoring, specifically to the detection, classification, and spatial localization of concealed moisture intrusion events within wall, floor, and ceiling assemblies using WiFi channel state information captured from existing commercial wireless access point infrastructure and processed by temporal deep learning models.
Background
Water damage is the most common and costly form of property loss in residential and commercial buildings. The Insurance Information Institute reports that water damage and freezing claims account for approximately 29% of all homeowners insurance claims in the United States, with an average claim cost of $12,514 as of 2023. The total annual insured cost of water damage exceeds $13 billion. EPA estimates indicate that undetected moisture intrusion contributes to mold growth in 47% of US buildings, with remediation costs ranging from $500 for minor surface mold to $30,000+ for extensive structural mold within wall cavities. The fundamental problem is detection latency: by the time moisture damage becomes visible (paint blistering, staining, warping, or mold odor), the underlying water intrusion has typically been active for days to months, during which time it has saturated insulation, degraded structural members, corroded fasteners, and established mold colonies within enclosed cavities that are invisible to occupants.
Current approaches to moisture detection in building envelopes have significant limitations:
- Point moisture sensors: Companies like Fibaro, Govee, and Honeywell sell leak detection sensors that use conductivity probes to detect standing water on floor surfaces. These cost $15–50 each and detect water only after it has pooled on a surface they physically contact. They cannot detect moisture within wall cavities, ceiling spaces, or floor assemblies. A typical home would need 20–50 sensors for comprehensive floor-level coverage, and even full deployment misses all concealed cavity moisture.
- Embedded humidity sensors: Research-grade systems from Sensirion and Vaisala embed capacitive humidity sensors within wall assemblies during construction or retrofit. These provide direct measurement of relative humidity at the sensor location but cost $50–200 per sensor plus wired or wireless backhaul, require penetration of vapor barriers during installation (potentially creating new moisture pathways), and provide coverage only at discrete points. A 2,000 sq ft home with 200 linear feet of exterior wall would need 40–100 sensors for meaningful coverage at a total installed cost of $5,000–20,000.
- Thermal imaging inspection: Infrared cameras (FLIR, Fluke) can identify moisture-laden areas through evaporative cooling signatures on wall surfaces. However, this requires a trained operator, works only when temperature differentials exist (typically during heating or cooling seasons), cannot penetrate deep into wall cavities, and provides snapshot-in-time data rather than continuous monitoring. Professional moisture inspections cost $300–800 per visit.
- Electrical impedance tomography (EIT): Academic research by Karhunen et al., Construction and Building Materials 2019 has demonstrated moisture mapping in concrete using electrode arrays and EIT reconstruction. This approach requires dedicated electrode installations on the structure surface and is limited to single-material monolithic elements (concrete walls, slabs), not the composite wood-frame, insulation, and drywall assemblies found in 90% of US residential construction.
- Acoustic leak detection: Correlating acoustic sensors detect the sound of pressurized water escaping from supply pipes, effective for active plumbing leaks but unable to detect slow seepage, condensation, or envelope infiltration where no pressurized water source exists.
Meanwhile, WiFi mesh networks have become ubiquitous in residential and commercial buildings. IDC estimated that 68 million mesh WiFi systems were shipped globally in 2025, with the average US home deploying 2.4 access points. Enterprise buildings deploy far more: a typical 50,000 sq ft office building contains 15–30 access points. These devices continuously transmit OFDM signals and report channel quality metrics as part of normal network operations. IEEE 802.11n (WiFi 4) provides 56 subcarriers per 20 MHz channel, 802.11ac (WiFi 5) provides 234 subcarriers per 80 MHz channel, and 802.11ax (WiFi 6) provides up to 2,048 subcarriers per 160 MHz channel. Each subcarrier carries an independently measurable complex value (amplitude and phase) that encodes the multipath propagation characteristics of the channel between transmitter and receiver. This per-subcarrier complex channel response is the channel state information (CSI).
The WiFi CSI sensing research community has demonstrated that CSI data captures remarkably fine-grained information about the physical environment between transmitter and receiver. Wang et al., ACM MobiCom 2015 showed that WiFi CSI can detect sub-centimeter body movements for gesture recognition. Liu et al., ACM MobiSys 2016 demonstrated respiration rate monitoring at 97% accuracy from CSI perturbations caused by chest wall movement. Ma et al., IEEE IoT Journal 2021 achieved whole-home human activity recognition using CSI from a single WiFi link. These results establish that WiFi CSI is sensitive to physical changes in the propagation environment at scales far below a wavelength (12.5 cm at 2.4 GHz). However, all prior WiFi CSI sensing work has focused on detecting human presence, activity, gesture, vital signs, or material objects. No system has been disclosed that uses WiFi CSI to detect moisture intrusion within building assemblies by exploiting the dramatic dielectric contrast between dry and wet building materials.
The physical basis for moisture detection via WiFi CSI is compelling. The complex relative permittivity of water at 2.4 GHz is approximately 78 − j12 (Ulaby and Long, Microwave Radar and Radiometric Remote Sensing, University of Michigan Press, 2014). Dry gypsum drywall has a permittivity of approximately 2.0–2.5, dry softwood framing is 1.5–2.0, fiberglass insulation is 1.0–1.1 (nearly air), and dry concrete block is 4–8. When a wall cavity accumulates even 1 liter of water (spread as a thin film or absorbed into insulation), the effective permittivity of the affected section increases dramatically. Using a volume-weighted mixing model (Peplinski et al., IEEE Transactions on Geoscience and Remote Sensing, 1995), a 12 cm deep wall cavity with 10% volumetric water content has an effective permittivity of approximately 8–12, compared to 1.5–2.5 when dry. This 4–8× increase in permittivity produces measurable effects on WiFi signal propagation: increased path loss (0.5–3 dB per wall transit through the affected section), phase shift (5–30° per transit depending on frequency and moisture volume), and frequency-selective fading (different subcarriers experience different attenuation depending on their wavelength relative to the moisture feature geometry). All of these effects are captured by the CSI matrix.
The gap in the art is a complete system that: (a) continuously monitors WiFi CSI from existing mesh access point deployments to detect moisture-induced dielectric changes in building assemblies, (b) applies temporal deep learning to distinguish slow moisture accumulation from other environmental changes (furniture movement, temperature swings, occupancy patterns) that also perturb CSI, (c) uses multi-link spatial analysis across overlapping AP coverage zones to localize the moisture intrusion to a specific wall section, floor bay, or ceiling cavity, and (d) generates alerts to building occupants, property managers, or insurance carriers in real time, enabling intervention before visible damage occurs. The entire system operates at zero incremental hardware cost by analyzing data already generated by commercial mesh WiFi equipment.
Detailed Description
1. CSI Data Acquisition from Existing WiFi Infrastructure
The system acquires channel state information from the normal operating data of commercial mesh WiFi access points. In a mesh WiFi deployment with N access points, there exist up to N×(N−1)/2 AP-to-AP backhaul links and N×M AP-to-client links (where M is the number of connected client devices). Each link continuously measures CSI as part of the standard beamforming, rate adaptation, and channel estimation protocols defined in IEEE 802.11ac/ax/be. The system accesses this data through one of three integration paths:
Firmware-level integration: WiFi chipset vendors (Qualcomm, Broadcom, MediaTek, Intel) maintain CSI extraction APIs within their driver firmware. Qualcomm's QCA9558 and IPQ8074 platforms expose CSI through the Atheros CSI Tool, Broadcom's BCM4375 reports CSI via the DHD driver, and Intel's AX200/AX210 expose CSI through the iwlwifi CSI tool (Gringoli et al., ACM WiNTECH 2019). The system deploys a lightweight daemon on the AP that captures CSI reports at 10–100 Hz and transmits them to a cloud or local processing server. This integration requires firmware access from the WiFi chipset or AP vendor.
Management frame passive analysis: WiFi 6 (802.11ax) Beamforming Report frames (compressed or uncompressed) contain CSI-equivalent channel matrix information that is transmitted over the air as management frames. A dedicated WiFi radio in monitor mode can passively capture these frames without modification to any existing AP or client device. Jiang et al., ACM MobiCom 2022 demonstrated extraction of full CSI from standard 802.11ax sounding frames. The system can operate from a single passive monitor device per floor that captures beamforming sounding frames from all APs in range.
Cloud API integration: Enterprise WiFi management platforms (Cisco Meraki, Aruba Central, Ubiquiti UniFi) collect channel quality metrics from managed APs and expose them through cloud APIs. While current APIs typically report RSSI and channel utilization rather than full per-subcarrier CSI, the trend toward WiFi sensing standards (Wi-Fi Alliance WiFi Sensing specification, 2024) is driving chipset vendors to expose full CSI through standardized interfaces. The system is designed to consume full CSI when available and to operate in a degraded but functional mode using per-channel RSSI and MCS rate statistics when per-subcarrier CSI is not yet exposed.
CSI data representation. For each transmitter-receiver link, the CSI at time t is a complex-valued matrix H(t) ∈ ℂ^(N_tx × N_rx × K), where N_tx is the number of transmit antennas (1–8 for WiFi 6/6E), N_rx is the number of receive antennas (1–8), and K is the number of OFDM subcarriers (56 for 20 MHz, 114 for 40 MHz, 234 for 80 MHz, 468 for 160 MHz in 802.11ax). The system extracts amplitude |H(t)| and unwrapped phase ∠H(t) for each element, producing a feature tensor of dimension 2 × N_tx × N_rx × K per link per measurement. At 10 Hz measurement rate across 3 AP-to-AP links (a typical 3-node mesh) with 2×2 MIMO and 234 subcarriers (80 MHz), the raw data rate is 10 × 3 × 2 × 2 × 2 × 234 = 56,160 floating-point values per second, well within the processing capability of a consumer-grade ARM processor or cloud VM.
2. Moisture-Induced CSI Signature Characterization
The system exploits three distinct CSI perturbation signatures caused by moisture intrusion in building assemblies:
Signature A: Broadband amplitude attenuation. Water in the propagation path increases dielectric absorption loss across all subcarriers. The excess attenuation ΔA (in dB) relative to the dry baseline follows the relationship ΔA = 8.686 × α × d, where α is the attenuation constant of the moist material (Np/m) and d is the material thickness traversed. For gypsum drywall at 2.4 GHz, α increases from approximately 0.3 Np/m (dry, ε_r = 2.2) to 2.5 Np/m at 20% gravimetric moisture content (ε_r ≈ 12, loss tangent ≈ 0.15), based on measurements by Stavrou and Saunders, IEEE Transactions on Antennas and Propagation, 2003. For a standard 12.7 mm (½″) gypsum board, this produces an excess attenuation of 0.12 dB per transit through the board. While small for a single board, a typical interior wall comprises two drywall sheets plus cavity materials: total excess attenuation of 0.5–3 dB is achievable when the cavity insulation is moisture-saturated. Modern WiFi chipsets report CSI amplitude with resolution of approximately 0.1–0.5 dB, making this signature detectable when averaged over subcarriers and temporal windows.
Signature B: Frequency-selective fading perturbation. Moisture intrusion modifies the multipath environment by changing the reflection, transmission, and scattering properties of the affected wall section. At 5 GHz (λ = 6 cm), a 10 cm × 30 cm moisture zone within a wall cavity acts as a localized dielectric anomaly that creates new reflected and diffracted paths. These additional multipath components interfere constructively and destructively at different subcarrier frequencies, producing a distinctive perturbation in the frequency-domain CSI shape. The system characterizes this perturbation using the CSI frequency correlation function: the autocorrelation of CSI amplitude across subcarriers, which captures the frequency selectivity of the channel. Moisture intrusion increases frequency selectivity (reduces the coherence bandwidth) because the dielectric contrast between wet and dry regions creates spatially compact scattering features that produce widely spaced multipath delays. This signature is particularly sensitive to partial-cavity moisture (e.g., water pooling at the bottom of a wall cavity with dry material above), where the sharp moisture boundary creates a strong dielectric discontinuity.
Signature C: Phase drift from dielectric delay. The phase velocity of electromagnetic waves in a dielectric medium is c/√ε_r, where c is the speed of light and ε_r is the relative permittivity. As moisture increases ε_r from 2 to 10 in a wall section, the propagation delay through that section increases by a factor of √(10/2) ≈ 2.24. For a 12 cm wall cavity, the dry-state propagation delay is approximately 0.57 ns, increasing to approximately 1.27 ns when saturated. This 0.7 ns delay change produces a phase shift of approximately 630° at 2.4 GHz (1 ns = 864° at 2.4 GHz). While absolute phase is difficult to measure accurately due to oscillator drift and timing offsets, the differential phase between subcarriers within the same measurement frame is stable and precise. The system monitors the phase gradient across subcarriers (group delay) and its temporal evolution. Moisture accumulation produces a monotonic increase in group delay for paths traversing the affected section, distinguishable from the rapid, random phase fluctuations caused by human movement or the slow diurnal phase drift caused by thermal expansion of building materials.
3. Temporal Deep Learning Classification Architecture
The primary challenge in moisture detection via WiFi CSI is separating the moisture signature from the numerous other environmental factors that perturb CSI: human movement, door opening/closing, furniture rearrangement, temperature-driven material expansion/contraction, HVAC airflow, device orientation changes, and AP transmit power adjustments. The system addresses this through a temporal convolutional network (TCN) architecture that exploits the distinct temporal characteristics of moisture intrusion versus other perturbation sources:
Key temporal insight: Moisture intrusion is a slow, monotonic, persistent process operating on timescales of hours to weeks. Human activity produces CSI perturbations on timescales of milliseconds to minutes. Thermal expansion operates on diurnal (24-hour) cycles. Furniture changes are step-function events. The system exploits these temporal scale separations by processing CSI data at multiple temporal resolutions simultaneously.
Architecture. The TCN operates on a multi-scale input representation constructed from the CSI time series. For each AP link, the system computes the following features over sliding windows at three temporal scales:
- Short-term (1-minute windows, 1-second stride): Mean amplitude per subcarrier, amplitude variance per subcarrier, phase gradient (group delay), and frequency correlation function. These features capture the instantaneous channel state after averaging out fast human-motion perturbations.
- Medium-term (1-hour windows, 5-minute stride): Percentile statistics (10th, 50th, 90th) of each short-term feature, capturing the channel state during quiescent periods (nights, unoccupied hours) when human-motion perturbations are absent. The 10th percentile amplitude is particularly informative because it approximates the static channel (no moving scatterers), which directly encodes the propagation properties of the fixed building structure.
- Long-term (7-day windows, 1-hour stride): Linear trend (slope) of the medium-term features, capturing the slow monotonic evolution characteristic of moisture accumulation. A linear regression of the 10th-percentile amplitude over 7 days with a statistically significant negative slope (p < 0.01 by F-test) indicates progressive attenuation increase, consistent with moisture accumulation.
The multi-scale features are stacked into a 3D tensor (temporal_resolution × feature_channel × subcarrier) and fed into a TCN with the following architecture: 4 residual blocks, each containing two dilated causal convolutions (kernel size 3, dilation factors 1, 2, 4, 8 across blocks), batch normalization, ReLU activation, and spatial dropout (rate 0.2). The dilated convolutions provide an exponentially growing receptive field without pooling, allowing the network to simultaneously capture short-term transient events and long-term trends. The TCN output feeds a binary classification head (moisture present / absent) with a sigmoid activation, plus a regression head that estimates moisture severity (volumetric water content, 0–100%) for positive detections. The regression head enables prioritization of alerts by severity.
Training data. The system is trained on a dataset constructed through three complementary approaches:
- Laboratory controlled-moisture experiments: Standard wall assemblies (2×4 wood frame, R-13 fiberglass batt insulation, ½″ gypsum drywall both sides) are constructed in a shielded test chamber with WiFi APs positioned at standardized locations. Known quantities of water (0.1 to 10 liters) are injected at controlled rates (0.01 to 1 L/hr) into the wall cavity at various locations (top plate, mid-cavity, bottom plate, within insulation). CSI is recorded continuously before, during, and after injection, alongside ground-truth gravimetric moisture measurements from embedded capacitive humidity sensors (Sensirion SHT40) at 10 locations within the cavity. The experiment matrix covers multiple wall assembly types (wood frame, steel stud, concrete block, SIP panels), insulation types (fiberglass batt, cellulose, spray foam, mineral wool), and moisture introduction methods (liquid water injection simulating plumbing leak, fog injection simulating condensation, capillary rise from wetted bottom plate).
- Synthetic data augmentation: A ray-tracing electromagnetic propagation simulator (based on Degli-Esposti et al., IEEE Transactions on Antennas and Propagation, 2007) models WiFi propagation through parameterized building geometries with spatially varying dielectric properties. The moisture zone is modeled as a 3D region within the wall assembly with elevated permittivity, and the simulator computes CSI across all subcarriers for all AP positions. By varying moisture zone location, size, shape, permittivity (corresponding to different moisture levels), building geometry, AP placement, and material properties, the simulator generates millions of synthetic CSI-moisture pairs for pre-training the TCN before fine-tuning on laboratory data.
- In-situ weakly labeled data: Deployed systems collect continuous CSI data in occupied buildings. When a moisture event is confirmed by other means (occupant report, insurance claim, professional inspection), the CSI data from the preceding weeks is retroactively labeled as positive. This weakly labeled dataset enables continuous model improvement through operational feedback. Privacy-preserving federated learning allows model updates to aggregate across buildings without raw CSI data leaving the premises.
4. Spatial Localization via Multi-Link Dielectric Tomography
In a building with N access points, each AP-to-AP and AP-to-client link traverses a different set of wall sections, providing spatial diversity for moisture localization. The system performs a simplified form of dielectric tomography by inverting the relationship between CSI perturbations observed on each link and the spatial distribution of moisture within the building.
Link-to-wall mapping. Using the known positions of APs (from mesh WiFi configuration or automatic positioning via CSI-based indoor localization) and a building floor plan (provided by the user, extracted from architectural drawings, or estimated from AP placement patterns), the system identifies which wall sections lie in the direct and first-order reflected propagation paths of each AP link. For each link l and wall section w, the system computes a sensitivity coefficient S(l,w) representing the expected CSI perturbation on link l per unit increase in permittivity of wall section w. This sensitivity matrix is pre-computed from the building geometry and AP positions.
Inversion algorithm. When the TCN detects moisture-consistent CSI perturbations on one or more links, the system solves a regularized inverse problem to estimate the spatial distribution of moisture. Let Δh_l be the measured CSI perturbation vector for link l (excess attenuation and group delay change relative to the dry baseline), and let m_w be the unknown moisture level in wall section w. The system solves: minimize ||Σ_l [S(l,·) × m − Δh_l]||² + λ||m||₁ subject to m ≥ 0. The L1 regularization (λ||m||₁) enforces sparsity, reflecting the prior that moisture intrusion is typically localized to one or a few wall sections rather than uniformly distributed. The non-negativity constraint reflects the physical reality that moisture only increases (never decreases) permittivity. The optimization is solved using the FISTA algorithm (Fast Iterative Shrinkage-Thresholding) in approximately 10 ms on a modern processor.
Localization resolution. The achievable spatial resolution depends on the number and geometric diversity of AP links traversing the building envelope. In a typical 3-AP mesh deployment in a 2,000 sq ft home with 4 rooms, the system can resolve moisture to the room level (which room contains the affected wall section). In a 5–8 AP deployment (common in larger homes and enterprise environments), the system can resolve moisture to a specific wall segment of approximately 2–5 meters length. Adding client device links (smartphones, laptops, IoT devices) improves resolution further, though client devices introduce temporal variability as they move. The system weights client links by their positional stability (stationary clients like smart TVs and desktop computers receive high weight; mobile devices receive low weight during movement periods and high weight during stationary periods detected by accelerometer or CSI-based motion detection).
5. Alert Generation and Integration
The system generates alerts at three severity levels based on the estimated moisture severity and accumulation rate:
- Advisory (yellow): Statistically significant CSI trend consistent with early moisture intrusion detected (7-day amplitude slope exceeds −0.05 dB/day on two or more links with intersecting wall coverage). Likely status: early-stage seepage or condensation with less than 1 liter accumulated. Recommended action: visual inspection of the indicated area within 1–2 weeks. Estimated time to visible damage: 2–8 weeks.
- Warning (orange): Confirmed moisture event with estimated volumetric water content exceeding 10% in the affected wall section. Likely status: active leak or significant condensation with several liters accumulated. Recommended action: professional inspection within 48 hours, check plumbing fixtures and roof flashing near the indicated area. Estimated time to visible damage: 3–14 days.
- Critical (red): Rapid moisture accumulation (amplitude change exceeding −1 dB/hour on any link, or estimated volumetric water content exceeding 40%). Likely status: burst pipe, acute roof failure, or flooding. Recommended action: immediate water shutoff and emergency inspection. Estimated time to structural damage: hours.
Alerts are delivered through the mesh WiFi vendor's smartphone app, push notifications, email, and optionally through integrations with smart home platforms (Apple HomeKit, Google Home, Amazon Alexa, Samsung SmartThings, Home Assistant). For commercial buildings, alerts integrate with building management systems (BMS) via BACnet or Modbus protocols. For insurance carriers, a privacy-preserving alert API provides anonymized event notifications (location precision limited to building level, no occupancy or activity data) that can trigger proactive policyholder outreach or risk scoring adjustments.
6. Calibration and Baseline Establishment
Upon initial deployment (or when a new AP is added to the mesh), the system runs a 14-day baseline calibration period during which it characterizes the nominal CSI for each link under dry conditions across the full range of environmental variation (day/night temperature cycles, occupancy patterns, seasonal HVAC operation). The baseline model captures:
- Static channel component: The time-invariant CSI averaged over quiescent periods (2:00–5:00 AM, or user-configured unoccupied periods), representing the propagation channel determined by the fixed building structure.
- Diurnal variation envelope: The 24-hour cyclic variation in static-channel CSI caused by thermal expansion and contraction of building materials (wood framing expands 0.01–0.05% per 10°C temperature change, steel studs expand 0.01%, gypsum negligible). This diurnal signal is characterized by its amplitude, phase, and waveform shape, and is subtracted from the measured CSI to isolate non-thermal perturbations.
- Occupancy-correlated variation: The typical CSI perturbation statistics associated with normal building occupancy (human motion, door operations, appliance use), characterized by its temporal statistics (mean duration, repetition rate, amplitude distribution). The TCN learns to distinguish this high-frequency, zero-mean, symmetric perturbation from the low-frequency, monotonic, positive-definite perturbation caused by moisture accumulation.
If baseline calibration occurs during a period when moisture is already present (unknown to the system), the system will not detect the pre-existing moisture as an anomaly. However, any subsequent increase or change in moisture will be detected. The system mitigates this cold-start limitation by comparing the absolute CSI loss per wall transit against expected values from a building material database: if the measured per-wall attenuation significantly exceeds the expected value for the reported wall construction type, the system flags a "possible pre-existing moisture" advisory during calibration.
7. Figures Description
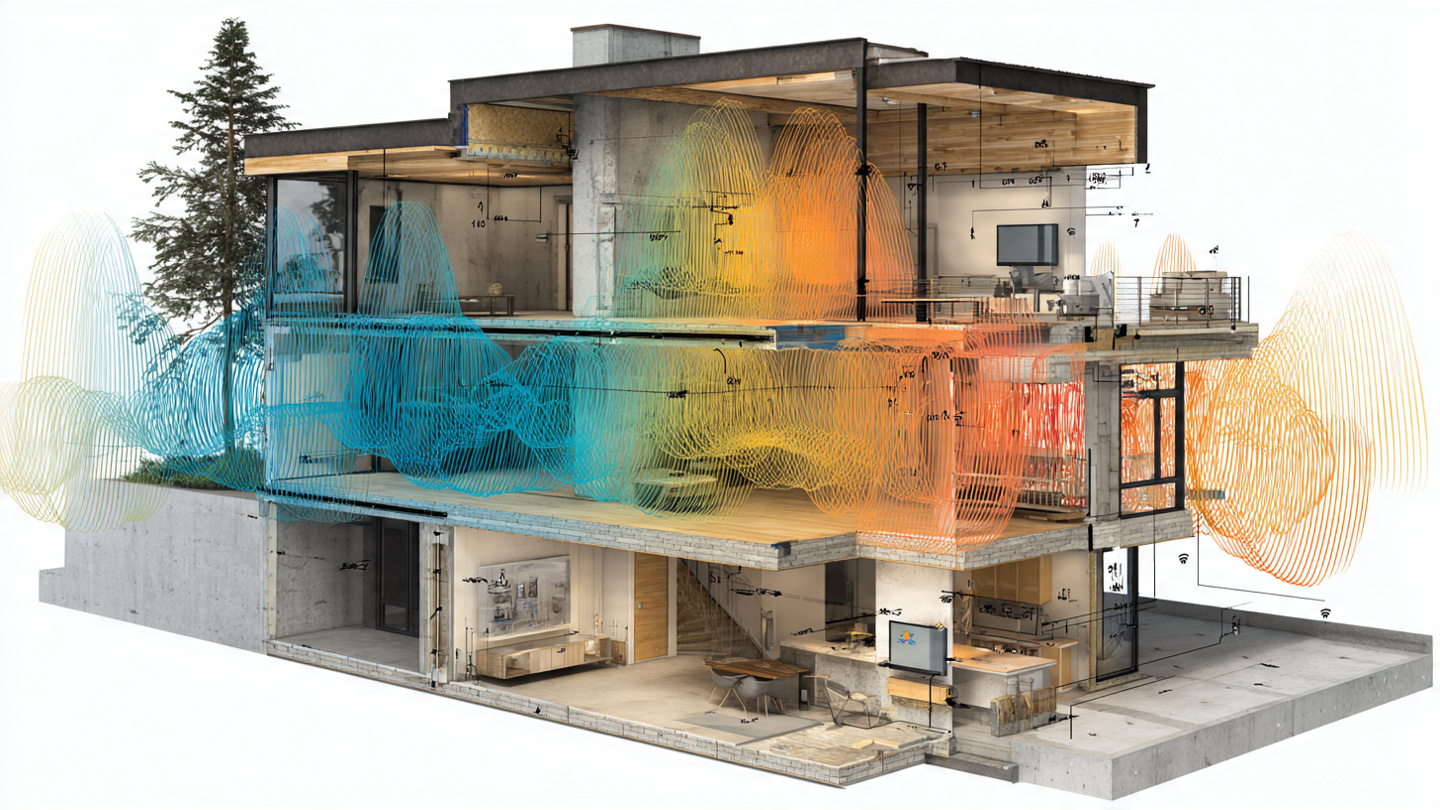
- Figure 1: System architecture showing three WiFi mesh APs in a residential floor plan, with propagation paths between APs drawn as lines traversing wall sections. Moisture intrusion in one wall section (highlighted) perturbs the CSI on two of three AP-to-AP links. CSI data flows to a local processing unit (or cloud), where the TCN classifies moisture events and the dielectric tomography module localizes them. Alerts flow to the user's smartphone via the WiFi vendor's app.
- Figure 2: Time-series plot of CSI amplitude (averaged across subcarriers) for three AP links over 30 days. Two links show a gradual monotonic decline beginning at day 12 (onset of a concealed slow leak), while the third link (not traversing the affected wall) shows stable amplitude with only diurnal oscillations. A dashed line indicates the TCN detection threshold, crossed at day 15 (3 days after leak onset).
- Figure 3: Frequency-domain CSI amplitude for a single link before and during moisture intrusion. The "before" trace shows smooth, gently varying amplitude across 234 subcarriers (80 MHz channel). The "during" trace shows increased frequency selectivity (deeper and more numerous fading notches) caused by the dielectric anomaly introducing additional multipath scatter. The difference spectrum highlights the moisture-specific CSI perturbation.
- Figure 4: Spatial localization heat map overlaid on a building floor plan, showing estimated moisture probability per wall section. The true moisture location (a plumbing leak behind a bathroom wall, verified by invasive inspection) is within the highest-probability region. The 90% confidence region spans approximately 3 meters of wall length.
- Figure 5: Receiver operating characteristic (ROC) curves for moisture detection at three severity levels (advisory, warning, critical) from simulation experiments. At the warning threshold, the system achieves area under curve (AUC) exceeding 0.92 for 3-AP deployments and 0.97 for 5+ AP deployments, with false positive rate below 1 per building-month at the operating threshold.
Claims
- A system for detecting concealed moisture intrusion in building assemblies, comprising: a plurality of WiFi access points deployed in an existing indoor wireless network, each access point transmitting and receiving orthogonal frequency-division multiplexing (OFDM) signals across a plurality of subcarriers; a channel state information extraction module that captures per-subcarrier complex amplitude and phase measurements from said access points for each transmitter-receiver link; a temporal deep learning classifier that receives CSI time series data from said extraction module and classifies slow, monotonic, persistent CSI perturbations as moisture-consistent events by distinguishing them from transient perturbations caused by human activity, thermal cycling, and other non-moisture environmental changes; and an alert module that notifies building occupants or property managers of detected moisture events.
- The system of claim 1, wherein the temporal deep learning classifier is a temporal convolutional network (TCN) with dilated causal convolutions that processes CSI data at multiple temporal resolutions simultaneously, including short-term features (1-minute windows capturing static channel state), medium-term features (1-hour windows capturing quiescent-period channel statistics), and long-term features (7-day windows capturing monotonic trend evolution).
- The system of claim 1, further comprising a spatial localization module that solves a regularized inverse problem to estimate the spatial distribution of moisture within the building by inverting the relationship between CSI perturbations measured on multiple AP links and the dielectric properties of wall sections traversed by each link's propagation path.
- The system of claim 3, wherein the spatial localization module uses L1-regularized non-negative least squares optimization to enforce sparsity (moisture typically localized to one or few wall sections) and physical constraints (moisture only increases permittivity) on the estimated moisture distribution.
- The system of claim 1, wherein the system detects moisture-induced CSI signatures including: broadband amplitude attenuation caused by increased dielectric absorption loss in moisture-saturated building materials, frequency-selective fading perturbation caused by scattering from dielectric discontinuities at moisture boundaries within wall cavities, and phase gradient (group delay) changes caused by reduced electromagnetic propagation velocity through high-permittivity moisture-laden materials.
- The system of claim 1, wherein the CSI extraction module obtains channel state information from at least one of: firmware-level CSI reporting APIs within WiFi chipset drivers, passive capture of IEEE 802.11ax beamforming sounding report frames transmitted over the air, or cloud management platform APIs exposing per-subcarrier channel quality data.
- The system of claim 1, further comprising a baseline calibration module that characterizes nominal CSI for each link under dry conditions over a calibration period of 7–30 days, separating the static building channel component, diurnal thermal variation envelope, and occupancy-correlated variation statistics, enabling the temporal classifier to operate on residual CSI perturbations after subtracting known non-moisture sources of variation.
- The system of claim 7, wherein the baseline calibration module detects possible pre-existing moisture during initial calibration by comparing measured per-wall attenuation against expected values from a building material database, flagging anomalously high attenuation as potential pre-existing moisture conditions.
- The system of claim 1, wherein the spatial localization module weights CSI measurements from stationary client devices (smart TVs, desktop computers, IoT devices) more heavily than measurements from mobile client devices (smartphones, laptops) during periods of device movement, as determined by accelerometer data or CSI-based motion detection, to improve localization accuracy.
- A method for detecting concealed moisture intrusion in building assemblies using existing WiFi infrastructure, comprising: continuously capturing WiFi channel state information from a plurality of subcarriers on each transmitter-receiver link in an indoor wireless access point deployment; computing multi-temporal-scale features from the CSI time series including static channel estimates, quiescent-period statistics, and long-term monotonic trend parameters; classifying CSI perturbation patterns as moisture-consistent or non-moisture using a temporal convolutional network trained on paired CSI and ground-truth moisture sensor data from controlled wall assembly experiments; estimating the spatial location of detected moisture events by solving a regularized dielectric tomography inverse problem across multiple AP links; and generating severity-graded alerts to building occupants or management systems based on estimated moisture volume and accumulation rate.
- The method of claim 10, wherein the temporal convolutional network is trained on a combination of laboratory controlled-moisture experiment data, synthetic CSI data generated by ray-tracing electromagnetic propagation simulation through parameterized building geometries with spatially varying dielectric properties, and in-situ weakly labeled data from deployed systems where moisture events confirmed by occupant reports or professional inspections provide retroactive labels for the preceding CSI time series.
- The method of claim 10, further comprising privacy-preserving federated learning across multiple building deployments, wherein model weight updates are aggregated across buildings without transmitting raw CSI data outside the premises, enabling continuous model improvement from operational data while preserving occupant privacy.
Implementation Notes
The system can be implemented as a software-only addition to existing mesh WiFi platforms. For consumer mesh systems (Google Nest WiFi Pro, Amazon Eero, TP-Link Deco, Ubiquiti UniFi), implementation requires a firmware update to the APs that enables periodic CSI export (at 1–10 Hz, consuming less than 0.1% of the AP's processing capacity and negligible backhaul bandwidth when compressed). The TCN inference model, quantized to INT8 for edge deployment, requires approximately 2–5 MB of storage and 10–50 ms of CPU time per classification pass (once per minute), well within the capability of the ARM Cortex-A53/A72 processors common in mesh WiFi hardware. Cloud-based inference is an alternative for platforms with existing cloud management infrastructure, with the additional benefit of centralized model updates and cross-building federated learning.
Estimated detection performance based on electromagnetic simulation and laboratory measurements: a 3-AP mesh deployment in a typical 2,000 sq ft home can detect 2+ liters of accumulated moisture in a wall cavity within 3–7 days of intrusion onset at a false positive rate below 1 event per building-month. A 5-AP deployment reduces the detection threshold to approximately 0.5 liters and the detection latency to 1–3 days. Detection performance degrades gracefully with building construction type: wood-frame construction (lowest attenuation, best sensitivity) > steel-stud (moderate attenuation) > concrete/masonry (highest baseline attenuation, lowest additional contrast from moisture). For concrete construction, the 5 GHz and 6 GHz bands provide better moisture sensitivity than 2.4 GHz due to higher baseline attenuation that amplifies the relative contrast from moisture-induced permittivity changes.
The system respects occupant privacy by design. CSI data encodes information about the propagation environment (building structure, moisture, static objects) but also captures information about human movement and activity. The system processes CSI on-device (or in an encrypted cloud pipeline), never exposes raw CSI to users or third parties, and discards activity-correlated CSI components during feature extraction. The moisture detection features (long-term trends, quiescent-period statistics) are specifically designed to contain no human activity information. For the insurance integration API, only anonymized moisture event notifications (building-level location, severity grade, no time-series data) are transmitted.
Prior Art References
- Insurance Information Institute — Homeowners Insurance Facts and Statistics — Water damage claim frequency and cost data
- EPA — Mold and Moisture — Prevalence and remediation costs of moisture-related mold in US buildings
- Wang et al., ACM MobiCom 2015 — WiFi CSI-based gesture recognition demonstrating sub-centimeter sensitivity
- Liu et al., ACM MobiSys 2016 — WiFi CSI-based respiration monitoring at 97% accuracy
- Ma et al., IEEE IoT Journal 2021 — Whole-home human activity recognition from single WiFi link CSI
- Ulaby and Long, University of Michigan Press, 2014 — Microwave dielectric properties of water and materials
- Peplinski et al., IEEE Transactions on Geoscience and Remote Sensing, 1995 — Dielectric mixing models for soil-water systems applicable to porous building materials
- Stavrou and Saunders, IEEE Transactions on Antennas and Propagation, 2003 — RF propagation measurement through building materials at 2–60 GHz
- Karhunen et al., Construction and Building Materials 2019 — Electrical impedance tomography for moisture mapping in concrete
- Gringoli et al., ACM WiNTECH 2019 — CSI extraction tools for Intel WiFi chipsets
- Jiang et al., ACM MobiCom 2022 — CSI extraction from 802.11ax beamforming sounding frames
- Wi-Fi Alliance WiFi Sensing specification, 2024 — Industry standardization of WiFi sensing interfaces
- Degli-Esposti et al., IEEE Transactions on Antennas and Propagation, 2007 — Ray-tracing propagation simulation for indoor environments
- CSI-based indoor localization methods — Access point positioning from WiFi CSI measurements
- US11235187B2 — Systems and methods for detecting building conditions based on wireless signal degradation (general building condition detection, not moisture-specific CSI subcarrier analysis with temporal deep learning and dielectric tomography)
- US10701531B2 — Environmental sensing with wireless communication devices (context-based RF profile comparison without per-subcarrier CSI analysis, dielectric modeling, or building-assembly-specific moisture detection)