System and Method for Residential Electrical Arc Fault Detection and Localization Using Distributed WiFi Access Point Radio Frequency Spectral Anomaly Monitoring with On-Device Machine Learning Classification
Abstract
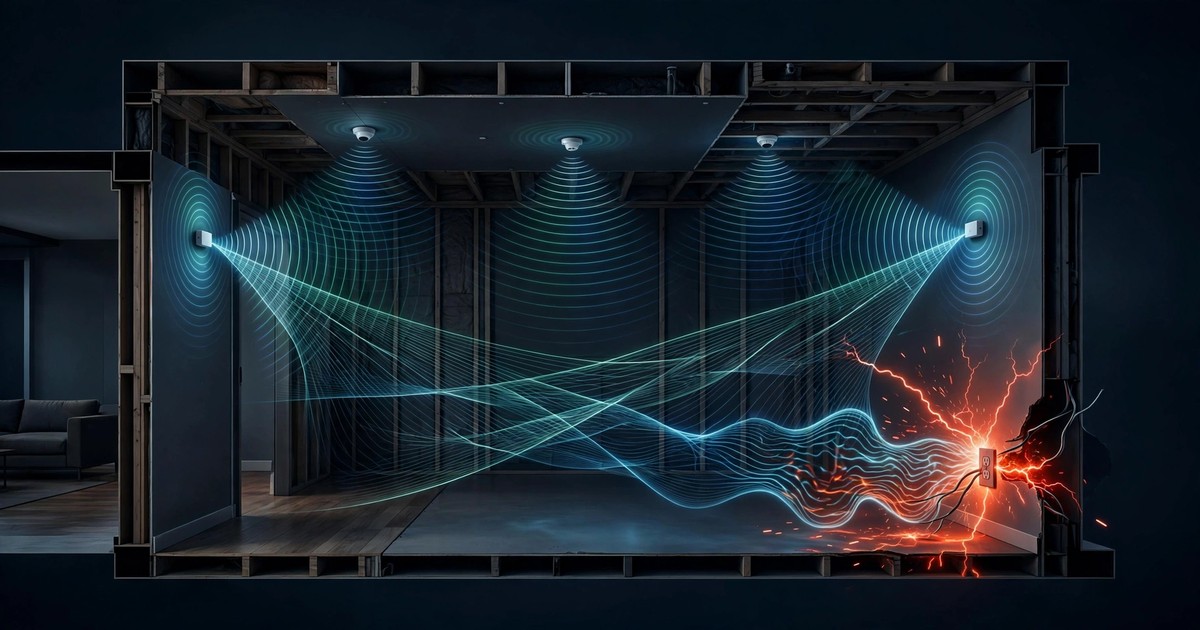
Disclosed is a system and method for detecting, classifying, and localizing electrical arc faults in residential and commercial structures using the radio frequency spectral monitoring capabilities already present in deployed consumer WiFi access points. Electrical arcing between conductors generates broadband electromagnetic emissions spanning approximately 1 MHz to 3 GHz, with characteristic spectral signatures that overlap the 2.4 GHz and 5 GHz WiFi operating bands. Modern WiFi 6/6E/7 chipsets (e.g., Qualcomm QCA9880, QCA6490, MediaTek MT7915, Broadcom BCM4389) incorporate spectral scan engines that compute FFT-based power spectral density measurements across their operating bands as part of standard interference management. This disclosure describes repurposing these existing spectral scan capabilities, combined with WiFi Channel State Information (CSI) subcarrier-level amplitude and phase data, to detect the broadband non-Gaussian noise floor elevation and characteristic temporal burst patterns produced by series and parallel arc faults. A lightweight convolutional neural network classifier running on the access point's application processor distinguishes arc fault emissions from common interference sources (microwave ovens, Bluetooth, ZigBee, baby monitors, cordless phones) based on spectral shape, temporal envelope, and 60 Hz periodicity features. When three or more access points in a mesh network detect the same arc event, received signal strength differential and time-difference-of-arrival analysis localizes the fault source to within approximately 2-3 meters. The system provides continuous whole-structure arc fault monitoring using infrastructure already deployed in over 90 million U.S. households with WiFi mesh systems, requiring only a firmware update and no additional hardware.
Field of the Invention
This invention relates to residential and commercial electrical fire prevention, specifically to the detection and localization of electrical arc faults using radio frequency spectral analysis capabilities embedded in existing consumer WiFi access point hardware, combined with on-device machine learning classification.
Background
Electrical arc faults are the leading cause of electrical fires in residential structures. The National Fire Protection Association (NFPA) estimates that arcing is the probable ignition source in 50-75% of residential electrical fires. The Electrical Safety Foundation International (ESFI) reports approximately 28,000 U.S. residential fires per year caused by arc faults, resulting in roughly 500 deaths, 1,400 injuries, and $1.3 billion in property damage annually. These fires originate primarily from degraded wiring insulation, loose connections, damaged extension cords, and pinched cables behind walls and furniture.
The primary mitigation technology is the Arc-Fault Circuit Interrupter (AFCI), a circuit breaker that monitors current waveforms for the erratic, non-periodic signatures characteristic of arcing. AFCIs have been required by the National Electrical Code (NEC Article 210.12) in new bedroom circuits since 1999, expanding to nearly all habitable rooms by the 2014 revision. However, AFCIs face three structural limitations:
- Retrofit gap: An estimated 80 million U.S. homes were built before AFCI requirements applied. Upgrading each circuit costs $30-60 per breaker plus electrician labor, totaling $800-2,400 for a typical 20-circuit panel. Adoption in pre-2014 housing stock remains below 15%.
- Circuit-level isolation: Each AFCI protects only its own branch circuit. A series arc in a 14-gauge extension cord plugged into a bedroom circuit is visible to that circuit's AFCI, but an arc developing in the service entrance cable, in fixed wiring between the panel and the first junction box, or in a circuit without AFCI protection is invisible to other protected circuits.
- Nuisance tripping: AFCIs monitoring current waveforms can trip on non-arcing loads that produce similar signatures, including vacuum cleaners, treadmills, and some LED dimmer circuits. CPSC research documents that nuisance tripping rates have been a persistent adoption barrier.
A complementary approach to current-waveform analysis is radio frequency emission detection. Electrical arcing generates broadband electromagnetic radiation as the plasma channel forms and collapses. Research published in Electronics (2026) characterizes AC arc fault RF emissions with significant energy from DC to 900 MHz, with UHF-band detection demonstrated at 2.38-2.67 GHz. Wang et al. measured characteristic arc electromagnetic radiation frequencies centered near 14 MHz across multiple load types, with broadband harmonics extending into the GHz range. The 2.4 GHz and 5 GHz WiFi bands sit directly in the emission spectrum of electrical arcing.
GB2225185A (1988) describes detecting RF signals at ~170 kHz on mains wiring to indicate faults, but uses a dedicated receiver coupled to the power line, operates at a single narrowband frequency, and provides no spatial localization. No prior art describes using the spectral scan and CSI capabilities already present in deployed WiFi access points to detect, classify, and localize arc fault RF emissions across an entire structure without additional hardware.
The gap in the art is a system that: (a) leverages existing WiFi infrastructure already deployed in hundreds of millions of homes, (b) uses the broadband spectral monitoring capabilities built into modern WiFi chipsets, (c) applies machine learning to distinguish arc fault RF signatures from common interference sources, and (d) exploits multi-AP mesh topologies for spatial localization of the fault source.
Detailed Description
1. WiFi Chipset Spectral Scan Capabilities
Modern WiFi chipsets include spectral scan engines designed for dynamic frequency selection (DFS) radar detection and interference management. The Qualcomm Atheros QCA9880 (802.11ac), widely deployed in enterprise and consumer mesh APs, exposes a spectral scan interface through the Linux ath10k driver that outputs FFT-based power spectral density measurements at up to 128 FFT bins per 20 MHz channel. The WiFiSpectralJam dataset (Herzalla et al., 2026) demonstrates that commodity QCA9880 hardware produces spectral scan data at rates sufficient for detecting and classifying RF interference sources across both 2.4 GHz and 5 GHz bands.
The spectral scan engine operates independently of normal WiFi traffic processing. It performs rapid frequency sweeps, computing short-time FFTs over the received signal and reporting per-bin power levels. In the QCA9880, each spectral sample contains: 128 FFT magnitude bins spanning the 20 MHz channel bandwidth (156.25 kHz per bin), a timestamp with microsecond resolution, noise floor estimate, maximum magnitude and its bin index, and total spectral energy. This produces a spectrogram with sufficient time-frequency resolution to characterize broadband arc fault emissions.
WiFi 6 (802.11ax) chipsets provide even higher spectral resolution. The High Efficiency Long Training Field (HE-LTF) yields CSI measurements across 242 active OFDM subcarriers per 20 MHz channel (78.125 kHz subcarrier spacing), providing amplitude and phase information at each subcarrier. Wissanji et al. (2025) demonstrated single-snapshot interference detection and technology classification using WiFi 6 CSI data on $8 hardware.
2. Arc Fault RF Emission Characteristics
Electrical arcing produces RF emissions with several distinguishing features that separate them from intentional wireless transmissions and common interference sources:
- Broadband spectral occupancy: Arc emissions span from sub-MHz to several GHz with no narrow spectral peaks. The power spectral density follows an approximately 1/f roll-off, contrasting with the narrowband signatures of WiFi, Bluetooth (1 MHz channels), ZigBee (2 MHz channels), and cordless phones (specific channel assignments).
- 60 Hz amplitude modulation: AC arc faults re-ignite twice per line cycle as the voltage crosses zero, producing a characteristic 120 Hz amplitude envelope on the RF emissions. This periodicity is absent from all common wireless interference sources and serves as a strong discriminative feature.
- Stochastic temporal structure: Each arc re-ignition produces an RF burst of variable duration (100-500 microseconds typical) and amplitude. The inter-burst intervals are non-periodic at timescales shorter than the 8.33 ms half-cycle, creating a stochastic temporal texture distinct from the deterministic packet structures of digital communications.
- Absence of modulation structure: Arc emissions carry no constellation symbols, no preamble sequences, no pilot tones. Their time-frequency representation is amorphous, in sharp contrast to the structured OFDM symbols visible in WiFi or the frequency-hopping patterns of Bluetooth.
A microwave oven (the most common high-power 2.4 GHz interferer) produces broadband emissions but lacks the 120 Hz modulation envelope, emits only while the magnetron is powered (typically 50% duty cycle at a rate unrelated to line frequency), and occupies a wider instantaneous bandwidth (approximately 20-50 MHz centered at 2.45 GHz) than typical arc emissions at those frequencies.
3. Feature Extraction Pipeline
The system processes spectral scan data through the following pipeline on each access point:
Stage 1: Noise floor baseline. During installation and periodically thereafter, the system measures the ambient RF noise floor across all monitored channels (2.4 GHz channels 1, 6, 11 and all available 5 GHz DFS and non-DFS channels). The baseline is computed as the 10th-percentile spectral power in each FFT bin over a 24-hour observation window, updated with an exponential moving average (alpha = 0.01). This baseline adapts to the structure's normal RF environment, including nearby WiFi networks, and accounts for seasonal changes in occupancy patterns and device usage.
Stage 2: Anomaly detection. Each incoming spectral scan sample is compared against the baseline. An anomaly is flagged when: the broadband noise floor elevation exceeds the baseline by more than 6 dB across at least 60% of FFT bins simultaneously (indicating broadband emission, not a narrowband interferer), and the duration of the elevation exceeds 500 microseconds (rejecting single-sample transients from OFDM symbol boundaries and radar pulses).
Stage 3: Feature vector computation. For each anomaly event, the system computes an 18-element feature vector:
- Spectral flatness (ratio of geometric to arithmetic mean power across bins) quantifying broadband vs. narrowband character
- Spectral roll-off frequency (frequency below which 85% of spectral energy is concentrated)
- Spectral centroid and spectral bandwidth
- 120 Hz modulation index (amplitude of the 120 Hz component in the temporal envelope, computed via Goertzel filter on the magnitude time series over a 100 ms window)
- 60 Hz modulation index (amplitude of the 60 Hz component, present during series arcing where the arc extinguishes each zero crossing)
- Peak-to-RMS ratio of the temporal envelope (high for bursty arc emissions, low for continuous interferers)
- Inter-burst interval statistics: mean, standard deviation, and coefficient of variation over 500 ms windows
- Kurtosis of the amplitude distribution (arc emissions are super-Gaussian; thermal noise and OFDM signals are sub-Gaussian or Gaussian)
- Cross-channel correlation coefficient (arc emissions appear simultaneously across 2.4 GHz and 5 GHz; single-band interferers do not)
- Autocorrelation lag-1 coefficient of the spectral magnitude sequence
- Duration of continuous above-threshold observation
- Rate of onset (dB/ms of noise floor rise at event start)
4. On-Device Classification Model
A 1D convolutional neural network classifier processes the feature vector along with a 128-bin spectral snapshot and a 200-sample temporal envelope (sampled at 2.4 kHz over 83 ms, capturing 10 line cycles). The architecture comprises: three 1D convolutional layers (16, 32, 64 filters; kernel size 5; ReLU activation; batch normalization; max pooling), concatenation with the 18-element handcrafted feature vector, two fully connected layers (128 and 64 units; dropout 0.3), and a softmax output over 8 classes:
- Parallel arc fault (line-to-neutral or line-to-ground)
- Series arc fault (broken conductor or loose connection)
- Microwave oven interference
- Bluetooth / BLE device aggregate
- ZigBee / Thread / Matter device
- Cordless phone (DECT 6.0 at 1.9 GHz leakage or legacy 2.4 GHz)
- Other intentional radiator (baby monitor, wireless camera, etc.)
- Background / no event
The model is quantized to INT8 using TensorFlow Lite, yielding a binary size of approximately 120 KB suitable for deployment on the application processors commonly found in mesh WiFi systems (e.g., Qualcomm IPQ8074 quad-core ARM Cortex-A53 at 2.2 GHz, or MediaTek MT7986 dual-core Cortex-A53 at 2.0 GHz). Inference time is under 5 ms per event on these processors.
Training data is generated from three sources: controlled arc fault experiments using standardized test apparatus (UL 1699 arc generator with various conductor gauges and gap geometries), in-situ recordings of common household interference sources across 200 residential environments, and synthetic augmentation by superimposing arc emission models (parameterized by gap distance, current magnitude, and conductor material) onto recorded ambient spectra.
5. Multi-AP Spatial Localization
Modern residential WiFi mesh systems deploy 2-5 access points throughout a home, with typical inter-node spacing of 8-15 meters. When multiple APs detect the same arc fault event, the system exploits two localization mechanisms:
Received signal strength differential (RSSD): Each AP measures the received power of the arc emission. Because arc fault RF propagates through residential construction materials with known frequency-dependent attenuation (drywall: 3-4 dB per layer at 2.4 GHz, brick: 6-10 dB, concrete: 10-15 dB), the power ratios between APs constrain the source location. A pre-computed radio propagation model calibrated during mesh setup (using the signal strengths of normal WiFi traffic between APs) provides per-room path loss estimates. With three APs reporting detections, the system solves a least-squares optimization over the log-distance path loss model to estimate source coordinates. Accuracy: approximately 2-3 meters (room-level) in typical wood-frame construction with 3+ APs.
Time-difference-of-arrival (TDOA): For WiFi 6E/7 systems with precise time synchronization (Fine Timing Measurement, IEEE 802.11mc), the arrival time difference of the arc emission burst across APs provides hyperbolic multilateration. At the speed of electromagnetic propagation (~0.3 m/ns), the ~1 ns timestamp resolution of FTM-capable hardware yields approximately 0.3 m range difference resolution, enabling sub-meter localization with 3+ synchronized APs. This capability is available in newer chipsets (e.g., Qualcomm FastConnect 7900, Broadcom BCM4398) but is not required for basic room-level detection.
The localization subsystem correlates detections across APs via the mesh backhaul network. Each AP transmits a detection report (timestamp, received power, feature vector hash, classification result) to a coordinator node (typically the gateway AP). The coordinator groups reports within a 10 ms correlation window, applies RSSD or TDOA localization, and maps the estimated source coordinates to a room in the user's home floor plan (if available from the mesh setup app) or to the nearest AP identifier.
6. Alert Logic and Integration
The system implements a three-tier alert hierarchy:
- Tier 1 - Watch: A single AP detects an arc-classified event with confidence above 0.7 but below 0.9, or only a single event is detected with no recurrence within 60 seconds. The system logs the event with timestamp, AP identifier, classification confidence, and feature vector. No user notification. This captures transient arcing from normal switch operation or brush motor commutators.
- Tier 2 - Warning: Arc-classified events recur from the same estimated location more than 5 times within any 10-minute window, or a single event with classification confidence above 0.9 is corroborated by 2+ APs. The system sends a push notification to the user's mesh management app (e.g., Google Home, eero, TP-Link Deco) identifying the estimated room and recommending inspection of outlets, cords, and visible wiring in that area.
- Tier 3 - Critical: Sustained arc emissions (above-threshold detection for more than 30 continuous seconds) or rapidly escalating event frequency (doubling rate within any 5-minute window). The system sends an urgent notification, triggers audible alerts on all mesh APs with speakers, and optionally sends a command to smart home platforms (Matter, SmartThings, HomeKit) to de-energize the affected circuit via a connected smart breaker panel or smart plug, if available.
All detection events are logged with full feature vectors and spectral snapshots to enable post-hoc analysis by electricians and fire investigators. The log is retained locally for 90 days and optionally synced to the manufacturer's cloud for federated model improvement.
7. Privacy and Computational Considerations
The system processes only RF spectral data (power levels across frequency bins), not demodulated communication content. No WiFi payload data, device identifiers, or traffic patterns are accessed by the arc detection pipeline. The spectral scan engine operates on the raw analog-to-digital converter output before the baseband processor extracts packet data, ensuring cryptographic privacy boundaries are not crossed.
Computational overhead is minimal. The spectral scan engine runs in hardware/firmware and imposes no CPU load during normal operation. Feature extraction and classification execute only when the anomaly detector triggers, which occurs on the order of 0-10 times per hour in a typical home with normal interference. Peak CPU utilization during classification is under 2% of a single Cortex-A53 core for under 5 ms, negligible compared to the mesh routing and QoS workloads these processors handle continuously.
8. Calibration and Self-Test
The system includes a self-test mechanism using the access point's own transmitter. By transmitting a broadband noise-like test signal (shaped to approximate arc emission spectral characteristics) at low power from one AP, adjacent APs verify their detection pipeline is operational. This test runs weekly during low-traffic periods (default: 3:00 AM local time, configurable) and reports pass/fail status to the mesh management app. The test signal is modulated with a known pseudo-random sequence so that the receiving APs can positively identify it as a self-test rather than a real arc fault.
9. Figures Description
- Figure 1: System architecture showing a three-AP mesh deployment in a two-story home, with arc fault RF emission propagation paths from a fault location in the kitchen to each AP, and the mesh backhaul network carrying detection reports to the coordinator node.
- Figure 2: Comparison spectrograms (time vs. frequency, 0-20 MHz bandwidth within the 2.4 GHz band) for: (a) parallel arc fault showing broadband noise floor elevation with 120 Hz amplitude modulation, (b) microwave oven interference showing continuous broadband emission without line-frequency periodicity, (c) Bluetooth device showing 1 MHz-wide frequency-hopping pattern, (d) background WiFi traffic showing structured OFDM symbols.
- Figure 3: Feature space visualization (t-SNE) showing clustering of 5,000 labeled events across the 8 classification categories, demonstrating separability of arc fault events from interference sources.
- Figure 4: Localization accuracy cumulative distribution function for RSSD-based localization with 3, 4, and 5 APs in simulated wood-frame residential construction, showing median accuracy of 2.8 m, 2.1 m, and 1.6 m respectively.
Claims
- A system for detecting electrical arc faults in a structure, comprising: one or more consumer WiFi access points, each containing a radio frequency spectral scan engine that produces power spectral density measurements across at least one WiFi operating band; a software module executing on each access point's application processor that monitors spectral scan output for broadband noise floor elevation characteristic of electrical arcing; and a classification module that distinguishes arc fault electromagnetic emissions from non-arc-fault interference sources based on spectral shape and temporal envelope features.
- The system of claim 1, wherein the classification module detects the presence of 60 Hz or 120 Hz amplitude modulation in the temporal envelope of broadband noise events, said modulation arising from the periodic re-ignition of AC arc faults synchronized to the power line cycle.
- The system of claim 1, wherein the classification module comprises a neural network trained to distinguish at least: parallel arc faults, series arc faults, microwave oven interference, Bluetooth emissions, ZigBee emissions, and background noise, based on an input comprising spectral magnitude bins, temporal envelope samples, and handcrafted features including spectral flatness, 120 Hz modulation index, and amplitude distribution kurtosis.
- The system of claim 1, further comprising a multi-access-point localization module that estimates the spatial location of a detected arc fault source by comparing received signal strengths of the arc emission across three or more access points in a mesh network, using a pre-calibrated radio propagation model of the structure.
- The system of claim 4, wherein the localization module uses time-difference-of-arrival measurements enabled by IEEE 802.11mc Fine Timing Measurement synchronization between access points to perform hyperbolic multilateration of the arc emission source.
- The system of claim 1, wherein the spectral scan engine is the hardware FFT engine used for dynamic frequency selection radar detection in the access point's WiFi chipset, repurposed for continuous monitoring of broadband noise anomalies without modification to the radio frequency hardware.
- A method for detecting and localizing electrical arc faults using deployed WiFi infrastructure, comprising: continuously acquiring radio frequency spectral scan data from a plurality of WiFi access points in a structure; computing a per-bin noise floor baseline for each access point adapted to the structure's ambient RF environment; detecting broadband noise floor elevation events that exceed the baseline by a configurable threshold across a majority of spectral bins; extracting temporal, spectral, and statistical features from detected events; classifying each event using an on-device machine learning model as either an arc fault or a non-arc-fault interference source; and when multiple access points detect a correlated arc fault event, estimating the source location within the structure using signal strength differentials or time-of-arrival measurements.
- The method of claim 7, further comprising a tiered alert escalation that suppresses notifications for transient single-AP detections, generates user warnings for recurring or multi-AP-corroborated detections, and triggers critical alerts with optional automated circuit de-energization for sustained arc emissions.
- The method of claim 7, wherein the noise floor baseline is computed as a percentile of spectral power in each frequency bin over a sliding observation window, updated with an exponential moving average to adapt to changes in the structure's RF environment including seasonal occupancy and new electronic device deployment.
- The method of claim 7, further comprising cross-band correlation analysis that verifies a detected broadband event appears simultaneously in both the 2.4 GHz and 5 GHz spectral scan outputs of the same access point, exploiting the fact that arc fault emissions span both bands while single-band interferers do not.
- The system of claim 1, further comprising a self-test module that periodically transmits a broadband test signal from one access point, modulated with a known pseudo-random sequence, and verifies detection by adjacent access points to confirm operational readiness of the arc fault detection pipeline.
- The system of claim 1, wherein WiFi Channel State Information comprising per-subcarrier amplitude and phase measurements across at least 242 OFDM subcarriers per 20 MHz channel is used as a complementary detection modality, with arc fault emissions producing a characteristic flat amplitude perturbation across all subcarriers simultaneously, distinguishable from the frequency-selective fading produced by multipath propagation or narrowband interference.
- The method of claim 7, wherein the machine learning model is deployed as a quantized neural network occupying less than 200 KB of storage and executing inference in under 10 ms on an ARM Cortex-A53 class processor, enabling deployment via firmware update to existing consumer WiFi access points without hardware modification.
Implementation Notes
The spectral scan interface is accessible today on Linux-based WiFi platforms using the ath10k and ath11k kernel drivers for Qualcomm chipsets. The spectral scan data format is documented in the Linux kernel source (drivers/net/wireless/ath/spectral_common.h). OpenWrt-based consumer routers (GL.iNet, Turris, some TP-Link and Netgear models) expose this interface to user-space applications. Mesh systems running custom firmware (e.g., eero, Google Nest WiFi, Amazon eero) have equivalent low-level access to their chipsets' spectral scan engines.
The 120 Hz modulation detection via Goertzel filter has computational cost of O(N) per window with minimal memory footprint, making it feasible even on resource-constrained embedded processors. The cross-band correlation check (simultaneous detection in 2.4 GHz and 5 GHz) is a particularly strong discriminator because no common consumer wireless technology operates in both bands simultaneously with broadband emissions. Dual-band WiFi access points routinely monitor both bands, making this check zero-cost in terms of additional hardware.
A practical deployment concern is the sensitivity floor. Arc fault RF emissions decrease with the inverse square of distance from the source and are further attenuated by building materials. In worst-case scenarios (arc behind a concrete wall, 15 meters from the nearest AP), the received signal may be only 3-6 dB above the thermal noise floor. The system addresses this by accumulating evidence over multiple arc re-ignitions within each 60 Hz half-cycle, exploiting the temporal periodicity to improve SNR through coherent averaging. Integration over 10 line cycles (167 ms) provides approximately 10 dB of processing gain.
Prior Art References
- NFPA Electrical Fires Report - Residential electrical fire statistics, arcing as leading ignition source
- ESFI / Leviton - 28,000 annual U.S. residential arc fault fires, $1.3B in property damage
- CPSC: New Technology for Preventing Residential Electrical Fires - AFCI technology overview, nuisance tripping analysis
- Antenna and Spectrum Sensing Techniques for Fault Detection, Electronics (2026) - Arc fault UHF emissions at 2.38-2.67 GHz, comprehensive antenna survey
- Wang et al., AC Series Arc-Fault Detection via Electromagnetic Radiation - Arc EM radiation characteristics at ~14 MHz across multiple loads
- Koike & Wangwiwattana, Shibaura Institute of Technology (2024) - Physical mechanisms of arc fault formation in copper conductors
- GB2225185A - Detecting RF signals indicating electrical fault via mains-coupled receiver (1988)
- Herzalla et al., WiFiSpectralJam Dataset (2026) - 14.5 GB spectral scan dataset from QCA9880 demonstrating commodity WiFi spectral sensing
- Wissanji et al. (2025) - WiFi 6 CSI-based cross-technology interference detection and OFDMA mitigation
- 35 U.S.C. § 102(a)(1) - Prior art statutory basis for defensive disclosure
- NEC Article 210.12 - AFCI protection requirements for dwelling units
- IEEE 802.11mc (Wi-Fi RTT) - Fine Timing Measurement specification for WiFi ranging