System and Method for Real-Time Urban Thermal Comfort Mapping Using Crowdsourced Wearable Physiological Data with Privacy-Preserving Spatial Aggregation
Abstract
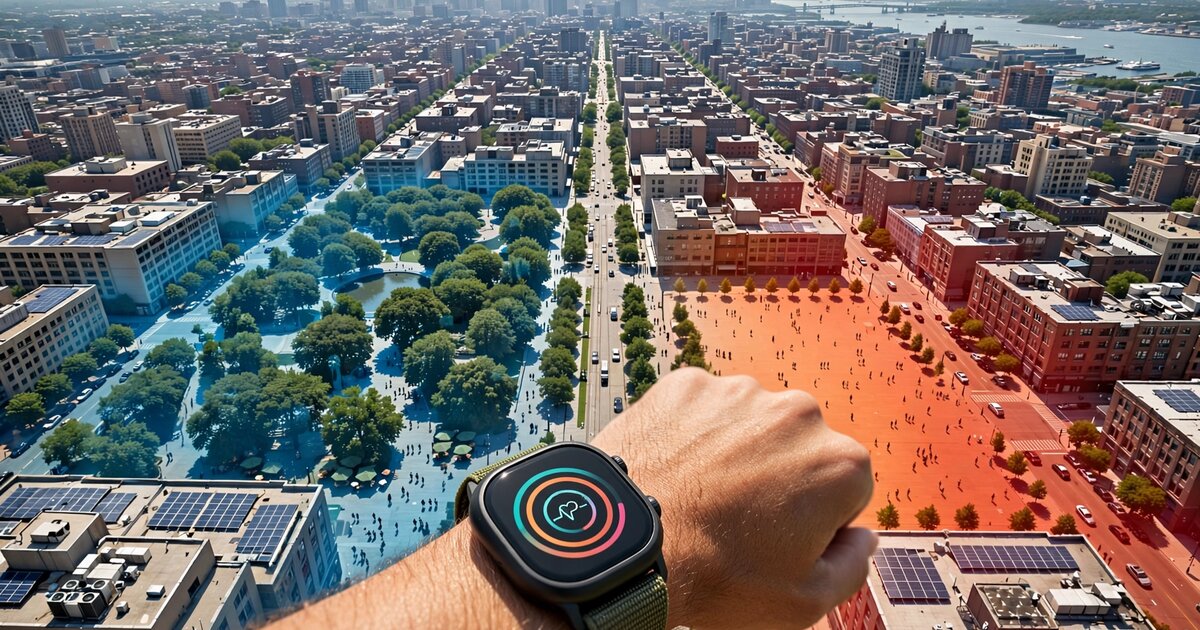
Disclosed is a system and method for generating real-time, street-level thermal comfort maps of urban environments by aggregating physiological response data from consumer wearable devices worn by opt-in pedestrians. Rather than measuring ambient temperature at sparse weather station locations, the system infers perceived thermal comfort directly from the human thermoregulatory responses captured by existing smartwatch sensors: skin temperature, photoplethysmography (PPG)-derived peripheral vasomotor tone, electrodermal activity (EDA), and accelerometer-derived metabolic rate estimates. Each wearable device runs an on-device inference pipeline that computes a Physiological Thermal Comfort Score (PTCS) without transmitting raw biometric data, then reports only the PTCS value paired with a spatially coarsened location (50-meter grid cell) and a temporal bucket (15-minute window) to a central aggregation service. The aggregation layer applies calibrated differential privacy noise injection (ε = 2.0, δ = 10⁻⁵) and requires a minimum k-anonymity threshold of five contributing devices per grid cell before publishing comfort values. A graph convolutional network fuses the sparse, noisy crowd-reported PTCS values with publicly available environmental covariates — satellite-derived surface temperature, weather station data, building shadow geometry from 3D city models, and vegetation canopy fraction from LiDAR — to produce continuous thermal comfort maps at 25-meter resolution, updated every 15 minutes. The resulting maps enable heat-wave public health response targeting, urban planning prioritization, outdoor event safety management, and pedestrian routing optimization.
Field of the Invention
This invention relates to urban environmental monitoring, specifically to methods for mapping perceived thermal comfort across city environments using crowdsourced physiological data from consumer wearable devices, fused with environmental remote sensing data through graph neural networks, with privacy-preserving data collection architecture.
Background
Urban heat exposure is a leading weather-related cause of mortality. The Lancet Countdown 2024 report estimated that heat-related mortality among adults over 65 increased 167% between 2000 and 2023, with urban populations disproportionately affected due to the urban heat island (UHI) effect. In the United States alone, the CDC reports an average of 1,220 heat-related deaths annually, with the actual figure likely 2-3× higher due to underreporting on death certificates.
Critically, ambient air temperature alone is a poor predictor of human thermal stress. The Universal Thermal Climate Index (UTCI), developed by the International Society of Biometeorology, demonstrates that perceived thermal stress depends on the interaction of air temperature, mean radiant temperature, wind speed, and humidity — plus individual factors like metabolic rate, clothing insulation, and acclimatization history. Two locations at identical air temperatures can differ by 15°C or more in UTCI-equivalent thermal stress depending on sun exposure, wind shelter, and surface albedo. Gallacher and Boehnke (2024) confirmed this spatial variability at sub-block resolution in Dresden, finding UTCI differences of up to 12°C within 200 meters.
Current approaches to urban thermal comfort assessment have fundamental limitations:
- Fixed weather stations: National Weather Service stations are spaced 10-50 km apart, far too coarse to capture intra-urban variability. Airport-based stations, which dominate reporting networks, systematically underrepresent downtown heat island intensity. Supplementary urban weather networks (e.g., MesoWest) improve coverage but still measure ambient conditions, not human thermal response.
- Mobile meteorological surveys: Researchers have deployed custom sensor packages on bicycles or pedestrian transects to measure UTCI components at street level (Gallacher and Boehnke, 2024; Bröde et al., 2012). These campaigns produce high-resolution snapshots but cannot operate continuously, cover at most a few city blocks per survey day, and require trained operators with specialized equipment costing $2,000-5,000 per unit.
- Satellite thermal imagery: Landsat and ECOSTRESS provide surface temperature at 30-70 meter resolution, but surface temperature diverges substantially from pedestrian-level air temperature in three-dimensional urban canyons. Revisit times (16 days for Landsat, ~3 days for ECOSTRESS) and cloud cover gaps prevent real-time monitoring. Voogt and Oke (2003) showed that satellite-derived surface temperature overestimates pedestrian thermal exposure in shaded urban canyons by 8-20°C.
- Computational fluid dynamics models: Tools like ENVI-met and the Urban Multi-scale Environmental Predictor (UMEP) can simulate UTCI at 1-2 meter resolution, but require detailed 3D building models, vegetation databases, and material property assignments. Simulation times of hours to days preclude real-time operation, and model validation against field measurements shows RMS errors of 3-7°C UTCI for complex urban geometries.
Meanwhile, consumer wearable devices have become ubiquitous physiological sensors. As of 2025, global smartwatch shipments exceeded 220 million units annually (IDC), with Apple Watch, Samsung Galaxy Watch, and Garmin collectively representing over 65% of the market. Modern smartwatches routinely include: infrared skin temperature sensors (Apple Watch Series 8+, Samsung Galaxy Watch 5+, Fitbit Sense 2), PPG optical heart rate sensors capable of measuring pulse wave amplitude (a proxy for peripheral vasomotor tone), EDA sensors (Apple Watch Ultra, Samsung Galaxy Watch 4+, Fitbit Sense series), 3-axis accelerometers and gyroscopes, barometric altimeters, and GPS receivers. These sensors collectively capture the human body's thermoregulatory response — the very phenomenon that thermal comfort indices attempt to model from environmental inputs.
The gap in the art is a system that: (a) uses the physiological thermoregulatory data already captured by consumer wearables to directly measure perceived thermal comfort, bypassing the need for environmental instrumentation entirely; (b) aggregates this data from many users to produce continuous spatial maps at street-block resolution; (c) protects individual biometric privacy through on-device computation and formal differential privacy guarantees; and (d) fuses sparse physiological reports with dense environmental covariates via learned spatial models to produce complete, high-resolution comfort maps.
Detailed Description
1. On-Device Physiological Thermal Comfort Score (PTCS)
Each participating wearable device computes a Physiological Thermal Comfort Score locally, using sensor data that never leaves the device. The PTCS is a continuous value on a [-4, +4] scale corresponding to the ASHRAE 7-point thermal sensation scale (cold to hot), computed from four physiological channels:
Channel 1: Skin temperature (T_skin). Wrist skin temperature is sampled at 1 Hz from the device's infrared thermopile or thermistor. Raw readings are calibrated against a personalized baseline established during the device's initial 72-hour wear period. The baseline captures the user's individual diurnal skin temperature rhythm (typically 31-35°C with a 1.5-2°C circadian swing). Deviations from baseline are more informative than absolute values because absolute wrist skin temperature varies by ±2°C across individuals due to differences in subcutaneous fat thickness, skin pigmentation, and vascular anatomy. The system computes ΔT_skin = T_skin(t) − T_baseline(t_circadian), where t_circadian is the time-of-day-matched baseline value.
Channel 2: Peripheral vasomotor tone (VMT). PPG pulse wave amplitude (PWA), measured as the AC component of the PPG signal divided by the DC component, serves as a proxy for peripheral vasodilation/vasoconstriction. During heat stress, the body increases peripheral blood flow to dissipate heat, raising PWA; during cold stress, peripheral vasoconstriction reduces PWA. The system computes a normalized VMT index: VMT = (PWA(t) − PWA_baseline) / PWA_baseline, where PWA_baseline is the user's resting PWA at thermoneutral conditions. Charkoudian (2010) demonstrated that skin blood flow can increase from a resting baseline of ~300 mL/min to 7-8 L/min during maximal heat stress, producing a measurable PPG signal change even at the wrist, where perfusion changes are smaller but still detectable (typical PWA increase of 40-120% from thermoneutral to hot conditions).
Channel 3: Electrodermal activity (EDA). Tonic skin conductance level (SCL) reflects sweat gland activity, which increases with thermal load. EDA sensors on the wrist underside measure SCL at 4 Hz. The system tracks the rate of change of SCL (dSCL/dt) rather than the absolute level, because absolute SCL is confounded by emotional arousal and stress. Thermal sweating produces a gradual, sustained rise in SCL (typically 0.5-2 µS over 10 minutes during moderate heat exposure), while emotional sweating produces brief, phasic responses (0.1-0.5 µS over 1-5 seconds). A bandpass filter (0.001-0.01 Hz) isolates the thermal component. Not all devices include EDA sensors; the PTCS model degrades gracefully when this channel is absent.
Channel 4: Activity-adjusted metabolic rate (M_est). Accelerometer data is processed through an activity classification model (walking, running, cycling, standing, sitting) to estimate metabolic heat production in Watts per square meter of body surface (W/m²). Walking at 4 km/h produces approximately 165 W/m²; sitting produces approximately 58 W/m². This estimate is used to deconfound thermal discomfort from exercise-generated heat. Without metabolic adjustment, a jogger passing through a comfortable park would report heat stress indistinguishable from a sedentary person in a genuine heat trap.
These four channels feed a compact neural network (3-layer MLP, 64/32/16 units, ReLU activation, ~12 KB quantized INT8 model) that outputs the PTCS value. The model is trained on a labeled dataset collected from controlled thermal chamber studies where subjects wore consumer smartwatches while exposed to systematically varied thermal conditions (UTCI range: -13°C to +46°C) and reported thermal sensation votes on the ASHRAE scale. Training data is collected from diverse populations spanning ages 18-75, BMI 18-35, and both acclimatized and non-acclimatized subjects to capture population-level response variability. The on-device model is personalized over time using federated transfer learning: the last layer is fine-tuned locally based on the user's explicit thermal comfort votes (solicited via occasional 1-tap prompts) without sharing the user's data.
2. Privacy-Preserving Data Collection Architecture
The system's privacy architecture ensures that no individual's biometric data, precise location, or thermal comfort trajectory is recoverable from the collected data, even by the system operator.
On-device aggregation: Raw sensor data never leaves the device. Only the computed PTCS value (a single floating-point number) is transmitted, along with metadata: a spatially coarsened location (the centroid of the 50m × 50m grid cell containing the device, computed on-device using a deterministic geohash function), a temporally bucketed timestamp (rounded to the nearest 15-minute boundary), and device-class metadata (watch model, firmware version, not device ID or user ID).
Unlinkability: Each PTCS report is transmitted with a fresh, single-use cryptographic token generated from a group signature scheme. The aggregation server can verify that the report comes from a registered, legitimate device class without learning which specific device sent it. Sequential reports from the same device are cryptographically unlinkable, preventing trajectory reconstruction.
Differential privacy: The aggregation service applies calibrated Laplacian noise to per-cell PTCS statistics before storage or publication. The privacy budget is set at ε = 2.0 per 24-hour period, δ = 10⁻⁵, following the analysis framework of Dwork and Roth (2014). For a grid cell with n contributing reports in a 15-minute window, the added noise has standard deviation σ = (ΔS × √(2 ln(1.25/δ))) / ε, where ΔS is the sensitivity of the mean PTCS computation (bounded by 8/n, since PTCS range is [-4, +4]). With n ≥ 5, σ ≤ 5.4/n — small enough to preserve the signal while providing formal privacy guarantees.
k-anonymity threshold: No PTCS data is published for any grid cell × time window combination with fewer than k = 5 contributing devices. This prevents inference attacks in low-traffic areas where a small number of known pedestrians could be individually identified by their thermal comfort reports.
3. Graph Convolutional Network Spatial Fusion
Crowdsourced PTCS reports are inherently sparse: even in a city with 100,000 opt-in wearable users, many grid cells will have zero reports in any given 15-minute window. The system addresses this sparsity by training a graph convolutional network (GCN) to fuse the sparse crowd-reported PTCS values with dense, publicly available environmental covariates.
The graph is constructed over the city's 50m grid:
- Nodes: Each 50m × 50m grid cell is a node. Node features include: crowd-reported mean PTCS (where available, otherwise masked), satellite-derived land surface temperature from the most recent cloud-free ECOSTRESS or Landsat pass, air temperature and humidity from the nearest weather station (interpolated using inverse-distance weighting from the 3 nearest stations), building shadow fraction at the current solar angle (computed from municipal 3D building models via ray-casting), sky view factor (precomputed from LiDAR-derived digital surface models), tree canopy fraction from municipal LiDAR or NAIP aerial imagery, ground surface material classification (asphalt, concrete, grass, water) from land cover databases, and elevation and slope from DEM data.
- Edges: Adjacent grid cells (8-connectivity) are connected with edge weights encoding topographic continuity. Additional long-range edges connect cells with similar urban morphology (same building height class, same street canyon aspect ratio) to enable information transfer between structurally similar but geographically distant locations.
The GCN performs 4 rounds of message passing with attention-weighted aggregation. At cells with crowd-reported PTCS, the model learns the mapping from environmental covariates to physiological comfort; at cells without reports, it predicts PTCS from the covariates alone, anchored by nearby reported values. The result is a complete, gap-filled comfort map at 25-meter resolution (subgrid interpolation within 50m cells using building geometry and shadow patterns).
The GCN is trained on historical data from cities with high wearable penetration, where crowd-reported PTCS coverage approaches completeness, then transferred to sparser cities via domain adaptation. The model updates its weights daily using a sliding 30-day training window to capture seasonal acclimatization shifts in the population's thermal comfort response.
4. Personalized Federated Transfer Learning
Individual thermal comfort perception varies substantially across the population. Kim et al. (2018) demonstrated that personal thermal comfort models trained on individual data outperform population-average models by 20-30% in prediction accuracy, with age, sex, BMI, and acclimatization status as primary moderators.
The system personalizes the PTCS model to each user using federated transfer learning, following the architecture introduced by McMahan et al. (2017) for Federated Averaging:
- The base PTCS model (layers 1-2) is frozen after initial training on the controlled thermal chamber dataset.
- The output layer (layer 3, 16 → 1 linear projection) is fine-tuned locally on each device using the user's explicit thermal comfort votes collected via occasional prompts ("How warm do you feel right now?" — 3-point response: too cold / comfortable / too hot).
- Every 24 hours, each device computes the gradient of its local output layer update and clips it to a maximum L2 norm of 1.0. The clipped gradient is perturbed with Gaussian noise (σ = 0.5) and transmitted to the central server.
- The server aggregates gradients across all devices using secure aggregation (Bonawitz et al., 2017), updates the global output layer, and pushes the updated weights back to all devices. Individual devices then blend the global update with their local fine-tuned weights using a mixing coefficient α = 0.3 (70% local, 30% global), preserving personalization while benefiting from population-level learning.
5. Applications
- Heat-wave public health response: During extreme heat events, municipal emergency managers receive real-time maps showing which specific blocks, parks, and transit corridors are experiencing the most severe thermal stress, measured from actual human physiological response, not modeled from weather station data 10 km away. Cooling center deployment, water station placement, and targeted welfare check routing are guided by the comfort map.
- Urban planning and design evaluation: City planners compare thermal comfort maps before and after interventions (tree planting, cool pavement installation, shade structure construction) to quantify the physiological impact on pedestrians, providing evidence-based ROI for heat mitigation investments.
- Pedestrian routing: Navigation applications integrate the comfort map to offer "coolest route" options alongside fastest and shortest routes, particularly valuable for elderly pedestrians, outdoor workers, and people with heat-sensitive medical conditions.
- Outdoor event safety: Event organizers access real-time comfort data at venue locations to trigger heat safety protocols (mandatory hydration breaks, shade tent deployment, event suspension) based on actual crowd physiological response rather than ambient temperature thresholds that ignore radiant heat load, wind, and crowd metabolic heat generation.
- Building energy optimization: HVAC systems in buildings with operable facades use the outdoor comfort map to predict incoming thermal loads and pre-condition spaces, reducing energy consumption by anticipating when occupants arriving from hot exterior microclimates will need more aggressive cooling.
6. Figures Description
- Figure 1: System architecture showing the data flow from on-device PTCS computation through privacy-preserving collection to GCN spatial fusion and published comfort maps.
- Figure 2: Comparison of thermal comfort information density: (a) sparse weather station coverage (3 stations across a 15 km² urban area), (b) satellite surface temperature (70m resolution, single pass), (c) crowd-reported PTCS coverage from 50,000 opt-in users during a 15-minute window, (d) GCN-fused comfort map at 25m resolution.
- Figure 3: On-device PTCS model architecture showing four physiological input channels, personalized baseline subtraction, compact MLP inference, and privacy-preserving output encoding.
- Figure 4: Differential privacy noise analysis showing the relationship between grid cell occupancy (number of contributing devices) and PTCS estimation accuracy at ε = 2.0, demonstrating that accuracy approaches ±0.3 PTCS units (equivalent to ±1.5°C UTCI) with ≥ 20 contributing devices per cell.
Claims
- A system for real-time mapping of urban thermal comfort, comprising: a plurality of consumer wearable devices, each equipped with skin temperature, photoplethysmography, and accelerometer sensors; wherein each device computes a Physiological Thermal Comfort Score on-device from physiological thermoregulatory response data without transmitting raw sensor readings; and a central aggregation service that receives spatially coarsened, temporally bucketed PTCS reports from multiple devices and produces thermal comfort maps at street-block resolution.
- The system of claim 1, wherein the Physiological Thermal Comfort Score is computed from at least three physiological channels: skin temperature deviation from a personalized circadian baseline, PPG-derived peripheral vasomotor tone reflecting cutaneous vasodilation or vasoconstriction, and accelerometer-derived metabolic rate estimates used to deconfound exercise-generated heat from environmental thermal stress.
- The system of claim 1, further comprising an electrodermal activity channel wherein tonic skin conductance level rate-of-change is bandpass filtered (0.001-0.01 Hz) to isolate thermal sweating from emotional phasic responses, providing an additional thermal comfort signal that degrades gracefully when the EDA sensor is absent.
- The system of claim 1, wherein privacy is preserved through: on-device computation ensuring raw biometric data never leaves the device; spatial coarsening of GPS coordinates to 50-meter grid cell centroids computed on-device; temporal bucketing of timestamps to 15-minute boundaries; single-use cryptographic tokens from a group signature scheme ensuring sequential reports from the same device are unlinkable; and calibrated differential privacy noise injection (ε ≤ 2.0, δ ≤ 10⁻⁵) applied to per-cell aggregated statistics.
- The system of claim 1, wherein a minimum k-anonymity threshold of k = 5 contributing devices per grid cell per time window is enforced, and no thermal comfort data is published for cell-time combinations below this threshold.
- The system of claim 1, further comprising a graph convolutional network that fuses sparse crowd-reported PTCS values with dense environmental covariates including satellite-derived surface temperature, weather station interpolations, building shadow fractions computed from 3D city models, sky view factors from LiDAR, and tree canopy fractions, to produce gap-filled continuous thermal comfort maps at 25-meter resolution.
- The system of claim 6, wherein the graph convolutional network constructs a graph over 50-meter grid cells with 8-connectivity adjacency edges and additional long-range edges connecting cells with similar urban morphology, enabling information transfer between structurally similar but geographically distant locations.
- A method for personalizing thermal comfort estimation on a wearable device, comprising: establishing a personalized physiological baseline during an initial wear period; computing deviations from the baseline rather than using absolute sensor values; fine-tuning the output layer of an on-device PTCS model using the wearer's explicit thermal comfort votes; and participating in federated transfer learning by transmitting clipped, noise-perturbed gradients to a central server for secure aggregation, while retaining majority local weight (α ≥ 0.7) to preserve individual personalization.
- A method for urban heat-wave response using the system of claim 1, comprising: receiving real-time thermal comfort maps showing physiologically-measured heat stress at street-block resolution; identifying blocks where crowd-reported PTCS exceeds a heat stress threshold despite ambient temperature at the nearest weather station remaining below municipal heat emergency triggers; and directing emergency response resources to the physiologically-identified hotspots.
- The system of claim 1, wherein the on-device PTCS model is a compact neural network (≤ 20 KB quantized INT8) with inference latency under 5 ms, enabling continuous computation at 1 Hz sample rate with negligible impact on wearable battery life (under 2% additional daily drain).
- A method for evaluating urban heat mitigation interventions using the system of claim 1, comprising: collecting pre-intervention thermal comfort maps from crowd-reported physiological data; collecting post-intervention maps after installation of trees, shade structures, cool pavements, or other heat mitigation measures; and quantifying the physiological comfort impact as the change in mean PTCS at affected grid cells, controlling for weather variation using paired unaffected control cells.
Prior Art References
- Lancet Countdown 2024 — Heat-related mortality increase of 167% among adults over 65 (2000-2023)
- CDC Heat-Related Deaths — Average 1,220 heat-related deaths annually in the US
- Universal Thermal Climate Index (UTCI) — ISB standard for outdoor thermal comfort assessment
- Gallacher and Boehnke, Int J Biometeorol 2024 — Pedestrian thermal comfort mapping in Dresden showing 12°C UTCI variation within 200m
- Bröde et al., Int J Biometeorol 2012 — UTCI development and validation as thermal comfort index
- Sim et al., Scientific Reports 2014 — Wearable sweat rate sensors for human thermal comfort monitoring
- Charkoudian, J Appl Physiol 2010 — Skin blood flow in adult human thermoregulation: 300 mL/min resting to 7-8 L/min maximal
- Kim et al., Building and Environment 2018 — Personal thermal comfort models outperform population-average models by 20-30%
- Dwork and Roth, Foundations and Trends in Theoretical Computer Science 2014 — The Algorithmic Foundations of Differential Privacy
- McMahan et al., 2017 — Communication-Efficient Learning of Deep Networks from Decentralized Data (Federated Averaging)
- IDC Worldwide Quarterly Wearable Device Tracker — 220M+ annual smartwatch shipments
- Voogt and Oke, Remote Sensing of Environment 2003 — Surface-air temperature divergence in urban canyons (8-20°C overestimation)
- MesoWest — Real-time mesoscale weather observation network