System and Method for Automated Detection and Population Estimation of Rodent Infestations Using Distributed Ultrasonic MEMS Microphone Arrays with On-Device Machine Learning Classification of Species-Specific Vocalization, Gnawing, and Locomotion Signatures
Abstract
Disclosed is a system and method for automated, continuous detection and population estimation of rodent infestations in residential and commercial structures. The system deploys distributed arrays of ultrasonic-bandwidth MEMS microphones (flat frequency response from 1 kHz to 80 kHz) at strategic interior locations including wall cavities, ceiling plenums, crawl spaces, and utility penetrations. Each sensor node runs an on-device temporal convolutional network (TCN) classifier trained to distinguish three categories of rodent acoustic emissions: ultrasonic vocalizations (USVs) in the 22-80 kHz range that are species-specific and behaviorally informative, broadband gnawing signatures with characteristic spectral peaks between 5-30 kHz, and substrate-coupled locomotion vibrations in the 0.5-10 kHz range whose temporal cadence encodes gait and body mass. The classifier differentiates Mus musculus (house mouse), Rattus norvegicus (Norway rat), and Rattus rattus (roof rat) with target accuracy exceeding 90% per species. A population estimation module applies mark-recapture statistical models to individual vocalization fingerprints, estimating colony size without physical trapping. Spatial activity heatmaps and temporal trend analysis enable targeted intervention and treatment efficacy verification. The system integrates with pest management provider APIs for automated service dispatch and regulatory compliance reporting.
Field of the Invention
This invention relates to integrated pest management, specifically to automated monitoring and quantification of rodent infestations using passive ultrasonic acoustic sensing, edge machine learning, and statistical population estimation methods.
Background
Rodent infestations cause an estimated $19 billion in structural damage annually in the United States alone (CDC estimates). Rodents contaminate approximately 20% of the global food supply (WHO) and serve as vectors for over 35 diseases including hantavirus, leptospirosis, and salmonellosis. The National Pest Management Association reports that 29% of American households have experienced a rodent problem, yet most infestations are detected only after significant population establishment when visible signs (droppings, gnaw marks, grease trails) become apparent.
Current rodent detection methods have fundamental limitations:
- Snap traps and glue boards: Reactive, not preventive. Require physical inspection on a 24-48 hour cycle. Capture rate provides no reliable population estimate because trap-shy individuals avoid them. A single Norway rat colony of 8-12 individuals may yield only 1-2 captures per week.
- Visual inspection: Professional pest inspectors survey for droppings, rub marks, gnaw damage, and nesting material. Highly subjective. Corrigan (2011) documented inter-inspector agreement rates below 60% for infestation severity classification. Inspections occur monthly at best, missing rapid population growth between visits.
- Electronic monitoring traps: Products like Anticimex SMART and Rentokil PestConnect use connected snap traps that report captures via cellular. These improve response time but remain capture-dependent and cannot estimate uncaptured population. Unit cost: $150-400 per station plus $20-40/month cellular fees.
- Passive infrared (PIR) sensors: Detect motion from body heat but cannot distinguish rodents from other small animals, insects, or HVAC-induced air currents. Murphy et al. (2021) reported false positive rates above 40% in commercial kitchen environments.
Critically, all existing methods share a blind spot: they detect the consequences of rodent presence rather than the rodents themselves. Rodents produce rich acoustic signatures that are largely inaudible to humans. Laboratory research has extensively characterized rodent ultrasonic vocalizations. Brudzynski (2009) documented that adult rats produce two classes of USVs: 22 kHz "alarm" calls (flat, 300-3,400 ms duration) emitted during aversive situations and 50 kHz "positive" calls (frequency-modulated, 10-150 ms, often with rapid upsweeps to 70+ kHz) emitted during social and appetitive behavior. Holy and Guo (2005) discovered that male mice produce complex ultrasonic songs in the 65-80 kHz range with syllable structure analogous to birdsong. Portfors (2007) cataloged species-specific USV repertoires that enable acoustic species identification. No commercial pest detection system exploits this acoustic information.
The gap: a passive, continuous monitoring system that detects rodents via their own acoustic emissions, classifies species, estimates population size, and tracks activity patterns without requiring capture or physical inspection.
Detailed Description
1. Ultrasonic Sensor Node Hardware
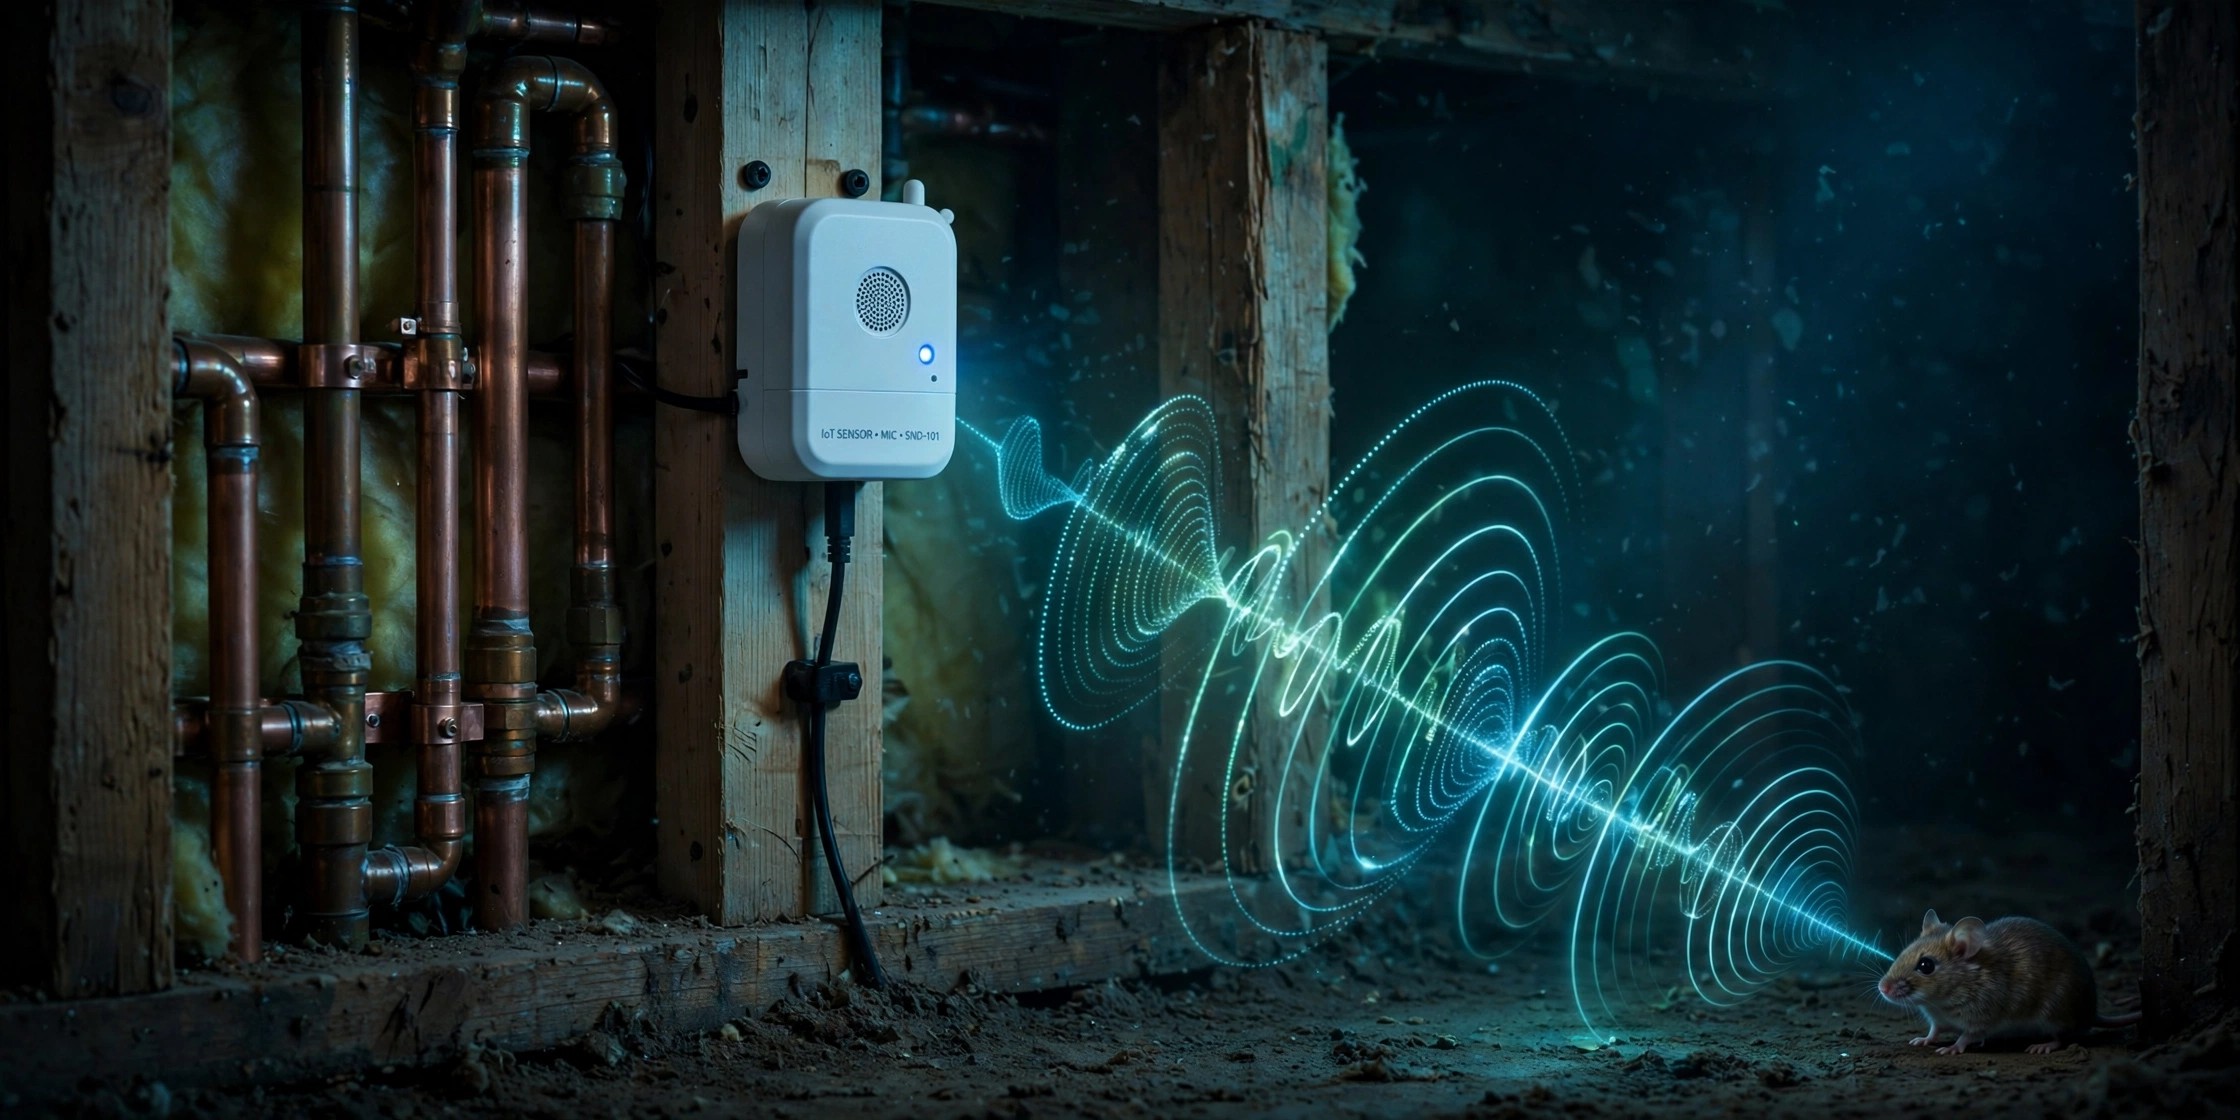
Each sensor node comprises: an ultrasonic-bandwidth MEMS microphone (e.g., Knowles SPU0414HR5H-SB, sensitivity -42 dBV/Pa at 1 kHz, flat response ±3 dB from 10 kHz to 65 kHz, usable to 80 kHz at -6 dB, unit cost $2.80) with omnidirectional pickup pattern; a microcontroller with DSP capability (e.g., Nordic nRF5340 with dual Arm Cortex-M33 cores, 1 MB flash, 512 KB RAM, integrated BLE 5.3, unit cost $4.50); low-power amplifier and anti-aliasing filter with 80 kHz cutoff; 2× AAA lithium batteries (3,000 mAh total at 3V) providing approximately 18 months of continuous operation at 5% duty cycle; and a compact injection-molded enclosure (38×28×15 mm) designed for mounting inside electrical junction boxes, behind outlet covers, or within ceiling tile frames. Target bill-of-materials cost per node: $18-28.
An optional three-microphone variant (3× MEMS elements in a 25 mm equilateral triangle arrangement) enables acoustic beamforming for angular source localization with approximately ±15° resolution at 40 kHz.
2. Audio Acquisition and Preprocessing
The MEMS microphone feeds a 12-bit ADC sampling at 192 kHz (Nyquist frequency: 96 kHz, comfortably above the 80 kHz upper bound of rodent USVs). Audio is processed in 500 ms frames with 50% overlap. Each frame undergoes a preprocessing pipeline: high-pass filtering at 500 Hz to reject low-frequency building vibration and HVAC rumble; adaptive noise floor estimation using a minimum statistics approach (Martin, 2001) updated every 10 seconds; spectral subtraction to remove stationary noise components (ventilation fans, refrigerator compressors, electronic hum); and computation of a 128-bin mel-frequency spectrogram using a 2048-point FFT with Hann windowing, with mel filter bank extended to 80 kHz (standard mel-scale implementations cap at 8 kHz and must be modified for ultrasonic coverage).
A two-stage detection gate conserves power. Stage 1: a simple energy detector monitors RMS power in three bands (1-10 kHz, 10-30 kHz, 30-80 kHz) at all times, consuming less than 50 µA. Stage 2: when any band exceeds the adaptive noise floor by 12 dB, the full preprocessing pipeline and classifier activate for a 5-second analysis window. Duty cycling between stages extends battery life from weeks to 18+ months.
3. On-Device Species and Activity Classification
A temporal convolutional network (TCN) processes the extended mel-spectrogram. Architecture: 4 dilated causal convolutional layers (dilation factors 1, 2, 4, 8) with 32 filters per layer, 3×1 kernels, residual connections, and layer normalization. The network captures both spectral structure and temporal dynamics across the 500 ms frame. Quantized to INT8 via post-training quantization, the model occupies 94 KB of flash. Inference time: 35 ms per frame on the nRF5340 at 128 MHz.
The classifier outputs probability vectors over nine classes:
- Mouse USV (Mus musculus): Frequency-modulated calls at 65-80 kHz, syllable duration 5-40 ms, often in bouts of 50-200 syllables. Male courtship songs exhibit complex syllable ordering with at least four distinct syllable types (Holy and Guo, 2005).
- Rat 22 kHz alarm call (Rattus spp.): Flat-contour calls at 20-24 kHz, long duration (300-3,400 ms), produced during threat detection and social defeat.
- Rat 50 kHz positive call (Rattus spp.): Frequency-modulated calls at 35-70 kHz, short duration (10-150 ms), produced during exploration, play, food discovery, and mating.
- Norway rat locomotion: Substrate-coupled footfall vibrations at 2-8 kHz with characteristic quadrupedal gait cadence (4-6 Hz stride frequency for a 250-500 g animal).
- Roof rat locomotion: Lighter footfall pattern (150-250 g body mass), higher stride frequency (5-8 Hz), often with rapid vertical displacement signatures (climbing behavior).
- Mouse locomotion: Very light footfalls (15-30 g), high stride frequency (8-12 Hz), with distinctive rapid scurrying bursts.
- Gnawing (rodent generic): Broadband impulse trains at 5-30 kHz, repetition rate 4-8 Hz (incisor strike frequency), with spectral envelope shaped by substrate material (wood, plastic, drywall, wire insulation each produce distinguishable spectra).
- Non-target ultrasonic source: HVAC ultrasonic leaks, electronic device emissions (CRT flybacks, LED drivers, ultrasonic humidifiers), insect stridulation, bat echolocation.
- Background / no activity: Ambient conditions below detection threshold.
Species-level differentiation between Rattus norvegicus and Rattus rattus relies on a secondary classifier analyzing locomotion gait parameters (stride frequency, footfall impulse amplitude, vertical activity ratio) rather than USV frequency alone, since USV frequency ranges overlap between the two species.
4. Individual Identification and Population Estimation
A key novel feature: individual rodent identification from USV voiceprints. Arriaga et al. (2012) demonstrated that individual mice produce USV songs with consistent spectral and temporal features that enable individual discrimination. The system extracts a 64-dimensional embedding vector from each detected USV bout using a contrastive learning approach (triplet loss training on synthetic augmentations of detected USVs). Embeddings that cluster within a learned similarity threshold are assigned to the same individual.
Population estimation applies a Bayesian capture-recapture framework adapted from ecological monitoring. Each unique voiceprint "captured" acoustically at a sensor node constitutes a capture event. The Jolly-Seber open population model (which accounts for births, deaths, and immigration) computes a maximum-likelihood population estimate from the capture history matrix across all nodes and time periods. Confidence intervals are computed via Markov chain Monte Carlo (MCMC) sampling. The system reports both point estimates and posterior distributions, enabling statements like: "This structure contains an estimated 12-18 mice (95% CI) with 3-5 new individuals detected in the past 7 days."
5. Spatial Activity Mapping and Temporal Analysis
Detection events from all nodes are aggregated via BLE mesh networking (Bluetooth Mesh profile, flooding-based relay). A gateway device (Raspberry Pi Zero 2 W or equivalent, $15) receives mesh data and runs the population estimation and spatial analysis modules.
Spatial features include: per-node activity density heatmaps overlaid on user-provided floor plans; entry point identification from nodes that first detect new individual voiceprints; nest location inference from sustained 50 kHz calling clusters (which indicate social aggregation); runway identification from correlated locomotion detections across adjacent nodes; and food source identification from gnawing event clusters.
Temporal features include: circadian activity profiles (rodents are predominantly nocturnal, with peak activity 2-4 hours after sunset and 1-2 hours before dawn); seasonal trend analysis (breeding season detection from increased 50 kHz courtship USVs and new juvenile voiceprints); treatment efficacy curves (population estimate trend pre/post intervention); and activity anomaly alerts (sudden population increase, new species detection, or daytime activity indicating population pressure).
6. Integration and Reporting
The gateway exposes a local REST API and connects to an optional cloud service. Integrations include: pest management provider dispatch APIs (ServicePro, PestPac, PestRoutes) for automated service request generation when population estimates exceed configurable thresholds; regulatory compliance reporting (FDA 21 CFR 117 for food facilities, local health department requirements) with audit-ready activity logs; smart home integration via MQTT/Matter for alert routing to existing home automation systems; and a mobile application for homeowners showing real-time activity status, population trend charts, and sensor health monitoring.
The system generates a Rodent Activity Index (RAI) on a 0-100 scale that normalizes across structure size, sensor density, and seasonal baselines. An RAI below 5 indicates no detectable activity. RAI 5-25 indicates early-stage intrusion (1-3 individuals). RAI 25-60 indicates established presence requiring professional intervention. RAI above 60 indicates severe infestation.
7. Figures Description
- Figure 1: System architecture showing sensor node placement at wall penetrations, ceiling plenum access points, and utility chases, with BLE mesh communication links and gateway aggregation.
- Figure 2: Spectrograms of the nine classification targets showing species-specific USV frequency contours, gnawing impulse patterns, and locomotion gait cadences for Mus musculus, Rattus norvegicus, and Rattus rattus.
- Figure 3: Population estimation workflow from raw USV detections through voiceprint embedding extraction, individual clustering, capture history matrix construction, and Jolly-Seber model output with posterior confidence intervals.
- Figure 4: Example spatial activity heatmap overlaid on a commercial kitchen floor plan, showing identified entry points (red), runway corridors (orange), suspected nest locations (purple), and gnawing hotspots (yellow).
Claims
- A system for automated detection of rodent activity in a structure, comprising: a distributed network of sensor nodes, each containing at least one MEMS microphone with frequency response extending to at least 65 kHz, a microcontroller with on-device inference capability, and a wireless communication module; wherein each node continuously acquires audio, computes extended-range mel-frequency spectrograms covering the ultrasonic band, and classifies rodent acoustic emissions using an on-device temporal convolutional network trained on species-specific ultrasonic vocalization, gnawing, and locomotion signatures.
- The system of claim 1, wherein the classifier distinguishes at least three rodent species (Mus musculus, Rattus norvegicus, Rattus rattus) based on ultrasonic vocalization frequency ranges, with mouse USVs identified at 65-80 kHz, rat alarm calls at 20-24 kHz, and rat positive calls at 35-70 kHz.
- The system of claim 1, further comprising a population estimation module that extracts individual voiceprint embeddings from detected ultrasonic vocalization bouts and applies a capture-recapture statistical model to estimate colony size without physical trapping.
- The system of claim 3, wherein voiceprint embeddings are computed using a contrastive learning model producing fixed-dimensional embedding vectors, and individual identity is determined by clustering embeddings within a learned similarity threshold.
- The system of claim 3, wherein the capture-recapture model is a Bayesian open-population model (Jolly-Seber or equivalent) that accounts for births, deaths, and immigration, and reports both point estimates and posterior confidence intervals for population size.
- The system of claim 1, further comprising a two-stage power management system wherein a first stage monitors energy in ultrasonic frequency bands at low power consumption and a second stage activates full spectral analysis and classification only when the first stage detects energy exceeding an adaptive noise floor threshold.
- The system of claim 1, wherein sensor nodes communicate via Bluetooth Low Energy mesh networking and aggregate detection data at a gateway device that computes spatial activity heatmaps, entry point identification, nest location inference, and runway mapping from correlated detection events across adjacent nodes.
- A method for estimating rodent population size in a structure without physical capture, comprising: deploying ultrasonic-bandwidth microphone sensors at multiple locations; detecting and classifying species-specific ultrasonic vocalizations using on-device machine learning; extracting voiceprint embeddings from individual vocalization bouts; constructing a capture history matrix from unique voiceprint detections across sensors and time periods; and computing a maximum-likelihood population estimate using an open-population capture-recapture model with posterior confidence intervals.
- The method of claim 8, further comprising treatment efficacy verification by computing population estimate trend curves before and after pest management intervention and generating an efficacy report showing percentage population reduction with statistical confidence.
- The system of claim 1, wherein gnawing event classification further identifies the substrate material being gnawed (wood, plastic, drywall, wire insulation) based on spectral envelope characteristics of the broadband gnawing impulse signature, enabling prioritized alerts for safety-critical gnawing (electrical wiring, gas lines).
- The system of claim 1, further comprising a Rodent Activity Index (RAI) that normalizes detection events across structure size, sensor density, and seasonal baselines to produce a 0-100 severity score with defined thresholds for early-stage intrusion, established presence, and severe infestation.
Implementation Notes
The primary technical challenge is extending MEMS microphone-based classification to the 65-80 kHz range required for mouse USV detection. While the Knowles SPU0414HR5H-SB is specified to 80 kHz, its sensitivity drops approximately 6 dB above 65 kHz, requiring either a higher-gain amplifier stage (increasing power consumption by approximately 15%) or acceptance of reduced detection range (estimated 2 m at 70 kHz versus 5 m at 40 kHz for rat calls). A production system should characterize microphone sensitivity roll-off per unit and apply frequency-dependent gain correction in the preprocessing stage.
Individual voiceprint stability is a known limitation. Arriaga et al. (2012) demonstrated USV individuality in controlled laboratory conditions with high-quality directional microphones. In field deployments with lower SNR and multiple simultaneous vocalizers, voiceprint discrimination accuracy will degrade. The population estimation module should account for this by incorporating a voiceprint confusion probability parameter in the capture-recapture model. Conservative settings will undercount population by merging distinct individuals; aggressive settings will overcount by splitting single individuals. Cross-validation against physical trapping data during calibration deployments will establish appropriate thresholds.
For commercial kitchen and food facility deployments, the system must comply with FDA 21 CFR 117 requirements for pest monitoring in Hazard Analysis and Critical Control Points (HACCP) plans. The system's continuous monitoring and automated reporting directly addresses the FDA's requirement for "monitoring procedures to provide assurance that controls are being applied consistently" and produces audit-ready logs that exceed the documentation standards of manual inspection protocols.
Prior Art References
- CDC Rodent Control: Rodent-borne disease transmission and structural damage statistics
- WHO Food Safety Fact Sheet: Rodent contamination of global food supply
- Brudzynski (2009): Communication of adult rats by ultrasonic vocalization, Behavioural Brain Research
- Holy and Guo (2005): Ultrasonic songs of male mice, PLoS Biology
- Portfors (2007): Types and functions of ultrasonic vocalizations in laboratory rats and mice, JASA
- Arriaga et al. (2012): Individual mouse USV discrimination via vocal learning analysis, Current Biology
- Corrigan (2011): Rodent pest management practices survey, Journal of Medical Entomology
- Murphy et al. (2021): Evaluation of electronic monitoring for rodent activity, Journal of Medical Entomology
- Knowles SPU0414HR5H-SB: Ultrasonic MEMS microphone datasheet (10 Hz-80 kHz response)
- Nordic nRF5340: Dual-core Arm Cortex-M33 SoC with BLE 5.3
- Bluetooth Mesh Specification: BLE mesh networking protocol
- FDA 21 CFR 117: Current Good Manufacturing Practice for food facilities