System and Method for Estimating Tree Windthrow Failure Risk from Smartphone Video-Derived Sway Dynamics
Abstract
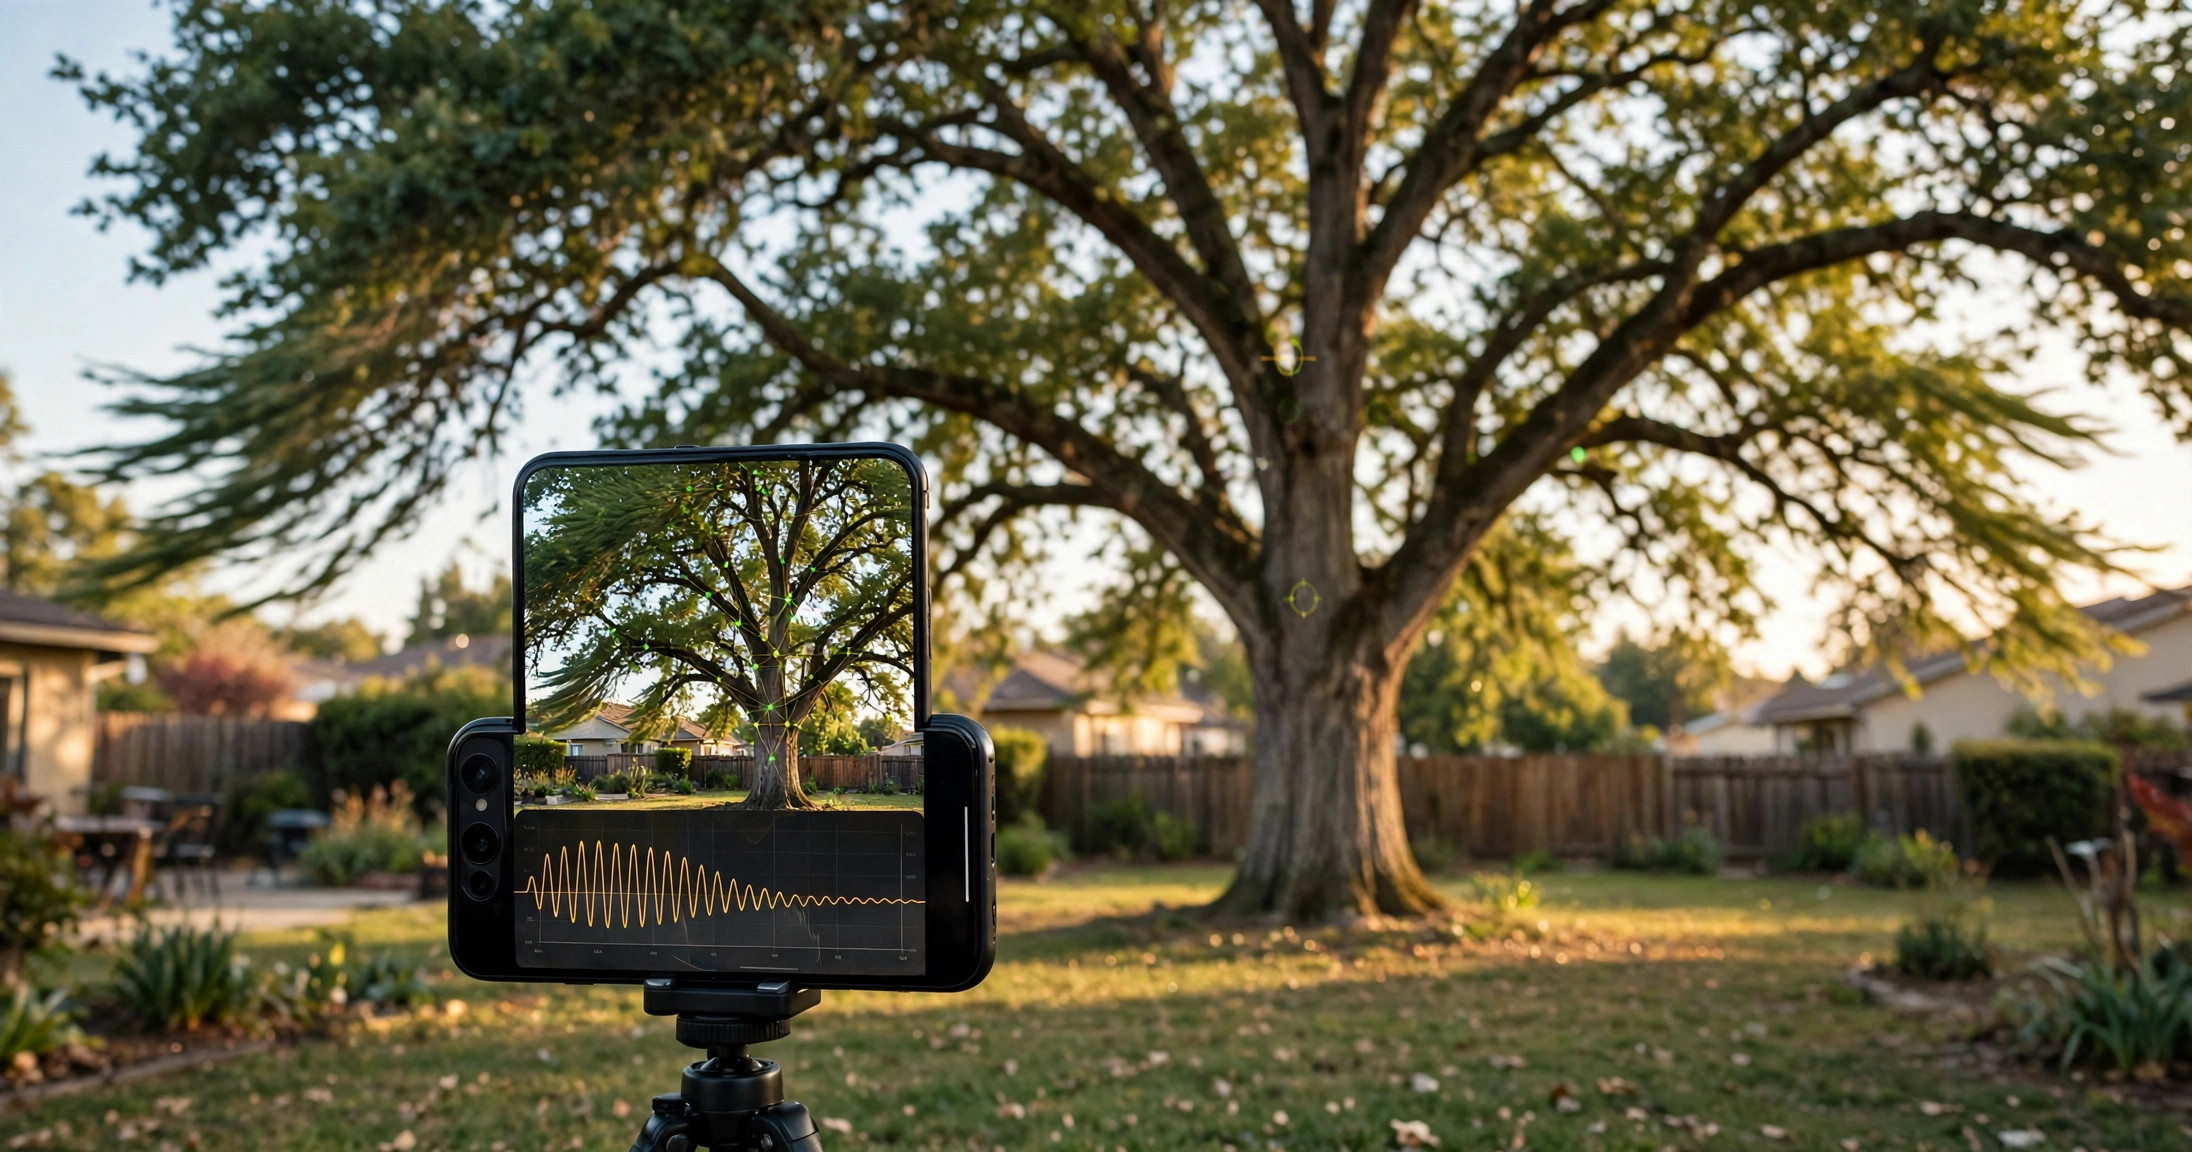
Your phone can tell which tree is likely to fall in the next storm. A consumer smartphone, mounted on a tripod at a measured distance, records high-frame-rate video (60 to 240 fps) of a tree in ambient wind, or during a guided pull-and-release free-decay test performed in calm air. Computer vision tracks trunk and crown displacement with sub-pixel accuracy, correcting for camera shake using static background references. System identification extracts the tree's first-mode natural frequency and damping ratio: the logarithmic decrement on free-decay records, and the spectral peak plus half-power bandwidth on ambient-wind records.
Wind loading is estimated by fusing local wind measurements with crown sail area segmented from the same video. The measured dynamics carry structural meaning: because natural frequency scales with the square root of stiffness at constant mass, a measured frequency 20% below the species-size expectation means roughly 36% of the tree's bending stiffness is gone. Species-specific failure envelopes, calibrated per species, diameter at breast height (DBH), height, crown ratio, soil class, lean, and defect priors, convert the measured dynamic stiffness into a critical wind speed for stem breakage and for uprooting. The residual margin between expected site design-storm gusts and the critical wind speed yields a failure probability, multiplied by a consequence rating for nearby targets to produce a triage score.
Repeated measurements over seasons track drift in natural frequency and damping as an early indicator of internal decay, root damage, or structural compromise before visible symptoms appear. Post-storm outcomes of measured trees feed back into the species envelopes through Bayesian updating, so the system improves with each storm. The system runs on consumer hardware with no tree contact and no specialist operator, serving homeowners, arborists, municipal tree inventories, and property insurers.
Technical Field
This invention relates to structural health monitoring of trees, specifically to consumer-deployable, non-contact estimation of windthrow failure risk using smartphone video-derived sway dynamics, guided free-decay testing, wind load fusion, and species-specific failure envelopes, with longitudinal drift tracking for early detection of internal decay and root damage.
Background
Windthrow, the uprooting or stem breakage of trees under wind load, damages homes, vehicles, and power lines, blocks roads, and causes injuries every storm season. The scale is large: damage to trees from severe weather accounts for more than $1 billion in U.S. property damage each year, according to the National Storm Damage Center, and a single storm concentrates the losses. After Hurricane Ike, over half of the 100,000-plus claims filed in Ohio were attributed to fallen trees, roughly $300 million in tree-failure damage in one state from one storm, per the Ohio Insurance Institute. Industry analyses put the annual U.S. insurance loss from fallen trees and limbs conservatively in the hundreds of millions of dollars. The economic question is always the same: which tree fails next, and how much confidence anyone can place in the answer.
Current assessment practice cannot answer it quantitatively at scale:
- Visual Tree Assessment (VTA): The arborist industry standard (Mattheck and Breloer) is a trained visual inspection for defects such as cavities, fungal fruiting bodies, lean, and root-plate lifting. It is subjective, depends heavily on inspector experience, and cannot quantify residual structural capacity. A tree can look healthy while harboring extensive internal decay.
- Resistograph drilling: A thin drill bit measures wood resistance along a radial path to map internal decay. It is invasive (it wounds the tree, creating an entry point for the pathogens it seeks) and samples only a single line through the stem.
- Sonic tomography (e.g., Arbotom): Multiple sensors around the trunk map internal sound velocity to image decay. Equipment costs thousands of dollars, requires a trained operator, and measures a single cross-section at sensor height.
- Instrumented pull tests: A winch applies a measured load while inclinometers and elastometers record trunk tilt and root-plate rotation, producing a tipping curve extrapolated to failure. This is the gold standard for quantifying stability, but it requires specialist equipment and crew, costs hundreds to thousands of dollars per tree, manages roughly 3 to 6 trees per rig per day, and cannot scale to the millions of urban trees near targets.
That a tree's sway carries structural information is well established. A tree is a damped oscillator: its natural frequency rises with the square root of stiffness and falls with the square root of mass, so internal decay and root damage that reduce stiffness lower the sway frequency. Damping shifts with the character of the damage, and the combination of falling frequency with rising damping is the classic signature of internal hollowing. Researchers have demonstrated that video can replace contact sensors for measuring this motion. A University of Washington study showed that video processing reproduces accelerometer-derived tree sway frequencies to within ±0.03 Hz against measured baselines of 0.25 to 0.5 Hz, a relative agreement of roughly 6 to 12%, and explicitly suggested the method could identify trees vulnerable to windthrow. Wang et al. (2022, Forests) tracked a single 23.2-meter birch in 30-minute video samples and recovered a fundamental sway frequency of 0.26 to 0.28 Hz (one full sway every 3.6 to 3.8 seconds), matching accelerometer and pulling-test results on that same tree. Ammatelli and collaborators (2025, Agricultural and Forest Meteorology) validated video-derived sway frequency as a biomarker of tree hydration and overall health, proposing it as an early indicator of drought stress before wildfire ignition. Separately, the WTW Research Network "Seeing extreme winds" project (2024) uses video analytics of tree and flag motion to estimate local wind speed from everyday cameras, demonstrating that the inverse problem (motion to wind) is tractable with machine vision.
No published system known to the disclosers combines guided consumer video capture, sub-pixel motion extraction with camera-shake correction, damping ratio as well as frequency from a guided free-decay test, wind load fusion with crown geometry from the same video, species-specific critical wind speed envelopes for both breakage and uprooting failure modes, a failure probability for a design storm, consequence-weighted triage, and longitudinal drift tracking. Pull tests measure stability with expensive rigs; video research measures frequency for science. The gap in the art is a complete system that packages this physics into a consumer phone application reporting windthrow failure risk to homeowners, arborists, city foresters, and insurers. Scope of validity: the method estimates the stiffness-margin component of windthrow risk. It does not predict storm outcomes, which also depend on root-soil interaction, canopy coupling, and turbulence that no video measurement captures.
Detailed Description
1. Guided Capture Protocol
A mobile application guides a non-specialist user through a ten-minute measurement. The phone is mounted on a tripod or other stable support at a distance of 0.5 to 1.5 times the tree height, with the full tree and a margin of static background (buildings, fence posts, distant trees) in frame. The app records the phone-to-tree distance using the phone's AR depth measurement, a laser rangefinder accessory, or a manual tape entry, because pixel-to-meter scaling of displacement depends on distance and focal length. The app verifies stability by measuring background-feature drift in a 5-second pre-roll and rejects the setup if camera motion exceeds a threshold, prompting the user to stabilize or relocate the tripod.
Two measurement modes are offered. In ambient mode, the app records 2 to 5 minutes of video at 60 fps or higher during breezy conditions (sustained wind above roughly 3 m/s, confirmed by the wind source in section 4), capturing the tree's response to natural excitation. In free-decay mode, performed in calm air (wind below roughly 1.5 m/s), the app guides a pull-and-release test: a rope is attached at approximately two-thirds of tree height, pulled laterally to a marked displacement target of 2 to 5 cm at attachment height (a displacement far below any damage threshold), and released on the app's countdown while the phone records at 120 to 240 fps. The frame rate is set high relative to the sub-Hz sway signal deliberately: 120 fps yields about 80 samples per oscillation cycle at 1.5 Hz, resolving the decay envelope finely enough for logarithmic-decrement fitting and improving sub-pixel optical-flow accuracy.
Safety interlocks govern the pull test. The app refuses the test for trees with severe visible defects (large cavities, advanced fungal fruiting, pronounced lean with recent soil lifting). A second person must be present; the puller stands clear of the rope line and the test zone is kept clear of people and property. Pull force is capped by an inline spring scale or a breakaway link rated below a safe force threshold, rather than by operator judgment, and the app guides the pull to the marked displacement target rather than a force target. The 2 to 5 cm pull displacement is roughly an order of magnitude below the tens-of-centimeters trunk deflection of a standard instrumented pull test. Users are advised that the test involves physical activity with inherent risk, that they assume that risk, and that trees with any doubt about stability should be assessed by a certified arborist instead.
2. Sub-Pixel Motion Tracking with Camera-Shake Correction
Each video frame is processed on-device or in the cloud to extract displacement time series at multiple heights. The pipeline: (a) automatic landmark selection, identifying high-contrast trackable features on the trunk (bark texture patches, branch stubs) and in the crown (branch junctions) via a corner/edge detector, with the user able to tap to add landmarks; (b) sub-pixel tracking using phase-based optical flow or normalized cross-correlation with parabolic peak interpolation, achieving approximately 0.1-pixel displacement resolution. As a worked example: at a 20 m standoff with a 20 m tree filling two-thirds of a 1080p frame, one pixel spans roughly 2 cm, so 0.1-pixel tracking resolves about 2 mm of trunk motion, a thousand times smaller than the pull-test displacement; (c) camera-shake correction, in which displacement of static background features (building corners, fence posts) is tracked identically and subtracted from tree-landmark displacement, removing tripod vibration and wind buffeting of the phone itself; (d) pixel-to-meter conversion using the recorded distance, focal length, and sensor geometry, producing trunk displacement in centimeters at each tracked height.
For low-contrast trunks (smooth bark, poor light), the app offers a motion magnification preview that amplifies subtle sway for landmark placement, and a stick-on retroreflective marker option (a 2 cm adhesive dot, the only tree contact in the system) that provides a high-contrast tracking target without penetrating bark.
3. Modal Parameter Extraction
From the displacement time series, the system performs operational modal analysis:
- Natural frequency: In free-decay mode, the dominant frequency of the decaying oscillation. In ambient mode, the peak of the power spectral density (Welch's method) of trunk displacement, cross-validated against a wavelet ridge estimate to reject spurious peaks from gust periodicity. Typical first-mode frequencies run 0.2 to 1.5 Hz for urban broadleaf trees (one sway every 5 seconds down to two-thirds of a second), with tall conifers at or below the low end of that range.
- Damping ratio: In free-decay mode, the logarithmic decrement fitted to successive oscillation peaks, the cleanest damping estimate available without contact sensors, and the authoritative damping source for the system. In ambient mode, the half-power bandwidth of the spectral peak, reported with a widened uncertainty bound: ambient damping estimates carry an upward bias because the wind gust spectrum is strongly colored rather than white, violating the white-noise excitation assumption behind half-power bandwidth.
- Mode separation: Trunk landmarks and crown landmarks are analyzed separately. The trunk first bending mode is the structural mode of interest for uprooting and stem failure; crown modes at higher frequencies, which shift with leaf-on versus leaf-off mass, are reported separately and used to constrain (not precisely measure) crown mass as an order-of-magnitude input to the sail-area load model.
- Quality flags: Each measurement carries a signal-to-noise ratio, a coherence score between trunk landmarks (a real structural mode moves landmarks in phase; noise does not), and an excitation sufficiency flag. Measurements failing quality gates are discarded with guidance to re-shoot in better wind or calmer air as appropriate.
The measured first-mode frequency is compared against a species-size expectation: an empirical distribution (not a single value) predicting natural frequency from species, DBH, and height for healthy trees, built from the system's growing measurement database and published values. A measured frequency significantly below expectation, after correcting for leaf state and soil moisture per section 6, indicates reduced stiffness and triggers the guided visual defect survey described in section 5.
4. Wind Load Estimation
Failure risk requires load as well as capacity. The system estimates the gust overturning moment at the stem base:
- Crown sail area: A segmentation model outlines the crown in a still frame from the video, computing projected crown area. Combined with height and crown depth from the same image (scaled by the distance measurement), this yields the aerodynamic area. Porosity is estimated from a crown density classifier (dense, moderate, sparse) trained on labeled images, since a porous crown spills wind that a solid sail would catch.
- Wind input: A hierarchy of sources, best available wins: a Bluetooth ultrasonic anemometer placed at the site (the app recommends a sub-$100 unit); or a nearby weather station via API, corrected for local roughness and sheltering with a logarithmic wind-profile adjustment. During ambient-mode capture, the app records synchronized wind speed so that measured sway amplitude can be normalized per unit wind, a rough comparative stiffness indicator across trees in the same gust regime (with the caveat that amplitude also depends on damping, gust spectral content, and aerodynamic admittance, so it corroborates rather than replaces the frequency-based estimate).
- Overturning moment: Drag force from the standard aerodynamic relation (one-half air density times drag coefficient times area times velocity squared), applied at the crown pressure center height, gives the base overturning moment for a stated gust speed. The app reports the moment for both the measured gust regime and the site design storm (e.g., the ASCE 7 basic wind speed for the address).
5. Species-Specific Failure Envelopes
The measured dynamics are converted to a failure probability through species-specific envelopes that encode the two windthrow failure modes:
- Stem breakage: The critical wind speed at which bending stress at the weakest stem section exceeds the species' modulus of rupture, derated for measured defects. The measured natural frequency constrains the effective stem stiffness (EI): for a tapered cantilever of known geometry, frequency maps to stiffness, and stiffness maps to the bending moment capacity via the section modulus. A tree whose measured frequency is 20% below its species-size expectation has lost roughly 36% of its bending stiffness (frequency scales with the square root of stiffness at constant mass, and 0.8 squared is 0.64), and its breakage wind speed is derated accordingly.
- Uprooting: The critical wind speed for root-plate overturning, modeled from species root architecture class (taproot, heart-root, plate-root), soil class (from USDA soil survey data by address or user entry: clay, loam, sand, shallow-to-bedrock), soil moisture state, and rooting-space constraint (tree pit volume, nearby trenching, pavement). Plate-rooted species in saturated clay with constrained pits receive the lowest uprooting thresholds.
- Defect priors: The app's guided visual survey (lean angle via phone inclinometer, cavity openings, fungal fruiting bodies, recent trenching, grade changes, co-dominant stems with included bark) feeds multiplicative derate factors drawn from arboricultural literature, the same factors a VTA inspector applies qualitatively, here applied quantitatively to the critical wind speed. Modal parameters are global properties of the whole tree: a localized defect such as a co-dominant stem with included bark or a root-plate void can leave the first-mode frequency nearly unchanged while still controlling the failure. The visual-survey priors carry that part of the risk. The two channels are complementary, and a near-normal measured frequency does not clear a tree with known local defects.
- Calibration: Envelopes are calibrated against post-storm damage surveys: for every measured tree later exposed to a known gust event, the outcome (stood, failed, failure mode) updates the species envelope via Bayesian updating. The calibration loop needs thousands of measured-tree-by-storm-outcome pairs per species before envelopes are trustworthy, a years-long bootstrap; pre-calibration outputs ship with wide confidence intervals that narrow as outcomes accumulate.
6. Longitudinal Drift Tracking
The system's primary value is the trend across measurements, which reveals decay, root damage, or structural compromise long before any single score could. The app prompts re-measurement seasonally (and after major storms). Because each measurement is anchored to the same landmarks, distance, and protocol, the system detects drift: a declining natural frequency at constant mass indicates progressive stiffness loss (advancing decay, root severing from nearby construction, fungal colonization); a rising damping ratio with falling frequency is the classic signature of internal hollowing.
Seasonal confounds are handled by seasonally-anchored comparisons. Leaf-on versus leaf-off mass shifts and soil-moisture stiffness shifts can each move natural frequency by 10% or more, comparable to the decay signal. The system corrects by: (a) a leaf-state classifier run on the same video, tagging each measurement as leaf-on, leaf-off, or transitional; (b) per-tree seasonal baselines, comparing leaf-on measurements to that tree's leaf-on history and leaf-off to leaf-off; and (c) a soil-moisture proxy from recent rainfall data for the address, applied as a covariate. Drift alerts fire only on seasonally-anchored comparisons, so a spring leaf-out never reads as stiffness gain and an autumn leaf-drop never reads as decay.
Drift exceeding the 95% repeatability interval established in bench testing generates an alert recommending professional inspection, catching compromised trees months to years before visible symptoms. Frequency drift is the primary alert channel; damping is corroborating only, because damping estimates are noisier (see Implementation Notes). All measurements are stored with full provenance (device, frame rate, wind conditions, distance, leaf state) so drift claims are auditable.
7. Risk Scoring, Triage, and Fleet Integration
- Failure probability: For the site design storm, the system computes the probability that gusts exceed the derated critical wind speed, using the local wind-speed distribution (Weibull fit from nearby station history) integrated over the failure envelope. Output is an annual failure probability with a confidence interval reflecting measurement quality and calibration maturity. Windthrow is a rare event, so base rates dominate: the report states the interval plainly and notes that a low measured risk is not a safety certification.
- Consequence rating: The user photographs or marks targets within a target zone extending 1.5 times the tree height (a design parameter, not a derived quantity): structures, roads, sidewalks, power lines, play areas. Each target class carries a severity weight; the consequence rating is the weighted sum, so an identical tree scores higher over a bedroom than over an empty field. Imagery of neighboring properties is limited to what target marking requires, is retained on-device, and is not uploaded.
- Triage bands: Risk (probability times consequence) maps to action: monitor (re-measure next season), inspect (certified arborist within 90 days), mitigate (prune, cable, or remove within 30 days). The band thresholds and the 90/30-day windows are design parameters. The PDF report prints the confidence interval alongside a plain-language statement that low measured risk is not a safety certification, and any mitigate recommendation requires confirmation by a certified arborist before removal. False reassurance and false alarm are both failure modes of the system, and the arborist confirmation gate exists to contain them.
- Fleet mode: Municipalities and utilities run the protocol across street-tree and right-of-way inventories: a two-person crew measures 15 to 25 trees per day with phones and a rope, versus a pull-test rig managing roughly 3 to 6 trees per day with a specialist crew. Measurements sync to the city's tree inventory (species, DBH, location already on file), producing a ranked mitigation list before storm season and a documented, time-stamped measurement record a municipality may retain for its risk-management process. Measured risk creates knowledge, and knowledge creates duty: flagged trees are treated as known hazards with documented follow-through, not as discharged liability.
- Insurance integration: With homeowner consent, the risk score and drift history feed property underwriting: well-monitored low-risk trees earn credits, high-risk unmitigated trees near structures carry surcharges or mitigation requirements. Any insurer use must provide the homeowner the full input set behind the score, a contestation and appeal path, and a prohibition on coverage denial based solely on the score without arborist confirmation.
8. Figures Description
- Figure 1: System overview: smartphone on tripod at measured distance from tree, rope pull-and-release configuration with inline spring scale, Bluetooth anemometer, and cloud/on-device processing pipeline from video to risk score.
- Figure 2: Motion tracking illustration: video frame with sub-pixel-tracked trunk and crown landmarks, static background reference features, and extracted displacement time series for three heights.
- Figure 3: Free-decay record: trunk displacement versus time after rope release, with logarithmic-decrement fit yielding damping ratio and dominant frequency.
- Figure 4: Species failure envelope: critical wind speed curves for stem breakage and uprooting versus DBH for three species, with the measured tree's derated operating point and the site design-storm gust marked.
- Figure 5: Longitudinal drift plot: natural frequency and damping ratio across six seasonal measurements, with repeatability bands and the alert threshold crossing that preceded a documented failure.
Claims
- A system for estimating tree windthrow failure risk, comprising: a consumer mobile device with a camera, configured to record high-frame-rate video of a tree from a stabilized position at a measured distance; a motion-tracking module that extracts sub-pixel trunk and crown displacement time series from the video while subtracting camera shake measured from static background features; a modal analysis module that derives the tree's first-mode natural frequency and damping ratio from the displacement time series; and a risk module that converts the measured dynamic parameters into a windthrow failure probability.
- The system of claim 1, wherein the consumer mobile device executes an application that instructs a user to displace the tree with a rope at approximately two-thirds of tree height and release it on a countdown in calm air, and wherein the damping ratio is computed by logarithmic decrement of the resulting free-decay oscillation.
- The system of claim 1, wherein the modal analysis module separates trunk first-bending-mode motion from crown modes, and wherein a measured first-mode frequency below a species-size expectation, corrected for leaf state and soil moisture, triggers the guided visual defect survey of claim 5.
- The system of claim 1, further comprising a wind load module that segments crown sail area from the video, estimates crown porosity via a density classifier, fuses local wind speed from an anemometer or weather-station feed, and computes a gust overturning moment at the stem base for both measured and design-storm gust speeds.
- The system of claim 1, further comprising species-specific failure envelopes encoding stem-breakage critical wind speed, derived from measured stiffness via the frequency-stiffness relation and derated by defect priors from a guided visual survey, and uprooting critical wind speed, derived from species root-architecture class, soil class, and rooting-space constraint.
- The system of claim 5, wherein the failure envelopes are calibrated by Bayesian updating against post-storm outcomes of previously measured trees exposed to known gust events.
- The system of claim 1, further comprising a longitudinal drift module that compares repeated measurements anchored to common landmarks and protocol using seasonally-anchored comparisons, and generates an inspection alert when natural frequency decline or damping ratio change exceeds a 95% repeatability interval.
- The system of claim 1, further comprising a consequence-rating module in which targets within a target zone extending 1.5 times the tree height are marked and severity-weighted, and a triage module mapping the product of failure probability and consequence rating to monitor, inspect, or mitigate action bands with an exportable report.
- A method for non-contact tree stability assessment comprising: recording high-frame-rate video of a tree with a stabilized consumer mobile device at a measured distance; tracking sub-pixel trunk displacement with camera-shake correction from static background features; extracting natural frequency and damping ratio by system identification; estimating wind overturning moment from video-segmented crown geometry and local wind data; and computing a failure probability by comparing design-storm loading against species-specific critical wind speeds derated by the measured dynamic stiffness.
- The method of claim 9, further comprising performing a guided pull-and-release free-decay test in calm air with a marked displacement target and a force-limiting breakaway link, and computing the damping ratio by logarithmic decrement.
- The method of claim 9, further comprising fleet-mode operation across a municipal or utility tree inventory, synchronizing per-tree measurements to inventory records to produce a ranked pre-storm-season mitigation list.
Implementation Notes
The minimum viable implementation is a smartphone app plus a $20 tripod. Frame rates of 120 fps or higher are preferred for the free-decay mode; most flagship phones since 2021 support this. On-device processing is feasible: optical flow on a few dozen landmarks at 1080p runs in real time on modern mobile GPUs, and the spectral analysis is trivial compute. The rope for the pull test is ordinary 10 mm arborist throw line; the 2 to 5 cm pull displacement is roughly an order of magnitude below the tens-of-centimeters trunk deflection of a standard instrumented pull test, so the test is non-damaging by construction.
Measurement repeatability is the controlling specification. Bench testing should establish the 95% repeatability interval for natural frequency (target: ±0.02 Hz, about 7% of a typical 0.3 Hz urban-tree mode, the resolution needed to detect the 10 to 20% frequency drift that signals stiffness loss in section 6) and for damping ratio (target: ±15% relative; for a typical 5% damping ratio that is ±0.75 percentage points absolute) across phone models, distances, and lighting conditions. Damping is the noisier parameter, which is why frequency drift is the primary alert channel in section 6 and damping is corroborating only. Phones should be characterized once per model for rolling-shutter distortion at the frame rates used; global reset or shutter-speed compensation keeps sub-pixel tracking honest.
Wind remains the largest uncertainty in ambient mode, which is why the free-decay mode exists: damping and frequency from free decay need no wind measurement at all, and the load side is handled analytically from the design storm. Operators should prefer free-decay mode whenever calm air is available and reserve ambient mode for rapid screening.
Known limitations, stated plainly. The method estimates the stiffness-margin component of risk; it does not predict whether a given tree fails in a given storm. Windthrow is a rare event, so even a well-calibrated score is dominated by base rates: most high-scoring trees will never fail, and some low-scoring trees will, which is why every report prints its confidence interval, states that low measured risk is not a safety certification, and routes mitigate recommendations through arborist confirmation. The species envelopes need a years-long calibration bootstrap before their probabilities are trustworthy; until then the intervals are wide by design. Leaf-state and soil-moisture corrections are covariates, not perfect controls, and the residual seasonal signal sets the floor on detectable drift.
Data governance: tree measurements at private addresses are homeowner data. Addresses are hashed at ingest; imagery is retained on-device and only extracted features leave the device; the calibration database stores anonymized species, size, dynamics, wind, soil class, and outcome fields aggregated at a minimum-k threshold, never addresses or owner identity. Raw video is deleted after feature extraction unless the user opts into retention for reprocessing; per-tree measurement records with provenance are retained for the drift history the user asked for. Imagery of neighboring properties is limited to target marking, retained on-device, and never uploaded. Fleet and insurance integrations require explicit consent per address. For insurer use, the homeowner receives the full input set behind the score and a contestation path, and coverage may not be denied on the score alone without arborist confirmation. The system must not be presented as a substitute for a certified arborist's judgment; the triage bands route to professionals, and the report states its confidence interval plainly.
Prior Art References
- University of Washington thesis: Measuring Tree Sway Frequency Using Video Processing: video reproduces accelerometer sway frequencies within ±0.03 Hz; suggests identifying windthrow-vulnerable trees
- Wang et al., 2022, Forests: video tracking of a 23.2 m birch, 0.26 to 0.28 Hz fundamental, matching accelerometer and pull-test results on the same tree
- Ammatelli et al., 2025, Agricultural and Forest Meteorology: video-derived sway frequency as biomarker of tree hydration and health
- WTW Research Network, "Seeing extreme winds" (2024): video analytics of tree and flag motion for local wind-speed estimation
- Mattheck, C. and Breloer, H., The Body Language of Trees: Visual Tree Assessment (VTA) methodology, the qualitative industry standard
- James, K. R. et al., "Mechanical stability of trees under dynamic loads," American Journal of Botany: tree dynamics, damping, and windthrow mechanics
- Gardiner, B. et al., HWIND/GALES model family: mechanistic windthrow risk modeling for forest stands (critical wind speeds for breakage and overturning)
- ASCE 7: Minimum Design Loads and Associated Criteria for Buildings and Other Structures (design wind speeds by site)
- National Storm Damage Center (via UF IFAS / Newswise): severe-weather damage to trees accounts for more than $1 billion in U.S. property damage per year
- Ohio Insurance Institute (via Lawn & Landscape): after Hurricane Ike, over half of 100,000-plus Ohio claims were attributed to fallen trees, roughly $300 million in one state