System and Method for Continuous Monitoring of Residential Foundation Drainage System Performance Using Sump Pump Current Signature Analysis with Precipitation-Correlated Groundwater Infiltration Rate Estimation and Predictive Pump Failure Detection via Edge-Deployed Neural Networks
Abstract
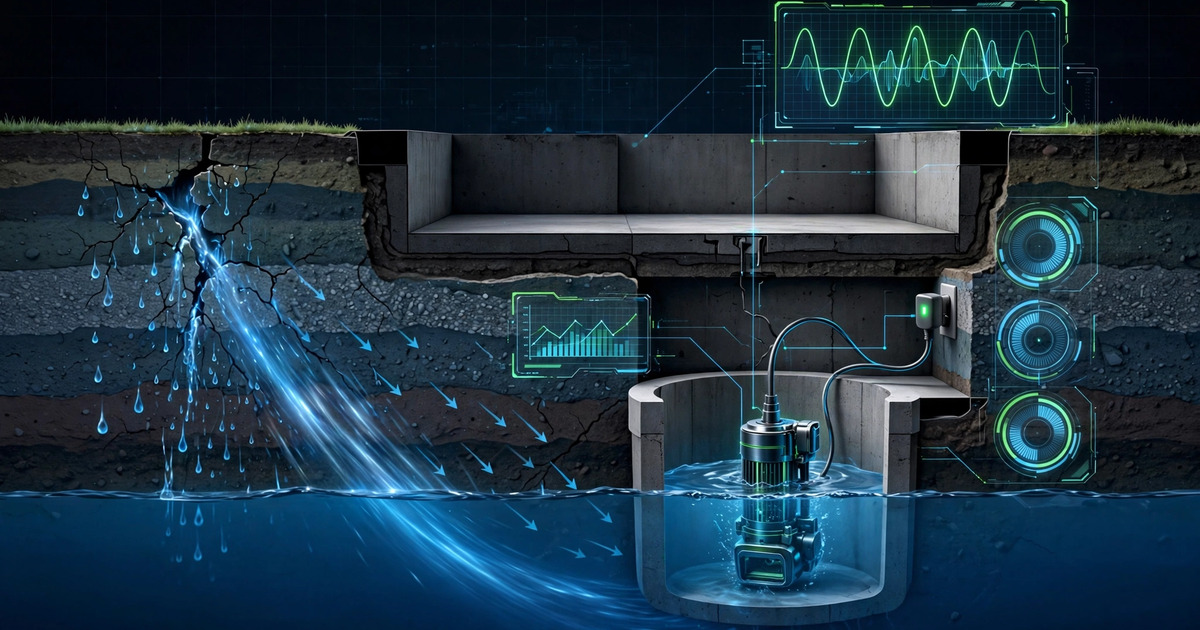
Disclosed is a system and method for continuously monitoring residential foundation drainage system health by analyzing the electrical current signature of a sump pump through a standard Wi-Fi-enabled smart plug. The system captures high-frequency current waveforms (sampling at 1–4 kHz via the smart plug's integrated current transformer or shunt resistor) during each pump activation cycle and extracts a feature vector comprising: startup inrush current magnitude and duration, steady-state running current, motor current harmonic spectrum (1st through 7th harmonics), pump cycle duration, inter-cycle interval, power factor, and shutdown transient profile. An edge-deployed temporal convolutional network (TCN) running on a low-power companion processor (ESP32-S3 or Raspberry Pi Zero 2W) classifies pump health into five degradation states: healthy, early wear (impeller erosion or bearing roughening), moderate degradation (check valve leakage, partial impeller blockage), severe degradation (motor winding insulation breakdown, seized bearing), and imminent failure. The system correlates pump activation frequency, cycle duration, and inter-cycle intervals with real-time precipitation data from local weather APIs and, where available, nearby USGS groundwater monitoring well levels, to estimate the groundwater infiltration rate into the foundation drainage system (perimeter drain or drain tile). Changes in the infiltration-to-precipitation ratio over time reveal drainage system degradation: increasing ratios indicate drain tile collapse, root intrusion, or sediment clogging that concentrate flow to the sump, while decreasing ratios with rising pump effort indicate sump pit sedimentation or pump capacity loss. The system issues graduated alerts from smartphone notification through integration with smart home platforms (Matter/Thread) for automated backup pump activation. Total hardware cost: a single $15–25 smart plug with current monitoring capability. No plumbing modification, no sensors in the sump pit, no contact with water.
Field of the Invention
This invention relates to residential building maintenance and predictive infrastructure monitoring, specifically to the use of non-contact electrical signature analysis of sump pump motor current for continuous assessment of both pump mechanical health and foundation drainage system hydraulic performance, combined with precipitation-correlated infiltration estimation and edge-deployed machine learning for predictive failure detection.
Background
Basement flooding from sump pump failure is among the most costly and preventable residential disasters in the United States. The Insurance Information Institute reports that water damage and freezing claims average $12,514 per incident, with basement flooding representing a substantial fraction of the approximately 1 in 50 insured homes filing a water damage claim annually. State Farm estimates that 98% of basements in the United States will experience water damage at some point, with sump pump failure during heavy rain being a leading cause. The total annual cost of residential water damage in the U.S. exceeds $20 billion.
Sump pumps are the last line of defense in a residential foundation drainage system. A typical installation consists of a perimeter drain (French drain or drain tile) collecting groundwater from around the foundation footings, channeling it to a sump pit (typically an 18–24 inch diameter, 24–30 inch deep polyethylene basin), where a submersible pump activates via a float switch when the water level rises. The pump discharges water through a check valve and discharge pipe to the exterior, away from the foundation. These systems operate unattended, often in unfinished basements where failures go unnoticed until water damage has already occurred.
Failure modes include:
- Mechanical pump failure: Impeller erosion from sediment-laden water, bearing wear from continuous or frequent cycling, motor winding insulation degradation from heat and moisture, capacitor failure in single-phase induction motors. The Zoeller Pump Company estimates average sump pump lifespan at 7–10 years, but actual life varies dramatically with duty cycle, water quality, and installation conditions.
- Float switch failure: The float switch can jam from mineral deposits, debris entanglement, or pit geometry that allows the float to wedge against the pit wall. This is the single most common sump pump failure mode.
- Check valve failure: The check valve prevents discharged water from flowing back into the sump pit. When it fails, a fraction of each pump cycle's volume returns to the pit, causing rapid short-cycling that overheats the motor and accelerates wear.
- Drainage system degradation: The perimeter drain tiles that feed the sump pit can collapse, clog with sediment or iron ochre, or be infiltrated by tree roots. These failures are invisible from inside the basement and develop over years, gradually reducing drainage capacity until a heavy rain event exceeds the degraded system's ability to manage groundwater.
- Power failure during storms: The most insidious failure mode. The storm that produces the most groundwater is also the most likely to knock out power. Battery backup sump pumps ($200–500) mitigate this but have limited run time (4–8 hours at typical cycling rates) and their own failure modes (battery degradation, charger failure).
Current monitoring solutions include:
- Water alarm sensors: Simple float or conductivity sensors ($10–30, e.g., Basement Watchdog BWD-HWA) placed on the basement floor that trigger an audible alarm when water is detected. These are reactive, not predictive: by the time water reaches the sensor, flooding has begun. No pump health monitoring, no drainage system assessment, no remote notification unless paired with a smart home hub.
- Smart sump pump monitors: Products like the PumpSentry ($150–250) and Basement Defender ($350+) install sensors in the sump pit to monitor water level, pump activation, and temperature. These provide valuable data but require installation in the sump pit (contact with water, potential interference with float switch), cost significantly more than a smart plug, and focus on water level monitoring rather than pump mechanical health or drainage system performance. They measure the symptom (water level) rather than the cause (pump degradation, drainage impairment).
- Battery backup systems with monitoring: Products like Wayne WSS30VN ($300–500) include battery backup pumps with basic monitoring (pump run count, battery voltage) via smartphone apps. These provide redundancy but not predictive maintenance.
The gap in the art is a system that: (a) monitors sump pump mechanical health continuously from the electrical signature alone, requiring no sensors in the sump pit; (b) estimates the hydraulic performance of the entire foundation drainage system by correlating pump behavior with precipitation; (c) predicts pump failure before it occurs, enabling preventive replacement; (d) detects drainage system degradation that develops over years; and (e) costs under $25 in hardware by leveraging existing smart plug technology that millions of households already own.
Detailed Description
1. Electrical Signature Acquisition via Smart Plug
The system uses a standard Wi-Fi-enabled smart plug with energy monitoring capability as its sole sensing hardware. Examples of commercially available smart plugs with the requisite current monitoring include the TP-Link Kasa KP115 ($15), Shelly Plug S ($18), Tasmota-flashed Tuya plugs ($12), and Emporia Smart Plug ($15). These devices contain either a current transformer (CT) or shunt resistor that measures the current flowing to the connected load, along with a microcontroller (typically ESP8266 or ESP32) that samples the current waveform.
Stock firmware in most smart plugs samples current at 1–10 Hz and reports only RMS power and energy. This is insufficient for motor health analysis. The system requires one of two approaches:
- Custom firmware (preferred): Open-source firmware such as Tasmota or ESPHome can be flashed to most ESP-based smart plugs, enabling access to the raw ADC readings from the current sensor at the full ADC sample rate (typically 1–4 kHz on ESP32, limited by the SAR ADC and WiFi scheduling). The firmware captures a burst of 2,000–8,000 samples (1–2 seconds of data) at each pump activation event, extracts the feature vector on-device, and transmits features (not raw waveforms) via MQTT or HTTP to a local companion processor.
- High-frequency energy monitor: Alternatively, a dedicated energy monitor with higher sample rates, such as the CircuitSetup 6-Channel Energy Monitor ($50, samples at 8 kHz per channel via ATM90E32AS metering IC) or Emporia Vue Gen 2 ($35, CT clamp on the sump pump circuit), can be installed at the electrical panel. These provide higher-fidelity waveforms but require panel-level installation rather than simple plug-in deployment.
The captured current waveform during a single pump cycle (typically 10–90 seconds for residential sump pumps) contains the following analyzable features:
- Startup inrush profile: A single-phase induction motor (the type used in virtually all residential sump pumps) draws 5–8x its rated running current during startup as the rotor accelerates from rest. The inrush duration (typically 200–800 ms) and peak magnitude reflect motor winding condition, supply voltage, and mechanical load. A healthy 1/3 HP sump pump draws approximately 6–9 A inrush on a 120V circuit before settling to 3–4 A running current. Degraded bearings increase startup torque requirements, extending inrush duration and increasing peak current. A partially seized bearing may produce an inrush duration 2–4x normal.
- Steady-state running current and harmonics: During steady-state operation, the motor current contains the fundamental 60 Hz component plus harmonics. The harmonic content reflects mechanical load and motor condition. A healthy pump running against its designed head pressure produces a characteristic harmonic spectrum dominated by the fundamental with 3rd, 5th, and 7th harmonics at predictable ratios. Impeller imbalance from erosion or debris introduces sub-harmonic modulation. Bearing wear introduces broadband noise floor elevation. Winding insulation degradation changes the phase angle between voltage and current, reducing power factor.
- Cycle duration: The time from pump activation to deactivation, determined by the float switch hysteresis and the pump's flow rate relative to the pit volume. Shorter cycles at the same activation frequency indicate either increased pump flow rate (unlikely in a degrading system) or reduced float switch hysteresis (float switch debris or adjustment). Longer cycles at the same activation frequency indicate reduced pump flow rate from impeller wear, check valve leakage, or discharge pipe obstruction.
- Shutdown transient: When the float switch deactivates the pump, the motor current drops to zero over 50–200 ms as the rotor decelerates under the remaining water load. The deceleration profile reflects the inertia of the water column and the check valve closure dynamics. A healthy check valve produces a clean shutdown with a brief current spike (water hammer impulse) followed by zero current. A leaking check valve produces a characteristic reverse-flow transient as water drains back through the impeller, briefly spinning the motor in reverse (detectable as a negative current pulse or phase reversal in the shutdown waveform).
2. Feature Extraction and Health Classification
From each pump activation cycle, the system extracts a feature vector of 28 elements:
- Inrush peak current (A)
- Inrush duration (ms, measured to 110% of steady-state)
- Inrush energy (A²·s, integral of squared current during inrush)
- Steady-state RMS current (A)
- Current standard deviation during steady state (A)
- Power factor (cosine of voltage-current phase angle)
- Fundamental frequency magnitude (60 Hz)
- –13. Harmonic magnitudes: 2nd through 7th (120–420 Hz)
- Total harmonic distortion (THD, %)
- Spectral centroid of current waveform
- Spectral bandwidth (Hz)
- Noise floor level (dB below fundamental)
- Cycle duration (seconds)
- Time since last cycle (seconds)
- Shutdown deceleration time constant (ms)
- Check valve closure impulse magnitude (A)
- Post-shutdown reverse current presence (binary)
- Post-shutdown reverse current magnitude (A, zero if absent)
- Peak-to-steady-state current ratio
- Inrush-to-prior-inrush delta (A, change from previous cycle)
- Steady-state-to-prior-steady-state delta (A)
- Supply voltage estimate (V, from power and current)
- Ambient temperature estimate (°C, from smart plug's internal sensor if available)
The feature vector is fed to a 1D temporal convolutional network (TCN) with the following architecture:
- Input: sliding window of the last 50 pump cycles' feature vectors (50 × 28 matrix)
- 4 residual blocks with dilated causal convolutions (dilations: 1, 2, 4, 8), capturing dependencies across 16 pump cycles
- Each block: 32 filters, kernel size 3, batch normalization, ReLU activation, dropout 0.1
- Global average pooling followed by two fully connected layers (64, 5)
- Output: 5-class softmax (healthy, early wear, moderate degradation, severe degradation, imminent failure)
- Model size: approximately 45 KB quantized (INT8), fits comfortably on ESP32-S3 (512 KB SRAM)
The model is trained on synthetic data generated from physics-based motor models (Schoen et al., IEEE Transactions on Industrial Electronics, 1995; Glowacz, IEEE Transactions on Industry Applications, 2018) with fault injection (bearing defects modeled as added friction and vibration harmonics, winding faults as resistance changes and inter-turn short circuits, impeller erosion as reduced load torque, check valve leakage as periodic reverse-flow events). Transfer learning from industrial motor fault diagnosis datasets (Case Western Reserve University Bearing Data Center) provides pre-trained convolutional features that transfer to residential sump pump motors despite the domain shift from industrial 3-phase motors to residential single-phase.
3. Precipitation-Correlated Drainage System Assessment
The system's second major capability is assessing the hydraulic performance of the foundation drainage system (perimeter drain, drain tile, footer drain) that feeds the sump pit. This assessment requires no additional sensors; it uses only the pump activation pattern correlated with precipitation data.
The key insight is that a foundation drainage system's hydraulic conductance (the ratio of water delivered to the sump pit per unit of precipitation) is a measurable quantity that changes predictably as the drainage system degrades. In a healthy system, a 1-inch rainfall event produces a characteristic pump activation pattern: a delayed onset (30 minutes to 4 hours, depending on soil permeability and drainage path length), a peak activation frequency, and a gradual tail-off as groundwater drains. The total pumped volume (estimated from pump flow rate × cycle duration × number of cycles) divided by the precipitation amount yields the drainage conductance coefficient.
The system obtains precipitation data from:
- Weather APIs: National Weather Service API (free, 1-hour resolution), OpenWeatherMap (free tier, 3-hour resolution), Tomorrow.io (minute-level precipitation nowcasting in the free tier)
- Personal weather stations: If the homeowner has a personal weather station (Davis Vantage, WeatherFlow Tempest, Ambient Weather), direct integration provides minute-level precipitation data with exact on-site measurement. The WeatherFlow Tempest ($329) uses a haptic rain sensor with 0.01 mm resolution, ideal for correlating light rain with drainage response.
- USGS groundwater monitoring: Where available, nearby USGS groundwater monitoring wells (NWIS Groundwater Data) provide direct measurement of the water table elevation, enabling correlation of pump activation with actual groundwater conditions rather than precipitation proxies.
Drainage system degradation manifests as measurable changes in the pump activation pattern relative to precipitation:
- Increasing conductance coefficient (more water per inch of rain): Indicates drain tile damage (collapse, root intrusion, joint separation) that allows surface water or soil to enter the drainage system, increasing flow beyond what foundation drainage alone would produce. This is paradoxically a sign of drainage system failure, not improvement.
- Decreasing conductance coefficient (less water per inch of rain): Indicates drain tile clogging (sediment, iron ochre, mineral deposits) that reduces flow to the sump pit. Water that should reach the sump is instead backing up against the foundation, increasing hydrostatic pressure and the risk of basement wall seepage.
- Changing response time (onset delay): A shortening onset delay suggests drainage path shortening (tile collapse creating direct surface connection) or rising water table. A lengthening onset delay suggests drainage path obstruction (partial clogging, sediment accumulation).
- Activation pattern asymmetry: If the foundation has drainage on all four sides but only two sides' drains feed effectively, the pump activation pattern during rain will show a bimodal response as water arrives via the shorter path first, then the longer degraded path. The system can detect the emergence of bimodal patterns that indicate asymmetric drain degradation.
The system builds a per-property hydraulic response model using a long short-term memory (LSTM) network that takes as input: hourly precipitation (mm), hourly temperature (°C, affecting soil permeability via frost and evapotranspiration), season (soil moisture baseline varies seasonally), and the pump activation time series. After training on 6–12 months of baseline data, the model predicts expected pump behavior for a given precipitation event. Deviations between predicted and actual behavior trigger drainage assessment alerts.
4. Predictive Failure Scoring
The system maintains a remaining useful life (RUL) estimate for the sump pump, expressed as a probability distribution over time-to-failure. The RUL model uses the degradation state trajectory (the sequence of health classifications from the TCN over weeks and months) as input to a Weibull survival model with time-varying covariates:
- Time in each degradation state
- Rate of transition between states (how quickly the pump is degrading)
- Total accumulated pump cycles (odometer)
- Average duty cycle (fraction of time spent running)
- Average cycle duration trend (increasing cycle duration indicates capacity loss)
- Supply voltage statistics (low voltage accelerates motor wear)
- Seasonal patterns (pumps running more during wet seasons accumulate wear faster)
The RUL estimate is updated after every pump cycle and reported to the homeowner as:
- Green (RUL > 12 months at 90% confidence): Pump is healthy. No action needed. Monthly summary report of pump statistics.
- Yellow (RUL 3–12 months at 90% confidence): Early wear detected. Quarterly inspection recommended. Alert includes specific degradation indicators (e.g., "Bearing noise signature detected: harmonic floor elevated 6 dB above baseline. Estimated 6–9 months to failure at current duty cycle.").
- Orange (RUL 1–3 months at 90% confidence): Moderate degradation. Schedule replacement before next wet season. Alert includes specific failure mode and urgency level.
- Red (RUL < 1 month or imminent failure indicators): Critical. Replace immediately. If smart home integration is configured, automatically activate backup pump (if present) and send push notification with local plumber contacts.
5. Check Valve Health Monitoring
Check valve failure is a particularly insidious and common failure mode that the electrical signature method uniquely detects. When a check valve leaks, the pump must re-pump water that drained back into the pit after the previous cycle. This produces two measurable effects:
- Shortened inter-cycle intervals: The pump cycles more frequently than the groundwater infiltration rate alone would require, because a fraction of each cycle's discharge volume returns to the pit. The ratio of observed cycling rate to precipitation-predicted cycling rate reveals the check valve leakage fraction.
- Reverse-flow motor current: When water flows backward through a centrifugal pump impeller, it spins the motor in reverse. In a single-phase induction motor, this reverse rotation induces a brief current pulse with reversed phase angle relative to the supply voltage. The shutdown transient analysis described in Section 1 detects this signature. A healthy check valve produces zero reverse current. A leaking check valve produces a reverse current pulse whose magnitude is proportional to the leak rate and the height of the water column above the check valve.
The system tracks check valve health as a separate metric from pump motor health, since check valve replacement ($30–80 and a 15-minute job) is far less costly than pump replacement ($150–400 and 1–2 hours).
6. Discharge Pipe Freeze Protection
In cold climates, the sump pump discharge pipe can freeze during winter, preventing the pump from expelling water. A frozen discharge pipe causes the pump to run against a dead-head (zero flow), drawing higher current and generating heat that can destroy the motor within minutes. The system detects a dead-head condition by identifying the signature of a pump running at elevated current with no reduction in sump pit water level (indicated by the float switch never deactivating, or deactivating and immediately reactivating). When detected, the system issues an emergency alert and, if configured, cuts power to the pump to prevent motor burnout.
The system also provides a freeze risk estimate by monitoring the pump motor's running temperature (inferred from the winding resistance change via current-voltage analysis during the first seconds of operation) and correlating with outdoor temperature. When the outdoor temperature drops below freezing and the discharge pipe temperature (inferred from the motor's post-run cooling curve, which is affected by the temperature of water returning through a cold discharge pipe) approaches 0°C, the system can trigger a periodic short pump activation (5–10 seconds every 30 minutes) to keep water moving in the discharge pipe and prevent freezing.
7. System Architecture
The complete system comprises:
- Sensing layer: One smart plug with energy monitoring ($15–25) plugged into the sump pump's outlet. Custom firmware (Tasmota/ESPHome) captures current waveforms during pump activation events and extracts the 28-element feature vector on-device.
- Processing layer: A local companion device (ESP32-S3 development board ($7), Raspberry Pi Zero 2W ($15), or any existing smart home hub with processing capacity) receives feature vectors via MQTT over the local network. This device runs the TCN health classifier, the LSTM drainage assessment model, and the Weibull RUL estimator. All inference runs locally with no cloud dependency.
- Data enrichment layer: The companion device queries weather APIs (NWS, personal weather station) every 15 minutes for precipitation data, and optionally queries USGS NWIS for nearby groundwater levels. These are correlated with pump activation records for drainage system assessment.
- Alert and integration layer: Alerts are delivered via local push notification (Pushover, ntfy, Home Assistant companion app), email, or SMS. Smart home integration via MQTT, Home Assistant, or Matter/Thread enables automated responses: backup pump activation, sump pump power cutoff on dead-head detection, and whole-home water shutoff valve activation (e.g., Moen Flo, Phyn) if basement flooding is detected.
Total hardware cost for the minimum viable system: $15 (one smart plug). Total hardware cost for the full system with companion processor and weather station integration: $30–65. This compares to $150–350+ for dedicated sump pump monitoring systems that provide fewer capabilities (water level monitoring only, no pump health analysis, no drainage system assessment).
8. Figures Description
- Figure 1: System architecture diagram showing the smart plug on the sump pump circuit, MQTT communication to the companion processor, weather API data flow, and alert output pathways. The sump pit, perimeter drain, and discharge pipe are shown in cross-section with water flow arrows.
- Figure 2: Annotated current waveform of a complete pump activation cycle showing: inrush phase (0–500 ms), steady-state running phase (0.5–45 s), and shutdown transient (45–45.3 s). Overlay shows a degraded pump waveform with elevated harmonics during steady state and reverse current during shutdown.
- Figure 3: Harmonic spectrum comparison between a healthy sump pump motor (clean fundamental with minimal harmonics) and a pump with bearing wear (elevated 3rd and 5th harmonics, broadband noise floor rise).
- Figure 4: Time-series plot spanning 12 months showing: daily precipitation (mm, top panel), pump activation frequency (cycles/hour, middle panel), and drainage conductance coefficient (bottom panel). The gradual decline in conductance coefficient over months indicates progressive drain tile clogging. An annotation marks the point where the system issued a drainage assessment alert.
- Figure 5: Weibull survival curve showing the estimated remaining useful life distribution for a pump transitioning from "healthy" to "early wear" state, with 90% confidence interval bounds and the corresponding alert level transitions (green to yellow at 12 months, yellow to orange at 3 months, orange to red at 1 month).
Claims
- A system for continuous monitoring of a residential sump pump and foundation drainage system, comprising: a current sensing device interposed between the sump pump and its electrical supply that captures electrical current waveforms during pump activation cycles; a feature extraction module that derives from each captured waveform a feature vector including at least startup inrush characteristics, steady-state current harmonics, cycle duration, and shutdown transient profile; and an edge-deployed machine learning model that receives sequences of feature vectors across multiple pump cycles and classifies pump health into at least three degradation states representing a progression from healthy operation toward failure.
- The system of claim 1, wherein the current sensing device is a standard consumer Wi-Fi-enabled smart plug with energy monitoring capability running custom open-source firmware that enables high-frequency current waveform capture at a sample rate of at least 1 kHz during pump activation events.
- The system of claim 1, wherein the feature vector includes a check valve health indicator derived from analysis of the pump shutdown transient, specifically the presence and magnitude of reverse motor current caused by water flowing backward through the pump impeller after deactivation due to check valve leakage.
- The system of claim 1, further comprising a precipitation correlation module that receives real-time precipitation data from at least one weather data source and computes a drainage conductance coefficient representing the ratio of water volume processed by the sump pump to the precipitation volume, and detects changes in this coefficient over time as indicators of foundation drainage system degradation.
- The system of claim 4, wherein the precipitation correlation module detects asymmetric drainage degradation by identifying the emergence of bimodal pump activation patterns during precipitation events, indicating that drainage paths from different sides of the foundation are responding at different rates.
- The system of claim 1, further comprising a remaining useful life estimator that maintains a probability distribution over time-to-pump-failure, updated after each pump cycle based on the health classification trajectory, accumulated cycle count, and duty cycle statistics, and issues graduated alerts at configurable confidence-bounded time horizons.
- The system of claim 1, further comprising a discharge pipe freeze detection module that identifies a dead-head pump condition from the current signature of a pump running at elevated current without the float switch deactivating, and in response issues an emergency alert and optionally cuts power to the pump to prevent motor burnout.
- A method for estimating the hydraulic performance of a residential foundation drainage system without direct water level or flow measurement, comprising: monitoring the electrical current signature of a sump pump through a current sensing device to determine pump activation timing, cycle duration, and estimated flow rate; correlating the pump activation pattern with real-time precipitation data and optionally groundwater level data from nearby monitoring wells; computing a drainage conductance coefficient representing the relationship between precipitation and pump activity; tracking changes in the drainage conductance coefficient over time to detect progressive drainage system degradation including drain tile collapse, root intrusion, sediment clogging, and iron ochre accumulation; and issuing alerts when the drainage conductance coefficient deviates from its established baseline by more than a configurable threshold.
- The method of claim 8, further comprising building a per-property hydraulic response model using a recurrent neural network trained on historical precipitation and pump activation data, and detecting drainage system anomalies as deviations between predicted and observed pump behavior for a given precipitation event.
- The system of claim 1, wherein the edge-deployed machine learning model is a temporal convolutional network processing a sliding window of feature vectors from a configurable number of recent pump cycles, quantized for execution on a low-power microcontroller without cloud connectivity, and wherein the system operates as a retrofit installation requiring only connection of the current sensing device to the sump pump's existing electrical outlet with no plumbing modification or contact with water.
- The system of claim 1, further comprising a discharge pipe freeze prevention module that, when outdoor temperature drops below a configurable threshold, triggers periodic short pump activations at intervals sufficient to maintain water flow in the discharge pipe and prevent ice formation.
Implementation Notes
A reference implementation using commodity hardware can be constructed for under $30. The sensing layer uses a Tuya-compatible smart plug ($12) flashed with Tasmota firmware via tuya-convert (no soldering required for many models). The Tasmota scripting engine captures current waveforms by reading the integrated BL0937 or HLW8012 energy metering IC at its maximum update rate (~3.4 kHz for HLW8012). A Tasmota rule triggers waveform capture when power draw exceeds 50W (pump activation threshold), records 4,000 samples (~1.2 seconds), computes the feature vector using Tasmota's Berry scripting engine, and publishes the feature vector to a local MQTT broker.
The companion processor is a Raspberry Pi Zero 2W ($15) running Home Assistant with a custom integration. The TCN model (~45 KB INT8 quantized) runs inference via TensorFlow Lite in under 50 ms per cycle. The LSTM drainage model (~120 KB) runs inference after each precipitation event. Both models fit within the Pi Zero 2W's 512 MB RAM alongside Home Assistant.
Training data acquisition for the TCN health classifier uses a combination of: (1) physics-based motor simulation using the d-q axis induction motor model with parametric fault injection, generating synthetic current waveforms for healthy and degraded motor conditions; (2) accelerated life testing of sump pumps in a test rig with controlled water level, adjustable head pressure, and seeded faults (bearing defect injection via EDM notch, winding insulation degradation via controlled overheating, impeller erosion via abrasive slurry); and (3) field data collection from volunteer installations during the first deployment phase, with ground truth provided by subsequent pump replacement and inspection.
For the drainage conductance model, training requires at least one wet season (4–6 months) of baseline pump activation data correlated with precipitation. The model uses a personalized fine-tuning approach: a foundation model trained on synthetic drainage system simulations (pipe flow models with varying conductance parameters) is fine-tuned on each installation's specific precipitation-pump response curve during the baseline period.
The system's power consumption is negligible: the smart plug draws 0.5–1.5 W continuously (dominated by Wi-Fi standby), and the companion processor (if dedicated) draws 1–3 W. Both are powered from standard wall outlets that are available in any basement.
Prior Art References
- Insurance Information Institute: Water damage claims average $12,514 per incident
- State Farm: 98% of basements experience water damage
- Schoen et al., IEEE Trans. Industrial Electronics, 1995: Motor current signature analysis for fault detection in induction motors
- Glowacz, IEEE Trans. Industry Applications, 2018: Fault diagnosis of single-phase induction motors using acoustic and vibration signals
- Case Western Reserve University Bearing Data Center: Benchmark bearing fault vibration and current dataset
- Bai et al., 2018: Temporal convolutional networks for sequence modeling
- TensorFlow Lite for Microcontrollers: On-device ML runtime for edge deployment
- National Weather Service API: Free precipitation data access
- USGS NWIS Groundwater Data: Real-time groundwater monitoring well levels
- Tasmota: Open-source firmware for ESP-based IoT devices
- ESPHome: YAML-based firmware for ESP microcontrollers with Home Assistant integration
- Home Assistant: Open-source smart home platform
- Zoeller Pump Company: Sump pump maintenance and lifespan guidelines
- PumpSentry: Commercial sump pump monitoring system
- Basement Defender: Commercial sump pump monitoring system
- Henao et al., IEEE Trans. Industry Applications, 2014: Current signature analysis for condition monitoring of centrifugal pumps
- ESP32-S3 SoC: Low-power microcontroller with vector DSP extensions