System and Method for Continuous Soil Liquefaction Susceptibility Mapping Using Crowdsourced Smartphone Accelerometer Ambient Vibration Horizontal-to-Vertical Spectral Ratio Analysis with Graph Neural Network Spatial Interpolation and Real-Time Seismic Vulnerability Updating
Abstract
Disclosed is a system and method for mapping soil liquefaction susceptibility across urban areas by repurposing the MEMS accelerometers embedded in consumer smartphones to perform horizontal-to-vertical spectral ratio (HVSR) analysis of ambient seismic noise (microtremors). The HVSR technique, standardized in geophysical practice since Nakamura (1989), measures the ratio of horizontal to vertical Fourier amplitude spectra of ambient ground vibrations to extract the fundamental resonance frequency (f₀) of the soil column, which is a direct proxy for sediment thickness and stiffness. Soils with low f₀ (0.3–2.0 Hz) and high HVSR amplification (A₀ > 3) are strongly correlated with liquefaction susceptibility because they indicate deep, soft, water-saturated sedimentary deposits. Modern smartphone MEMS accelerometers (Bosch BMI260, STMicroelectronics LSM6DSO, InvenSense ICM-42688) achieve noise densities of 120–180 μg/√Hz, sufficient to resolve ambient seismic noise amplitudes of 0.1–10 mg in the 0.2–20 Hz band when the device is stationary on a rigid surface. The system deploys a background service on participating smartphones that opportunistically records 10-minute ambient vibration windows during periods of device stillness (detected via low-jerk conditions on the accelerometer), computes the HVSR curve on-device using Konno-Ohmachi smoothed Fourier spectra, and transmits only the processed HVSR curve (256 bytes) plus GPS coordinates and a device-floor metadata tag to a cloud aggregation service. A graph neural network (GNN) operating on a spatial mesh incorporating geological priors (surficial geology maps, water table depth, Vs30 estimates from topographic slope proxies) interpolates between sparse smartphone HVSR measurements to produce continuous f₀ and A₀ maps at 50-meter resolution. The resulting liquefaction susceptibility index (LSI) map is updated continuously as new smartphone observations arrive. During actual earthquake shaking, the same smartphone network provides real-time peak ground acceleration (PGA) and spectral acceleration measurements that are combined with the pre-computed LSI map to generate real-time liquefaction probability nowcasts within 30 seconds of shaking onset, enabling targeted emergency response dispatch to zones where ground failure is actively occurring.
Field of the Invention
This invention relates to geotechnical earthquake engineering and distributed environmental sensing, specifically to the use of consumer smartphone accelerometer networks for passive seismic site characterization through HVSR microtremor analysis and real-time liquefaction vulnerability assessment.
Background
Soil liquefaction is among the most destructive secondary effects of earthquakes. When saturated, loosely packed granular soils are subjected to cyclic shear loading, pore water pressure rises until it equals the effective confining stress, causing the soil to lose shear strength and behave as a viscous fluid. The consequences are catastrophic: buildings tilt, sink, or collapse as their foundations lose bearing capacity; buried infrastructure (water mains, sewer lines, gas pipelines) floats to the surface or fractures; lateral spreading displaces entire blocks of land toward free faces such as riverbanks and coastlines. The February 2023 Kahramanmaraş earthquake sequence (Mw 7.8 + Mw 7.5) caused extensive liquefaction across southeastern Türkiye, contributing to the $34.2 billion in direct damages (World Bank GFDRR, 2023). In İskenderun Bay, liquefaction-induced subsidence flooded the port district within 29 minutes of the mainshock, with sand ejecta columns reaching 2 meters (Öztürk et al., 2024). The January 2024 Noto Peninsula earthquake (Mw 7.5) triggered liquefaction across Niigata City, more than 300 km from the epicenter, damaging structures that had survived the catastrophic 1964 Niigata earthquake that originally established liquefaction as a recognized engineering hazard.
Current methods for assessing liquefaction susceptibility suffer from fundamental coverage limitations:
- Standard Penetration Test (SPT): A hollow-stem auger drill rig drives a split-spoon sampler into the ground using a 63.5 kg hammer falling 760 mm. The blow count (N-value) over 300 mm of penetration provides a direct measure of soil density. Cost: $5,000–$15,000 per borehole (20-meter depth), requiring a drill rig, operator, and geotechnical laboratory analysis. A single borehole provides a point measurement representing approximately 10 meters of lateral influence. Mapping liquefaction susceptibility across a city of 500 km² at 250-meter resolution would require 8,000 boreholes at a cost of $40–$120 million.
- Cone Penetration Test (CPT): A 35.7 mm diameter instrumented cone is hydraulically pushed into the ground at 2 cm/s, continuously measuring tip resistance (qc) and sleeve friction (fs). Higher resolution than SPT but requires a 20-tonne reaction truck. Cost: $2,000–$8,000 per sounding. Produces a 1D profile at a single point. The same 8,000-point city survey would cost $16–$64 million.
- Shear Wave Velocity (Vs) profiling: Multichannel Analysis of Surface Waves (MASW) or Spectral Analysis of Surface Waves (SASW) uses a linear array of 24–48 geophones to measure Rayleigh wave dispersion and invert for the Vs profile. Cost: $3,000–$10,000 per array deployment covering 50–100 meters of surface length. Vs30 (time-averaged Vs to 30 meters depth) below 180 m/s indicates NEHRP site class E (soft soil, high liquefaction susceptibility). City-scale Vs30 mapping at 250-meter resolution has been attempted in only a handful of cities worldwide (e.g., Wills et al., 2000 for California using topographic slope as a proxy).
- HVSR with dedicated seismometers: The HVSR method (Nakamura, 1989) extracts the soil column fundamental resonance frequency (f₀) from the ratio of horizontal to vertical Fourier amplitude spectra of ambient seismic noise. It requires no active source and can be performed with a single three-component sensor placed on the ground surface for 15–30 minutes. The SESAME European project (SESAME, 2004) standardized the acquisition and processing protocols. Typical equipment cost: $2,000–$10,000 per broadband seismometer. Field deployment cost: $200–$500 per measurement point. HVSR has been used for seismic microzonation in dozens of cities (Cox et al., 2020), but achieving 50-meter resolution across a metropolitan area requires tens of thousands of measurements over months of fieldwork.
- Satellite-derived proxies: Wald and Allen (2007) demonstrated that topographic slope correlates with Vs30, enabling global Vs30 estimation from SRTM digital elevation data. The USGS global Vs30 map provides worldwide coverage but at ~750-meter resolution with ±50% uncertainty in alluvial basins where liquefaction risk is highest. InSAR-derived ground deformation maps can identify liquefied zones after an earthquake (Barnhart et al., 2023) but provide no predictive capability before shaking occurs.
The gap in the art is a system that: (a) extracts HVSR site characterization from the MEMS accelerometers already present in billions of smartphones without dedicated geophysical equipment, (b) performs the spectral analysis on-device to preserve privacy and minimize data transmission, (c) aggregates sparse crowdsourced measurements across a dense urban area into continuous liquefaction susceptibility maps using machine learning models informed by geological priors, and (d) integrates pre-computed site vulnerability with real-time shaking data during actual earthquakes to produce liquefaction nowcasts for emergency response.
The feasibility of smartphone-based seismic sensing has been demonstrated by the MyShake project (Kong et al., Science Advances, 2016), which detected 757 earthquakes using 81,000 smartphones worldwide, achieving median epicentral location errors of 2.7 km (Kong et al., Seismological Research Letters, 2019). Smartphone accelerometers in the Campi Flegrei volcanic area produced high-resolution ShakeMaps that resolved site amplification patterns invisible to the sparse traditional seismic network (Jozinović et al., Communications Earth & Environment, 2024). Separately, microtremor HVSR data has been used to assess liquefaction susceptibility through machine learning, with stacked ensemble models achieving 100% classification accuracy on calibrated datasets when the amplification factor and seismic vulnerability index (Kg = A₀²/f₀) are included as features (Kamal et al., Sensors, 2024). No existing system combines smartphone MEMS accelerometers with HVSR analysis for crowdsourced liquefaction mapping.
Detailed Description
1. Smartphone MEMS Accelerometer Characterization for HVSR
Modern smartphone MEMS accelerometers operate on capacitive sensing principles, measuring displacement of a proof mass suspended on silicon flexures. The key sensor models deployed across the global smartphone fleet (as of 2025–2026) and their relevant specifications for HVSR measurement are:
- Bosch BMI260/BMI270: Deployed in Samsung Galaxy S21–S26, Google Pixel 6–9 series. Noise density: 120 μg/√Hz (low-noise mode). Resolution: 0.06 mg/LSB at ±2g range. Output data rate (ODR): up to 1600 Hz. Three-axis measurement with on-chip temperature compensation.
- STMicroelectronics LSM6DSO/LSM6DSV: Deployed in Apple iPhone 12–17, various Xiaomi and OnePlus models. Noise density: 70 μg/√Hz (ultra-low-noise mode, LSM6DSV). Resolution: 0.061 mg/LSB at ±2g range. ODR: up to 6667 Hz.
- InvenSense ICM-42688-P: Deployed in various Android flagships. Noise density: 70 μg/√Hz. Resolution: 0.06 mg/LSB at ±2g range. ODR: up to 32 kHz.
Ambient seismic noise (microtremors) in urban environments has typical amplitudes of 0.1–10 mg in the 0.2–20 Hz frequency band (SESAME, 2004). The lower bound (0.1 mg at 0.5 Hz) corresponds to quiet nighttime conditions on bedrock; the upper bound (10 mg at 1–5 Hz) corresponds to daytime conditions in soft soil basins near traffic sources. For a smartphone accelerometer with 120 μg/√Hz noise density, the noise level integrated over a 1 Hz bandwidth centered on 1 Hz is 120 μg = 0.12 mg, yielding an SNR of approximately 0 dB for the quietest conditions and 38 dB for typical urban daytime conditions. This SNR is marginal for single-window HVSR estimation but sufficient when multiple 10-minute windows are averaged, because the ambient noise signal is coherent (driven by persistent urban and oceanic sources) while the accelerometer noise is random. Averaging N = 10 windows improves SNR by 10 dB (√N), bringing even quiet-condition measurements to usable levels.
The critical requirement is that the smartphone be stationary on a rigid surface during measurement. The HVSR technique assumes the sensor is coupled to the ground (or a structure rigidly connected to the ground, such as a building floor). A phone held in a hand, carried in a pocket, or resting on a soft cushion produces HVSR curves dominated by human motion or cushion resonance rather than soil response. The system detects suitable measurement conditions using the following stillness criteria:
- Jerk threshold: The time derivative of acceleration (jerk) must remain below 0.5 mg/s continuously for at least 60 seconds before a measurement window begins. This rejects hand-held, in-pocket, and in-vehicle conditions.
- Variance stability: The variance of the vertical acceleration channel over a 10-second sliding window must remain within ±20% of the mean variance, rejecting intermittent disturbances (e.g., a phone on a table that is occasionally bumped).
- Tilt consistency: The mean gravitational vector direction must remain within 2° of constant throughout the measurement window, confirming the phone is not being repositioned.
- Floor-level inference: Barometric pressure (available on all modern smartphones with Bosch BMP390 or equivalent) combined with GPS altitude provides floor-level estimation. HVSR measurements from upper floors of multi-story buildings contain building resonance modes that contaminate the soil HVSR; the system flags measurements from estimated floor levels above 3 and applies a building-resonance decontamination filter (described in Section 5).
2. On-Device HVSR Computation
The HVSR processing pipeline runs entirely on-device, transmitting only the processed spectral ratio curve. The pipeline follows the SESAME guidelines (Bard et al., 2004) with adaptations for the smartphone sensor environment:
Step 1: Data acquisition. When stillness criteria are met, the system records three-component acceleration (North-South, East-West, Vertical) at the maximum available ODR (typically 200–400 Hz for background sensor access on Android; 100 Hz on iOS via CoreMotion). The recording window is 600 seconds (10 minutes), consistent with the SESAME recommendation of a minimum window length of 10/f₀ seconds for the lowest expected f₀ of 0.3 Hz (requiring at least 33 seconds, well exceeded by the 600-second window).
Step 2: Window segmentation and anti-trigger. The 600-second record is divided into 30 non-overlapping windows of 20 seconds each. An STA/LTA (short-term average / long-term average) anti-trigger algorithm with STA window = 1 second, LTA window = 20 seconds, and STA/LTA threshold = 3.0 rejects windows containing transient disturbances (footsteps near the phone, door slams, nearby construction). Windows where any component exceeds the STA/LTA threshold are discarded. The system requires at least 20 of 30 windows to pass (67%, consistent with SESAME criteria) for a valid HVSR estimate.
Step 3: Fourier transform and smoothing. Each accepted 20-second window is detrended (linear), tapered (5% cosine taper), and transformed via FFT. The amplitude spectra are smoothed using the Konno-Ohmachi (1998) smoothing kernel with bandwidth parameter b = 40, which provides logarithmically uniform smoothing that preserves the HVSR peak shape while suppressing spectral fluctuations. The smoothed horizontal spectrum is computed as the geometric mean of the two horizontal components: H = √(H_NS × H_EW), following the SESAME recommendation.
Step 4: HVSR computation and quality assessment. The HVSR ratio is computed for each window: HVSR(f) = H(f) / V(f). The mean HVSR curve and its standard deviation are computed across all accepted windows. The system evaluates three SESAME reliability criteria: (a) f₀ > 10 / window_length (satisfied for f₀ > 0.5 Hz with 20-second windows); (b) the number of significant cycles at f₀ exceeds 200 (nc = f₀ × N_windows × window_length); (c) the standard deviation of the HVSR amplitude at f₀ is less than a factor of 2 for f₀ > 0.5 Hz or a factor of 3 for f₀ < 0.5 Hz. Measurements failing any reliability criterion are flagged as low-quality and receive reduced weight in the spatial aggregation.
Step 5: Peak extraction. The f₀ (fundamental resonance frequency) is identified as the frequency of the maximum HVSR amplitude between 0.3 and 20 Hz. The A₀ (HVSR amplitude at f₀) is recorded. Higher-mode peaks (f₁, f₂) are also extracted if they exceed an amplitude threshold of 2.0 and are separated from f₀ by at least an octave. The seismic vulnerability index Kg = A₀² / f₀ (Nakamura, 1997) is computed, which provides a direct proxy for strain amplification in the soil column during earthquake shaking.
Output packet: The transmitted data consists of: (a) the HVSR curve sampled at 128 logarithmically spaced frequencies from 0.3 to 20 Hz (128 × 2 bytes = 256 bytes for the mean curve, plus 256 bytes for the standard deviation curve); (b) extracted peak parameters (f₀, A₀, Kg, plus up to 2 higher-mode peaks, 30 bytes); (c) GPS coordinates with 50-meter random obfuscation (8 bytes); (d) estimated floor level (1 byte); (e) device model identifier (4 bytes); (f) measurement timestamp rounded to 1-hour resolution (4 bytes); (g) quality flags (2 bytes). Total: approximately 560 bytes per measurement. No raw accelerometer time series leaves the device.
3. Spatial Aggregation via Graph Neural Network
Individual smartphone HVSR measurements are spatially sparse and unevenly distributed (concentrated in residential areas, offices, and commercial districts; absent from parks, industrial zones, and undeveloped land). The system uses a graph neural network (GNN) to interpolate between observations and produce a continuous f₀/A₀ map incorporating geological priors.
Graph construction. The target area is discretized into a triangulated irregular network (TIN) with variable node spacing: 50 meters in areas with smartphone HVSR observations, expanding to 200 meters in data-sparse areas. Each node carries a feature vector containing: (a) the mean HVSR curve from all smartphone measurements within 50 meters (if any), weighted by quality score and device class calibration factor; (b) surficial geology class from the USGS or national geological survey map (categorical: artificial fill, alluvium, lacustrine, marine, colluvium, residual soil, bedrock); (c) estimated depth to water table from regional hydrogeological models; (d) topographic slope (SRTM 30-meter DEM), which serves as a Vs30 proxy (Wald and Allen, 2007); (e) distance to nearest river, coastline, or lake (alluvial proximity indicator); (f) elevation above local base level; (g) estimated sediment thickness from gravity-derived basin models where available.
GNN architecture. The system uses a message-passing neural network (MPNN) with the following structure:
- Input: node feature vectors (HVSR curve + geological features), edge features (inter-node distance, geological boundary crossing indicator)
- Message-passing layers: 4 layers of GraphSAGE (Hamilton et al., NeurIPS 2017) with mean aggregation, hidden dimension 128, residual connections, and layer normalization
- Output heads: (a) f₀ regression (scalar), (b) A₀ regression (scalar), (c) full HVSR curve reconstruction (128-dimensional), (d) Kg regression (scalar), (e) uncertainty estimate (aleatoric + epistemic, via Monte Carlo dropout with p = 0.1 at inference time)
- Loss function: multi-task loss combining f₀ MSE (log-scale), A₀ MSE, full HVSR curve L1 loss, and a spatial smoothness regularizer that penalizes f₀ gradients exceeding the physically plausible rate of change for the local geological setting
Training data. The GNN is pre-trained on cities with dense conventional HVSR surveys (Tokyo, Istanbul, Mexico City, Santiago, San Francisco, Christchurch) where thousands of traditional seismometer HVSR measurements exist alongside geological maps and borehole databases. Transfer learning adapts the model to new cities using the smartphone observations as fine-tuning data. The geological feature channels enable the model to predict HVSR characteristics in areas with no smartphone measurements by leveraging the learned relationship between geology and site response.
Continuous updating. As new smartphone HVSR measurements arrive, the node features are updated incrementally. The GNN inference is re-run on the affected subgraph (nodes within 3 hops of the updated node) rather than the full graph, enabling near-real-time map updates with latency under 5 seconds on a cloud GPU instance. Over weeks to months, the smartphone HVSR density grows, progressively reducing the GNN's reliance on geological priors and improving spatial resolution in well-sampled areas.
4. Liquefaction Susceptibility Index Computation
The GNN-produced f₀, A₀, and Kg maps are converted to a liquefaction susceptibility index (LSI) through a calibrated empirical model. The relationship between HVSR parameters and liquefaction susceptibility has been established through post-earthquake reconnaissance studies:
- f₀ threshold: Sites with f₀ < 2.0 Hz consistently show higher liquefaction incidence in post-earthquake surveys. The 1995 Kobe earthquake liquefaction was concentrated in zones with f₀ < 1.5 Hz (Huang and Tseng, 2002). In the 2011 Christchurch earthquake, 85% of observed liquefaction occurred in areas with f₀ < 1.0 Hz.
- Kg threshold: Nakamura's seismic vulnerability index Kg = A₀²/f₀ exceeding 10 indicates high susceptibility to large ground strain during earthquake loading. Values exceeding 20 are associated with severe liquefaction in historical events.
- Amplification factor: A₀ > 4 indicates significant impedance contrast between the surface sediment layer and underlying bedrock, corresponding to soft, potentially liquefiable deposits.
The system computes the LSI as a weighted combination: LSI = w₁ · F(f₀) + w₂ · G(Kg) + w₃ · H(A₀) + w₄ · D(d_wt) + w₅ · S(geology), where F, G, H are sigmoid transfer functions calibrated against borehole-verified liquefaction susceptibility classifications, D is the depth-to-water-table factor (shallow water tables increase susceptibility exponentially), and S is the surficial geology categorical weight. The weights w₁–w₅ are learned through logistic regression against a calibration dataset of sites with both HVSR measurements and CPT/SPT-based liquefaction potential indices (LPI), using the Iwasaki et al. (1982) LPI formulation as ground truth. The resulting LSI ranges from 0 (negligible susceptibility) to 1 (very high susceptibility), with classification thresholds calibrated to match the five-tier HAZUS liquefaction susceptibility categories (very low, low, moderate, high, very high).
5. Building Resonance Decontamination
Smartphones inside multi-story buildings record the combined response of the soil column and the building structure. Building resonance modes (typically 1–10 Hz for 3–30 story buildings, following the empirical relationship f_building ≈ 10/N_stories) contaminate the soil HVSR by introducing peaks that do not correspond to soil resonance. The system applies a building decontamination procedure:
Building frequency estimation. The estimated floor level (from barometric altimetry) provides the approximate number of stories above ground. The expected building fundamental frequency is estimated using the ASCE 7 empirical formula: T_building = Ct × h^x (where h is building height, Ct and x are structure-type-dependent coefficients). For a phone estimated to be on floor 5 of a concrete-frame building (h ≈ 15 m), the expected building frequency is approximately 3.3 Hz.
Spectral notch filtering. The HVSR curve is examined for peaks within ±30% of the estimated building frequency. If a peak is found in that band but not corroborated by ground-floor measurements from the same building or neighboring buildings, it is flagged as a potential building resonance artifact. The system does not remove the peak outright (which could destroy a genuine soil resonance that happens to coincide with the building frequency) but instead reduces its weight in the spatial aggregation and assigns an elevated uncertainty flag.
Cross-validation. When multiple measurements from different floor levels of the same building are available (identified by GPS clustering and different barometric altitudes), the system applies transfer function deconvolution: the soil HVSR is estimated by dividing the ground-floor HVSR by the upper-floor-to-ground-floor spectral ratio, isolating the soil response from the building response. This multi-floor deconvolution is the most reliable decontamination method but requires multiple contributors in the same building.
6. Real-Time Liquefaction Nowcasting During Earthquake Shaking
The pre-computed LSI map represents the static susceptibility of the soil under hypothetical earthquake loading. During actual earthquake shaking, the system activates a real-time nowcasting mode that combines the static susceptibility map with the measured ground motion to produce dynamic liquefaction probability estimates:
Trigger. When the MyShake-style earthquake detection algorithm (Kong et al., 2016) detects P-wave arrivals on multiple smartphones in the network, the system transitions from passive HVSR collection mode to active shaking characterization mode. All participating smartphones begin streaming peak ground acceleration (PGA), peak ground velocity (PGV, integrated from acceleration), and 5%-damped spectral acceleration at 0.3s, 1.0s, and 3.0s periods.
Liquefaction triggering model. For each grid cell in the LSI map, the system evaluates the probability of liquefaction triggering using a simplified performance-based framework. The cyclic stress ratio (CSR) is estimated from the measured PGA and estimated soil column properties (depth, total unit weight, inferred from f₀ and geological class). The cyclic resistance ratio (CRR) is estimated from the LSI and Vs30 (inferred from f₀ via the quarter-wavelength approximation: Vs30 ≈ 4 × H × f₀, where H is the sediment thickness estimated from the GNN). The factor of safety FS = CRR / CSR determines the triggering probability through a probabilistic mapping: P(liquefaction) = Φ((ln(CRR/CSR) - μ_ln) / σ_ln), where Φ is the standard normal CDF and μ_ln, σ_ln are calibration parameters from the Boulanger and Idriss (2014) probabilistic liquefaction triggering framework.
Nowcast output. Within 30 seconds of S-wave arrival (when the strongest shaking begins), the system produces a city-scale map of liquefaction probability at each grid cell, updated every 5 seconds as shaking continues and PGA/PGV measurements accumulate from the smartphone network. Grid cells transitioning from low to high probability (P > 0.5) are flagged as active liquefaction zones and pushed to emergency management systems. The nowcast map includes confidence intervals reflecting both the epistemic uncertainty in the LSI map (from GNN posterior variance) and the aleatory uncertainty in the triggering model.
Post-shaking validation. After shaking subsides, the system collects additional HVSR measurements from the smartphone network. Liquefied soils exhibit a characteristic downward shift in f₀ (due to shear modulus degradation) and a decrease in A₀ (due to increased damping in the liquefied layer). By comparing pre-earthquake and post-earthquake HVSR curves at each measurement point, the system identifies zones where soil properties changed, providing independent validation of the nowcast predictions and updated LSI maps for aftershock preparedness.
7. Device Calibration and Cross-Platform Normalization
MEMS accelerometer characteristics vary across smartphone models and even between individual devices of the same model due to manufacturing tolerances, temperature sensitivity, and aging. The system implements a multi-level calibration strategy:
- Factory calibration lookup: Each device model's published accelerometer specifications (noise density, sensitivity, cross-axis sensitivity, frequency response) are stored in a calibration database. The HVSR processing pipeline applies model-specific corrections for known frequency response deviations from flat (typically ±1 dB from 0.5 to 50 Hz for MEMS accelerometers, increasing to ±3 dB below 0.5 Hz due to AC-coupling in the readout electronics).
- Self-calibration via gravity vector: The gravitational acceleration (1g = 9.80665 m/s²) provides a continuous calibration reference. The system periodically computes the magnitude of the static acceleration vector and adjusts the per-axis scale factors to ensure |g| = 9.80665 m/s² to within 0.1%. This corrects for sensitivity drift due to temperature and aging.
- Cross-device consistency scoring: When multiple devices contribute HVSR measurements from the same location (within 20 meters, at similar floor levels), the f₀ estimates should agree within ±10% (the typical reproducibility of conventional HVSR measurements). Devices whose f₀ estimates persistently deviate from the spatial consensus are assigned reduced aggregation weights and flagged for potential sensor degradation.
- Noise floor estimation: During each measurement window, the system estimates the per-axis noise floor by computing the PSD of the vertical channel during the quietest 10-second interval (lowest RMS). This measured noise floor is compared against the expected noise floor for the device model. Devices with anomalously high noise floors (indicating sensor degradation, poor mounting, or environmental contamination) receive reduced weighting or are excluded from aggregation.
8. Privacy Architecture
The system processes raw accelerometer data exclusively on-device. No time-series data, no audio, and no identifiable sensor signatures leave the smartphone. The transmitted HVSR curve is a frequency-domain statistical summary (128-point spectral ratio averaged over 20+ windows) from which the original time-domain signal cannot be reconstructed. GPS coordinates are obfuscated by adding uniform random noise within a 50-meter radius, preventing precise device localization while preserving the spatial resolution needed for geological mapping. Device identifiers are pseudonymous (hashed with a monthly-rotating salt) and unlinkable to the user's primary account credentials. The measurement timestamp is rounded to 1-hour resolution, preventing temporal correlation attacks.
The system explicitly does not access the microphone, camera, or any communication data. The accelerometer data is accessed through the standard sensor API (Android SensorManager, iOS CoreMotion) using the lowest privilege level. On Android, no special permissions beyond ACTIVITY_RECOGNITION and ACCESS_FINE_LOCATION (for GPS tagging) are required. On iOS, CoreMotion access requires the Motion & Fitness permission.
9. Figures Description
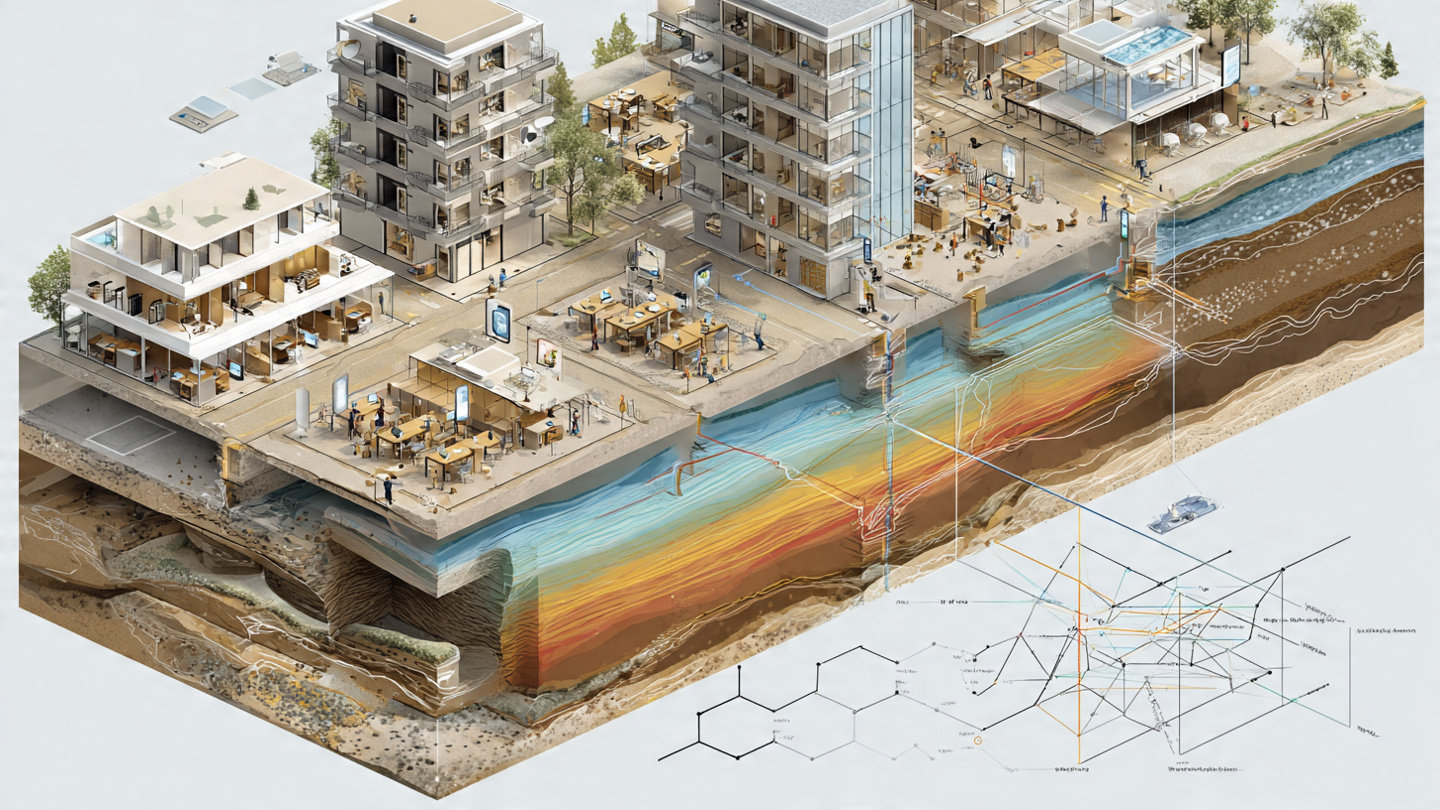
- Figure 1: System architecture overview. Left: smartphones in various indoor settings (apartment, office, cafe) with accelerometer pickup axes shown. Center: on-device HVSR processing pipeline (stillness detection → 10-minute recording → windowing + anti-trigger → FFT + Konno-Ohmachi smoothing → HVSR ratio → peak extraction → 560-byte output packet). Right: cloud aggregation with GNN interpolation over geological base map, outputting continuous f₀/A₀/Kg/LSI maps.
- Figure 2: Comparison of smartphone MEMS accelerometer noise floors (Bosch BMI260, ST LSM6DSO, InvenSense ICM-42688) against the ambient seismic noise amplitude range (Peterson New Low Noise Model to New High Noise Model) in the 0.2–20 Hz HVSR band. Shaded region shows the measurement-feasible zone where SNR > 0 dB. Insert: SNR improvement with window averaging (N = 1 to N = 20).
- Figure 3: Example HVSR curves. (a) Smartphone measurement (Samsung Galaxy S25, 4th floor office, 10-minute window) showing f₀ = 1.2 Hz, A₀ = 4.8, with building resonance peak at 3.5 Hz marked. (b) Co-located conventional broadband seismometer (Nanometrics Trillium Compact) HVSR for comparison. (c) Decontaminated smartphone HVSR after building resonance removal, closely matching the seismometer reference.
- Figure 4: GNN interpolation example over a 10 km × 10 km urban area. Left: raw smartphone HVSR measurement locations (dots colored by f₀). Center: GNN-interpolated f₀ map at 50-meter resolution, showing low-f₀ basin (purple, f₀ < 1 Hz) surrounded by higher-f₀ uplands (yellow, f₀ > 5 Hz). Right: derived LSI map with HAZUS five-tier classification overlay. Geological formation boundaries shown as dashed lines.
- Figure 5: Real-time liquefaction nowcasting sequence during simulated M7.0 earthquake. Time panels at T+10s, T+20s, T+30s, T+60s showing evolving PGA measurements from smartphone network (circles) and interpolated liquefaction probability map (red = P > 0.8, yellow = 0.3–0.8, green = P < 0.3). Known alluvial fill zones transition to high probability as PGA exceeds 0.15g.
- Figure 6: Pre-earthquake vs. post-earthquake HVSR comparison at a liquefied site. Left: pre-earthquake HVSR showing sharp f₀ = 1.4 Hz peak with A₀ = 5.2. Right: post-earthquake HVSR (24 hours after M6.5 event) showing f₀ shifted down to 0.9 Hz and A₀ reduced to 3.1, consistent with shear modulus degradation in the liquefied layer. Difference spectrum highlights the frequency band affected by liquefaction.
Claims
- A system for mapping soil liquefaction susceptibility across an urban area, comprising: a plurality of consumer smartphones, each equipped with a three-axis MEMS accelerometer, distributed across the urban area; a background processing service executing on each participating smartphone that detects periods of device stillness using accelerometer jerk, variance, and tilt stability criteria, records ambient seismic vibrations during stillness periods, computes on-device the horizontal-to-vertical spectral ratio (HVSR) of the recorded vibrations, extracts the fundamental resonance frequency (f₀) and peak amplification (A₀) of the soil column, and transmits a processed HVSR summary packet to a cloud aggregation service without transmitting raw accelerometer time series; and a cloud-based spatial interpolation engine that receives HVSR summary packets from the plurality of smartphones and applies a graph neural network model over a spatial mesh incorporating geological prior information to produce continuous maps of f₀, A₀, and a derived liquefaction susceptibility index (LSI) at a spatial resolution finer than 100 meters, without requiring boreholes, cone penetration tests, or dedicated geophysical instrumentation.
- The system of claim 1, wherein the stillness detection criteria comprise: a jerk threshold requiring the time derivative of acceleration to remain below a configurable threshold for at least 60 seconds, a variance stability criterion requiring the acceleration variance over sliding windows to remain within a configurable percentage of the mean variance, and a tilt consistency criterion requiring the gravitational vector direction to remain within a configurable angular tolerance throughout a measurement window.
- The system of claim 1, wherein the on-device HVSR computation comprises: dividing the recorded ambient vibration into a plurality of time windows, applying an anti-trigger algorithm to reject windows containing transient disturbances, computing Fourier amplitude spectra of horizontal and vertical components for each accepted window, smoothing the spectra using a Konno-Ohmachi kernel, computing the HVSR ratio as the geometric mean of horizontal spectra divided by the vertical spectrum for each window, and averaging the HVSR ratios across accepted windows to produce a mean HVSR curve with associated standard deviation.
- The system of claim 1, wherein the graph neural network model operates on a spatial mesh with nodes carrying feature vectors that include, for nodes with smartphone observations, the mean HVSR curve and quality metrics, and for all nodes, geological features comprising surficial geology class, estimated depth to water table, topographic slope, distance to nearest water body, and estimated sediment thickness, enabling the model to predict HVSR characteristics at nodes without smartphone observations by leveraging learned relationships between geological features and site response.
- The system of claim 1, wherein the liquefaction susceptibility index is computed as a weighted combination of transfer functions applied to the f₀, A₀, and seismic vulnerability index (Kg = A₀²/f₀), calibrated against a dataset of sites with collocated HVSR measurements and borehole-verified liquefaction potential indices.
- The system of claim 1, further comprising a building resonance decontamination module that estimates the floor level of the smartphone using barometric pressure measurements, identifies potential building resonance peaks in the HVSR curve based on the estimated building fundamental frequency, and either reduces the weight of contaminated measurements in the spatial aggregation or applies transfer function deconvolution when measurements from multiple floor levels of the same building are available.
- The system of claim 1, further comprising a real-time liquefaction nowcasting mode activated when earthquake shaking is detected by the smartphone network, wherein participating smartphones stream peak ground acceleration and spectral acceleration measurements, and the cloud engine combines the measured ground motion with the pre-computed LSI map to produce a dynamic liquefaction probability map updated at configurable intervals during and after earthquake shaking, enabling emergency response dispatch to zones where ground failure is predicted to be occurring.
- The system of claim 7, wherein the real-time liquefaction triggering probability is computed for each grid cell by estimating the cyclic stress ratio from the measured peak ground acceleration and estimated soil column properties, estimating the cyclic resistance ratio from the liquefaction susceptibility index and inferred shear wave velocity, and evaluating a probabilistic triggering model based on the factor of safety.
- The system of claim 1, further comprising a post-earthquake HVSR comparison module that collects smartphone HVSR measurements after earthquake shaking has subsided, identifies grid cells where f₀ has shifted downward and A₀ has decreased relative to pre-earthquake baseline measurements, and flags those cells as zones of probable soil liquefaction based on the characteristic shear modulus degradation signature, providing independent validation of the nowcast predictions.
- The system of claim 1, further comprising a device calibration module that applies model-specific frequency response corrections based on a calibration database of MEMS accelerometer specifications, performs continuous scale factor calibration using the gravitational acceleration reference, estimates per-device noise floors from the quietest intervals of each measurement window, and assigns quality-based aggregation weights that reduce the influence of devices with anomalously high noise, degraded sensors, or HVSR estimates that persistently deviate from spatial consensus.
- A method for crowdsourced soil liquefaction vulnerability assessment, comprising: deploying a background sensor service on a plurality of consumer smartphones that opportunistically records ambient seismic vibrations during detected stillness periods and computes on-device the horizontal-to-vertical spectral ratio of the recorded vibrations to extract soil column resonance parameters; aggregating the computed HVSR parameters from the plurality of smartphones using a machine learning model that incorporates geological prior information to produce a continuous spatial map of soil resonance frequency, amplification, and derived liquefaction susceptibility at sub-100-meter resolution; and, upon detection of earthquake shaking by the smartphone network, combining the pre-computed liquefaction susceptibility map with real-time ground motion measurements from the smartphones to generate a liquefaction probability nowcast map within 60 seconds of shaking onset for emergency response prioritization.
- The method of claim 11, wherein the machine learning model is a graph neural network pre-trained on cities with dense conventional HVSR surveys and geological databases, and fine-tuned for new cities using the smartphone HVSR observations as transfer learning data, enabling liquefaction susceptibility estimation in cities without prior geophysical surveys by leveraging the learned relationship between geological features and site response characteristics.
Implementation Notes
The background HVSR service can be deployed as an opt-in module within existing earthquake warning applications (ShakeAlert, MyShake, Earthquake Network) or as a standalone citizen science application. On Android, the accelerometer is accessed via SensorManager with SENSOR_DELAY_FASTEST and a custom sampling rate of 100–200 Hz; background execution requires a foreground service notification. On iOS, CoreMotion's CMMotionManager with a 100 Hz update interval provides equivalent access; background execution requires the "Motion & Fitness" capability and periodic wakeup via Background App Refresh or a Core Bluetooth keepalive.
The system provides the most value in earthquake-prone regions with alluvial basins, coastal plains, reclaimed land, and river deltas — precisely the geological settings where both smartphone density is highest (urban areas) and liquefaction risk is greatest. Target deployment cities include: Tokyo (Kanto Plain), Istanbul (Marmara basin), San Francisco Bay Area (bay mud), Mexico City (former lakebed), Lima (alluvial fan), Santiago (Mapocho basin), Jakarta (deltaic deposits), and Christchurch (Canterbury Plains). In each case, existing conventional HVSR surveys and borehole databases provide calibration data for the GNN transfer learning.
Power consumption of the HVSR service is minimal: the accelerometer draws 0.5–1.5 mA during active measurement, and the 10-minute recording window with FFT computation on a modern ARM Cortex-A78 core consumes approximately 15 mJ. At two measurement windows per day (nighttime and daytime), the daily energy cost is approximately 30 mJ, less than 0.01% of a typical 15 Wh smartphone battery. The 560-byte data transmission per measurement consumes negligible cellular bandwidth.
The GNN inference runs on a cloud GPU (NVIDIA A100 or equivalent). A city of 10 million residents with 1% smartphone enrollment (100,000 devices contributing 2 measurements/day) generates 200,000 HVSR observations per day. The spatial mesh for a 1,000 km² metropolitan area at 50-meter resolution contains approximately 400,000 nodes. Full GNN inference over the complete mesh takes approximately 2 seconds on a single A100 GPU. Incremental updates (re-running inference on the subgraph surrounding new observations) take less than 100 milliseconds per update.
Prior Art References
- Nakamura, Y. (1989) — A method for dynamic characteristics estimation of subsurface using microtremor on the ground surface. Quarterly Report of the Railway Technical Research Institute, 30(1), 25–33. Original HVSR technique paper.
- SESAME European Project (2004) — Guidelines for the implementation of the H/V spectral ratio technique on ambient vibrations. European Commission Research General Directorate.
- Kong, Q. et al. (2016) — MyShake: A smartphone seismic network for earthquake early warning and beyond. Science Advances, 2(2), e1501055.
- Kong, Q. et al. (2019) — Assessing the sensitivity and accuracy of the MyShake smartphone seismic network. Seismological Research Letters, 90(3), 1198–1207.
- Jozinović, D. et al. (2024) — Citizens' smartphones unravel earthquake shaking in urban areas. Communications Earth & Environment, 5, 535.
- Konno, K. and Ohmachi, T. (1998) — Ground-motion characteristics estimated from spectral ratio between horizontal and vertical components of microtremor. Bulletin of the Seismological Society of America, 88(1), 228–241.
- Wald, D.J. and Allen, T.I. (2007) — Topographic slope as a proxy for seismic site conditions and amplification. Bulletin of the Seismological Society of America, 97(5), 1379–1395.
- Cox, B.R. et al. (2020) — Application of microtremor horizontal-to-vertical spectral ratio (MHVSR) analysis for site characterization: State of the art. USGS Publication.
- Kamal, N.A. et al. (2024) — Improved liquefaction hazard assessment via deep feature extraction and stacked ensemble learning on microtremor data. Sensors, 24(18), 5849.
- Huang, H.C. and Tseng, Y.S. (2002) — Characteristics of soil liquefaction using H/V of microtremors in Yuan-Lin area, Taiwan. Soil Dynamics and Earthquake Engineering, 22(8), 679–691.
- Boulanger, R.W. and Idriss, I.M. (2014) — CPT and SPT based liquefaction triggering procedures. Report No. UCD/CGM-14/01, University of California, Davis.
- Iwasaki, T. et al. (1982) — A practical method for assessing soil liquefaction potential based on case studies at various sites in Japan. Proceedings, 2nd International Conference on Microzonation.
- Hamilton, W.L. et al. (2017) — Inductive representation learning on large graphs. NeurIPS 2017.
- World Bank GFDRR (2023) — Earthquake damage in Türkiye estimated to exceed $34 billion. Global Facility for Disaster Reduction and Recovery.
- Öztürk, H. et al. (2024) — Soil liquefaction and subsidence disaster in İskenderun related to the 2023 Kahramanmaraş earthquake sequence. Turkish Journal of Earth Sciences, 33.