System and Method for Estimating Snow Load, Snow Water Equivalent, and Structural Risk on Rooftop Photovoltaic Arrays Using Panel-Level Power, Temperature, and Melt-Rate Telemetry
Abstract
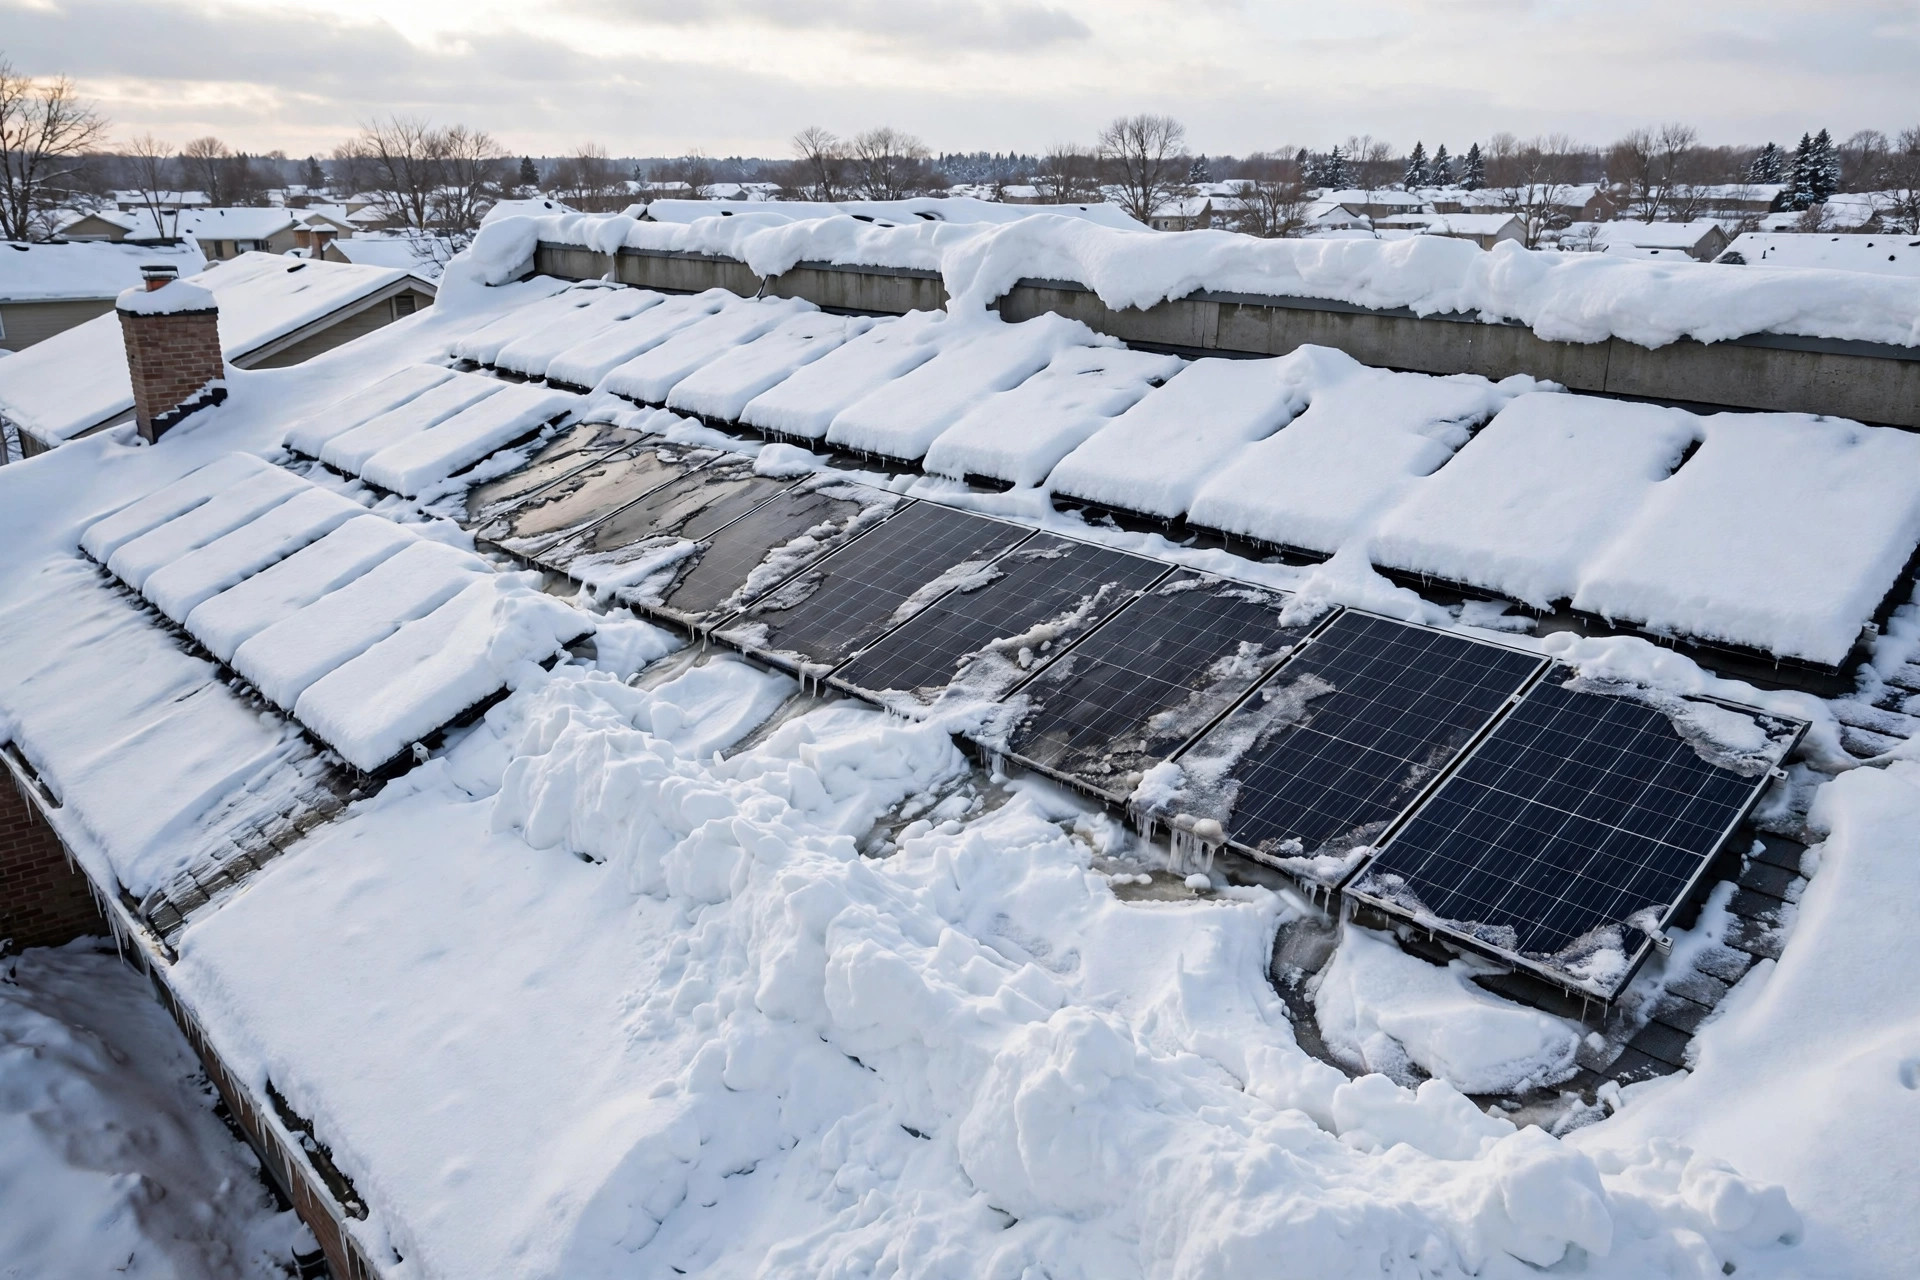
Disclosed is a system and method that turns an existing rooftop photovoltaic (PV) array into a distributed snow load sensor. No new load cell, snow scale, or roof sensor is installed. The system reads telemetry the array already produces, panel-level or string-level DC power and voltage, module temperature, and inverter status, and combines it with weather data the owner already has access to, air temperature, wind, precipitation type, and satellite or modeled irradiance. From those inputs it estimates three quantities that no single existing PV monitoring product reports: the fraction of each panel or string covered by snow, the snow water equivalent (SWE) sitting on the array, and the resulting structural load in pounds per square foot, resolved per roof zone so that drifts and valleys are priced separately from the array mean. The central observation is that panel power alone cannot see the most dangerous change in a snowpack. Once snow is thick enough to block direct light, the panel reads near zero whether the snow above it weighs 6 pounds per square foot or 18. The snow keeps gaining weight as it settles, absorbs rain, and refreezes, while the power meter stays flat. This disclosure recovers the missing weight information from two channels that do keep moving after the power signal saturates: the thermal channel, because a snow layer insulates the module and changes how its temperature responds to sun and air, and the melt channel, because the rate at which power returns during a thaw, fitted against temperature, irradiance, tilt, and wind, reveals how much water was stored in the pack. The fused output is a per-zone load estimate with staged alerts tied to the roof design snow load, a clearing order that reduces peak structural load fastest rather than merely restoring the most generation, and a slide hazard warning for the ground below the eaves when melt loosens the pack.
Field of the Invention
This invention relates to structural health monitoring of buildings and photovoltaic system monitoring, specifically to estimating snow load and snow water equivalent on rooftop solar arrays from electrical and thermal telemetry already produced by inverters, module-level power electronics, and weather feeds, and to using those estimates for structural risk alerting, snow clearing prioritization, and slide hazard warning.
Background
Snow on rooftop solar is usually discussed as an energy problem, and on that framing it looks minor. A five-year study at the Northern Alberta Institute of Technology found annualized energy loss from snow accumulation of 3 to 6 percent, small because most annual generation happens in spring and summer (Otter Energy summary of the NAIT study). Measured monthly losses tell a different story at the timescale that matters for a roof: a study of six PV systems in Colorado and Wisconsin measured monthly snow losses as high as 90 percent, with annual losses of 1 to 12 percent (Marion et al., Solar Energy, 2013). The monthly figure is the structural figure in disguise. A month at 90 percent loss is a month with a snowpack sitting on the roof, and a snowpack is weight.
Roof design in the United States prices that weight through ASCE 7. The flat roof snow load is pf equals 0.7 times Ce times Ct times Is times pg, where pg is the ground snow load for the site, Ce adjusts for wind exposure, Ct for the thermal condition of the roof, and Is for the importance of the building (ASCE 7-16 snow load summary). Design values vary widely by region, from under 20 pounds per square foot in the south to 100 or more in northern snow country. A rooftop PV array changes the inputs to that formula in ways the design calculation, done once before the array existed, does not revisit. Panels shade the roof and keep it colder, which pushes the thermal factor up. Rails and panel edges catch wind-blown snow and create drifts. Parapets, valleys, and the step between an upper and a lower roof concentrate snow exactly where the array's lower strings sit. And the load the code checks is a balanced load plus drift surcharges, while the load that actually fails a roof is often the drift: a local pile two or three times the mean, sitting over a midspan rafter, after a rain-on-snow event doubled its density overnight.
Density is the variable that turns a familiar snow depth into an unfamiliar load. Fresh snow falling in calm conditions runs about 50 to 70 kilograms per cubic meter; settled snow runs 200 to 300; wind-packed snow runs 350 to 400 (USGS snow density ranges via vCalc). A 30 centimeter snowfall therefore weighs very differently depending on its history. Fresh at 100 kilograms per cubic meter, it holds 30 millimeters of snow water equivalent, about 6.1 pounds per square foot. Settled and rain-loaded at 300 kilograms per cubic meter, the same 30 centimeters holds 90 millimeters of water equivalent, about 18.4 pounds per square foot, triple the load at identical depth and identical appearance from the ground. No homeowner measures this. Snow depth is visible from a window; density is not, and density is what the roof feels.
Existing PV snow models estimate energy loss, not load. The snow coverage model integrated into NREL's System Advisor Model (SAM) predicts when snow slides off an array from daily snow depth plus hourly irradiance and temperature, and it does that job well for generation forecasting. It does not invert the array's own telemetry into a load estimate, does not resolve drifts between strings, does not estimate density from melt behavior, and does not compare the result against a roof design load. Snow scales and load cells exist for research roofs and avalanche stations; they are not installed on homes, and retrofitting them under an existing array means roof penetrations a homeowner will not approve. Meanwhile the sensor that could answer the question is already on the roof, wired, powered, and reporting every few minutes: the array itself.
What the art lacks is a method that treats the PV array as the snow sensor: coverage fraction from temperature-corrected power deficit, depth and density from thermal and melt-rate inversion, per-zone load from string-level spatial patterns, and structural comparison against the site design load with clearing guidance ordered by structural benefit. That is what this disclosure provides.
Detailed Description
1. Inputs and System Architecture
The preferred embodiment is software only. It consumes three data streams and installs no hardware. First, inverter or module-level power electronics telemetry at 5 to 15 minute resolution: DC power, DC voltage, and DC current per string or per module, plus inverter status flags for clipping, curtailment, faults, and nighttime shutdown. Second, module temperature where available, either a backsheet sensor on at least one module per roof plane or the inverter's cell temperature estimate, plus ambient air temperature from a local weather station, a weather API, or the inverter's own ambient sensor. Third, weather context: precipitation type and timing, wind speed and direction during each storm, plane-of-array irradiance from a satellite or modeled clear-sky source, and the site design snow load pg where the owner or installer supplies it (from the permit, the structural drawings, or the local building department table), defaulting to a conservative regional estimate with an explicit uncertainty flag when unknown.
A second embodiment adds one low-cost reference sensor: a small unshaded irradiance sensor or a single reference module kept clear, mounted on the same roof plane. The reference channel separates cloud from snow, which matters on overcast storm days when every string reads low. A third embodiment is a fleet aggregator run by an insurer, installer, or municipality: anonymized per-site load estimates after a regional storm, mapped to streets or parcels, used to prioritize inspections and to validate which neighborhoods actually carried drift loads near design values. In all embodiments only derived features leave the home: coverage fractions, load estimates, and alerts, never raw household consumption traces.
2. Baseline Learning and Coverage Fraction
Before the first snow, the system learns each string's snow-free behavior over at least two clear weeks: expected power as a function of modeled plane-of-array irradiance, cell temperature, and sun angle, fitted per string. This absorbs the differences that would otherwise masquerade as snow: a string that always runs 4 percent low because of a chimney shadow, an older module, or a longer DC run. Soiling is learned as a slow drift in the same baseline, updated only on dry, snow-free days, so that a gradual dust film is never mistaken for a sudden snow event.
During a snow event, the coverage fraction f for each string is estimated from the temperature-corrected power deficit: expected clear-sky power minus measured power, divided by expected power, then corrected for the nonlinear response of a partially covered string. The nonlinearity matters and is the reason a naive deficit reading misleads. A string with bypass diodes does not lose power in proportion to covered area. A small opaque patch across one cell substring can take out a third of a module's output while 90 percent of its glass is clear, and a uniform thin snow layer that transmits diffuse light loses far less power than its area suggests. The system therefore classifies each string into one of three regimes from the joint power and voltage signature before converting deficit to coverage. In the uniform regime, power falls smoothly with little voltage step change, consistent with diffuse transmission through a thin layer. In the patchy regime, voltage drops in discrete steps as bypass diodes activate, and the step count locates how many substrings are covered. In the opaque regime, power is near zero and voltage collapses, and coverage is reported as saturated, at or above the threshold where further weight is invisible to power. The regime label travels with every estimate downstream, because a saturated string's load must come from the thermal and melt channels, not from power.
3. The Thermal Channel: Depth from Insulation
A snow layer insulates the module beneath it. On a clear, cold morning after a storm, an uncovered module warms quickly in direct sun: its backsheet temperature rises tens of degrees above ambient within an hour. A module under 10 centimeters of snow barely moves, because the snow blocks the sun and buffers the module from the air. The system models this with a simple thermal resistance: module temperature responds to absorbed irradiance and ambient temperature through a resistance that grows with snow depth and falls with snow density, since dense wet snow conducts heat better than fluffy dry snow. Fitting the morning warm-up curve per string, with irradiance and ambient temperature as known inputs, yields a thermal resistance estimate, which converts to a depth proxy once calibrated against the melt channel (section 4) during the first thaw of the season.
The thermal channel also separates snow from ice, which the power channel cannot. A glaze ice layer transmits almost no light, like snow, but it conducts heat far better and it does not melt on the same schedule. A string whose power is zero, whose thermal resistance is low for its apparent coverage, and whose power stays zero through a warm sunny day that clears its neighbors is flagged as probable ice, not snow, with a higher density assumption (near 900 kilograms per cubic meter) and a longer persistence forecast. Ice on a low-slope array is also the case where clearing by hand is most dangerous, and the alert text says so rather than sending the owner onto an icy roof.
4. The Melt Channel: Density from How the Pack Disappears
The melt channel is the core measurement, and it works only because the system waits. During a thaw, defined as air temperature above freezing with plane-of-array irradiance above 200 watts per square meter, each string's coverage fraction recovers from saturated toward zero. The recovery curve is fitted to an energy balance model: melt rate is proportional to absorbed solar energy plus a temperature-driven term, minus refreeze at night, with coefficients that depend on tilt, aspect, wind, and whether the string sits in a drift shadow. The total area under the recovery curve, that is, how long the string takes to clear at a known energy input, is proportional to the SWE that was stored. A pack that clears in one sunny afternoon held little water. A pack that takes three days of identical weather held roughly three times as much. Fitting the curve therefore returns SWE per string without ever weighing the snow.
Two refinements make the fit robust. First, sliding is modeled separately from melting. Snow on a tilted array often leaves as a slab, producing a step recovery in minutes, while melt produces a gradual ramp over hours. The classifier separates step recoveries from ramp recoveries; a step recovery bounds SWE from below but does not measure it, and the system reports the pre-slide estimate with a wider uncertainty band rather than pretending the slide was melt. Second, rain-on-snow is detected as a distinct event signature: air temperature above freezing, precipitation reported as rain, power still saturated, and thermal resistance falling as the pack densifies. A rain-on-snow flag raises the density estimate toward the settled and wet range and raises the load estimate even though no new snow fell and no power changed, which is exactly the case the power meter misses and the roof feels.
5. Worked Example: The Load the Power Meter Cannot See
Consider a south-facing string of ten modules on a 30 degree roof, in a jurisdiction with a ground snow load pg of 35 pounds per square foot and a flat roof design load pf of about 25 pounds per square foot after exposure and thermal factors. A storm deposits 30 centimeters of snow. On the first morning the string reads near zero power, saturated, and the naive reading is simply "covered." The thermal channel estimates a deep pack; the density prior for fresh snow is 100 kilograms per cubic meter, giving 30 millimeters of SWE and 6.1 pounds per square foot, comfortably below design.
Over the following week the pack settles, a warm rain falls on it, and it refreezes. Power stays at zero throughout, because the pack was already opaque. When the thaw finally arrives, the string takes three days to clear under weather that clears a reference thin pack in one day. The melt fit returns about 90 millimeters of SWE, which is 18.4 pounds per square foot on average across the string. That is still below the 25 pound design load, and a mean-only system would report all clear. But the string-level map shows the lowest two modules, sitting in the valley drift, clearing a full day later than the rest of the string. Their fitted SWE is about 1.8 times the string mean, giving a local load near 33 pounds per square foot, above the design load, concentrated over the same roof bay for the whole week. The system alerts on the drift zone, not the mean, names the valley bay, and recommends clearing that bay first. This is the failure mode the disclosure exists to catch: a mean load that looks safe, a local load that is not, and a power meter that reported nothing new for seven days while the danger tripled.
6. Per-Zone Load Map and Structural Comparison
Load is computed per string and then mapped to roof zones using the installer's string layout: roof plane, tilt, aspect, distance to parapet, valley, eave, and ridge, and position relative to the prevailing storm wind direction. Each zone's load in pounds per square foot is SWE in millimeters multiplied by 0.2048. Drift zones are identified two ways: spatially, from string-to-string variance within a roof plane that persists across storms with the same wind direction, and temporally, from strings that systematically clear last. A persistent last-to-clear pattern is treated as drift evidence even before any single storm looks extreme, because the same bay will drift again.
Comparison against design load uses staged thresholds on the zone load, not the array mean. Advisory at 50 percent of design load: log the event and note the zone for the next inspection. Watch at 75 percent: notify the owner with the zone map and the melt-fit uncertainty. Act at 90 percent: recommend professional clearing of the named zone, warn against roof access in ice or high wind, and, where the owner has opted in, notify the installer or insurer. A differential threshold fires independently of the absolute thresholds: if any zone exceeds 1.5 times the array mean load, it is flagged as a drift even at moderate absolute load, because differential loading, not uniform loading, drives the bending and ponding failures that matter. All thresholds are reported with their uncertainty bands, and the alert text states the dominant uncertainty source, usually the density prior before the first melt fit of the season and the slide correction after a slab release.
7. Clearing Prioritization and Slide Hazard Warning
When clearing is recommended, the system orders zones by structural benefit per unit of clearing effort, not by generation recovery. Benefit is zone load above the watch threshold multiplied by a structural weight for the zone: valley and lower-roof bays and midspan bays weight higher than ridge bays, and zones above living space weight higher than zones above a garage. A zone that is heavy but small and above a bedroom outranks a zone that is light but large and above an unoccupied porch, even though clearing the large zone would restore more watts. The clearing order is presented as a ranked list with the expected load reduction per zone, so a contractor who clears only the first two zones still removes the worst of the risk.
Separately, the system issues a slide hazard warning when three conditions coincide: a string shows a step recovery or a partial release, air temperature is above freezing, and the roof slope and snow condition match the slide regime for that array (tilt above about 20 degrees with a wet, dense pack). The warning names the eave line below the releasing string and the ground hazard zone, and it advises keeping people, vehicles, and pets clear of that eave line until the pack has either fully released or refrozen. Slide warnings are deliberately conservative: a false warning costs a moved car, while a missed slab release above a walkway costs far more.
8. Confounds and Exclusions
Cloud cover is the main confound, and it is handled by the clear-sky model plus the reference channel, not by assuming every low-power day is snow. A day when all strings, including the reference, read low against modeled irradiance is cloud, and no coverage is inferred. Inverter clipping is excluded: intervals where the inverter is at its AC power limit carry no information about snow, because a clipped string reads the same with or without a thin snow layer. Curtailment, export limits, and grid outages are excluded by status flag. Module degradation and permanent soiling are absorbed by the snow-free baseline, which is refitted each autumn before the first storm. Arrays with a single string and no module-level electronics still work, but at roof-plane resolution only: the drift channel degrades to a plane-level estimate with a wider uncertainty band, and the disclosure states that limitation in the output rather than inventing string resolution the hardware cannot support.
Ground-mounted arrays are excluded from the structural comparison, since their load path is a rack foundation, not a roof, though the SWE estimation still applies for generation forecasting. Flat commercial roofs with ballasted arrays are a separate case: ponding and drift around ballast trays dominate, and the zone map must be built from the tray layout, not the string layout. The system flags flat-roof ballasted sites for a site-specific configuration step instead of applying the pitched-roof zone weights blindly.
9. Figures Description
- Figure 1: System block diagram showing inverter and module-level telemetry, module temperature, weather feeds, the baseline learning module, the coverage estimator, the thermal channel, the melt channel, the per-zone load map, and the alerting and clearing prioritization layer.
- Figure 2: Power and voltage signatures for the three coverage regimes: uniform thin snow with smooth power decline, patchy snow with discrete bypass-diode voltage steps, and opaque snow with collapsed power and voltage.
- Figure 3: Morning warm-up curves for an uncovered module, a module under thin snow, and a module under a deep pack, showing how thermal resistance grows with snow depth.
- Figure 4: Melt recovery curves for three packs of different SWE under identical thaw weather, showing how time to clear reveals stored water, plus a step recovery curve for a slab slide.
- Figure 5: Worked example roof map: string mean load below design, valley drift zone above design, with the clearing order ranked by structural benefit.
- Figure 6: Rain-on-snow event timeline: power flat at zero throughout, density and load estimates rising during the rain, and the resulting alert that fires with no change in the power signal.
Claims
- A system for estimating snow load on a rooftop photovoltaic array, comprising: an inverter or module-level power electronics unit reporting DC power and voltage per string or per module; a processor configured to compute a temperature-corrected expected power from modeled plane-of-array irradiance, estimate a snow coverage fraction from the deficit between expected and measured power, and convert the coverage fraction into a snow load estimate.
- The system of claim 1, wherein the processor classifies each string into a uniform, patchy, or opaque coverage regime from the joint power and voltage signature, using discrete voltage steps to identify bypass diode activation in the patchy regime, and reports saturated coverage in the opaque regime rather than inferring load from power alone.
- The system of claim 1, further comprising a thermal channel wherein the processor fits a module warm-up curve against irradiance and ambient temperature to estimate snow thermal resistance, converts the resistance to a snow depth proxy, and distinguishes snow from ice by thermal resistance and melt persistence.
- The system of claim 1, further comprising a melt channel wherein the processor fits the power recovery curve during a thaw against temperature, irradiance, tilt, and wind to estimate snow water equivalent per string, and wherein the fitted snow water equivalent is converted to structural load in pounds per square foot at 0.2048 pounds per square foot per millimeter of snow water equivalent.
- The system of claim 4, wherein the processor separates step recoveries caused by slab sliding from ramp recoveries caused by melting, and reports a wider uncertainty band for snow water equivalent estimated from a step recovery.
- The system of claim 4, wherein the processor detects rain-on-snow events from above-freezing temperature with reported rain precipitation while power remains saturated, and raises the density and load estimates for the event without requiring new snowfall or a change in measured power.
- The system of claim 1, wherein the processor maps string-level load estimates to roof zones using string layout, parapet, valley, eave, and ridge positions, and prevailing storm wind direction, and identifies drift zones from persistent string-to-string variance and last-to-clear patterns.
- The system of claim 7, wherein the processor compares each zone load against a site design snow load and issues staged alerts at fractions of the design load, and issues a drift alert when any zone load exceeds 1.5 times the array mean load regardless of absolute load.
- The system of claim 7, further comprising a clearing prioritization module that orders roof zones by structural benefit, defined as zone load above a threshold multiplied by a structural weight for the zone, and presents the expected load reduction per zone.
- The system of claim 1, further comprising a slide hazard module that issues a ground hazard warning for the eave line below a releasing string when a step recovery coincides with above-freezing temperature on a tilted array with a wet, dense pack.
- A method for estimating snow water equivalent on a rooftop photovoltaic array without a dedicated snow sensor, comprising: learning a snow-free power baseline per string; estimating coverage fraction from temperature-corrected power deficit during a snow event; fitting a melt recovery curve during a subsequent thaw to estimate snow water equivalent; and converting the snow water equivalent to a per-zone structural load.
- The system of claim 1, implemented as software consuming existing inverter telemetry and weather feeds with no additional roof hardware, or as a fleet aggregator producing anonymized per-site load estimates mapped after a regional storm for inspection prioritization.
Prior Art References
- Otter Energy, "Solar Panels in Winter (Part 2): Snow Load and Irradiance": NAIT five-year study, annualized snow energy loss of 3 to 6 percent; tilt matters more than snowfall amount for shedding
- Marion, Schaefer, Caine, and Sanchez, "Measured and modeled photovoltaic system energy losses from snow for Colorado and Wisconsin locations," Solar Energy, 2013: monthly snow losses up to 90 percent, annual losses 1 to 12 percent; model using daily snow depth plus hourly irradiance and temperature to predict sliding
- ASCE 7-16 snow load summary: flat roof snow load pf equals 0.7 times Ce times Ct times Is times pg; ground snow load ranges from under 20 pounds per square foot in the south to 100 or more in northern snow country
- USGS snow density ranges via vCalc: fresh snow 50 to 70 kilograms per cubic meter, settled snow 200 to 300, wind-packed snow 350 to 400; snow water equivalent equals depth times density
- Ryberg and Freeman, "Integration, Validation, and Application of a PV Snow Coverage Model in SAM," NREL/TP-6A20-68705: snow coverage modeling for generation forecasting from snow depth, irradiance, and temperature
- ASCE/SEI 7-16, Chapter 7, Snow Loads: ground snow load, exposure factor, thermal factor, importance factor, drift and sliding snow provisions for roof design
- Standard photovoltaic module behavior: bypass diodes activate under partial shading and produce discrete voltage steps; cell temperature correction uses the manufacturer temperature coefficient from the module datasheet
- Unit conversion used throughout: 1 millimeter of snow water equivalent equals 1 kilogram per square meter, which equals 0.2048 pounds per square foot
Implementation Notes
Build notes for whoever implements this. Ship the baseline first and the load estimate second. The system is useless, and worse than useless, if it has not learned the array's snow-free behavior before the first storm, because every pre-existing quirk of the array will read as snow. Require two clear weeks of baseline, refit every autumn, and refuse to issue a load verdict on a string with no baseline, reporting "no baseline" instead of a number. Do not ship the power channel without the melt channel. A power-only snow load product will report the same load on day one and day seven of a rain-loaded pack, and the first roof that fails under a pack the product called stable will end the product. The melt fit is the measurement; power is the trigger that starts the watch. Calibrate the thermal channel against the melt channel, not against a snow ruler the owner does not own: the first thaw of the season gives you a free calibration event on every roof, and the calibration transfers to later storms on the same array. Present every load with its uncertainty band and its dominant source, and never present a zone load as a structural engineering verdict. The output is a prioritization and warning tool for owners, installers, and inspectors; a licensed structural engineer decides whether a roof is safe, and the alert text should say that in plain words. On ice, do not recommend roof access at all. On any roof above a single story, recommend a contractor with fall protection rather than the owner with a roof rake. The clearing order exists so that the contractor's first hour removes the worst load, not the most watts, and the slide warning exists so nobody is standing under the eave when the pack lets go.