System and Method for Quantifying Asphalt Shingle Granule Loss and Estimating Remaining Roof Service Life Using Smartphone Camera Texture Analysis
Abstract
Disclosed is a system and method for quantifying mineral granule loss on asphalt shingles using only the camera of a commodity smartphone, with no laboratory testing and no dedicated instrumentation. A reference card of known dimensions and color patches is placed on the shingle surface within the camera frame to normalize scale and illumination. Image analysis combines gray-level co-occurrence matrix (GLCM) texture features, specular reflectance uniformity, and an exposed-mat pixel fraction computed from color segmentation. Differential calibration compares measurements across roof planes of the same structure, using the least-weathered plane as an internal aging baseline that reduces manufacturing variability and isolates environmental degradation.
Per-location Granule Retention Index values feed into a roof-level granule loss map. A remaining-service-life model fits longitudinal repeat-survey data to a degradation curve and reports an estimated remaining life with confidence bounds. A spatial-pattern classifier distinguishes uniform UV and thermal aging, localized hail bruising, linear foot-traffic wear paths, and uniform early-life manufacturing defects, and is intended to give the homeowner a proposed cause and a suggested action.
Technical Field
This disclosure relates to roofing condition assessment, specifically to quantitative measurement of asphalt shingle granule loss using smartphone cameras, image texture analysis, differential in-situ calibration, and degradation modeling to estimate remaining roof service life.
Background
Asphalt shingles are a four-layer composite: a fiberglass mat, oxidized or modified asphalt coating on both faces, ceramic-coated mineral granules embedded in the top asphalt surface, and fine mineral back-surfacing. Mineral granules do the durability work. They block ultraviolet radiation from reaching the asphalt (UV catalyzes oxidation that makes asphalt brittle), add fire resistance, and provide color and texture. A shingle that has lost its granules is a shingle on a countdown. Exposed asphalt then embrittles, cracks under thermal cycling, and eventually admits water.
Industry practice treats granule loss as the leading field proxy for shingle aging. Granule adhesion is measured in the laboratory under ASTM D4977, which weighs granules dislodged by controlled abrasion. Manufacturer technical documentation from GAF and Owens Corning identifies granule loss as a key weathering indicator tied to manufacturing factors, thermal cycling, and UV exposure. Aging studies from the Insurance Institute for Business & Home Safety (IBHS) document how UV exposure, thermal cycling, and granule loss interactively degrade impact resistance over time.
But field assessment today is qualitative. A roofer looks at the roof and reports "bald spots" by eye. A homeowner is told a roof "has about five years left" on the strength of a glance and a remembered installation date. Granule accumulation in gutters and downspout outlets is the most common quantitative hint homeowners get, and it is indirect: it measures shedding into the drainage path, not retention on the field. ASTM D4977 remains the standard objective measurement, but it requires sending a shingle to a laboratory. Nothing in the art gives a homeowner a per-location number for granule retention, a map of where the roof is aging fastest, a cause classification for the observed wear, and a remaining-life estimate tied to measured data.
Related disclosures address adjacent problems but not this one. LITF-PA-2026-177 discloses attic-mounted acoustic sensing to score per-storm hail damage severity, including a granule-loss sub-score derived from cumulative sub-fracture impact energy. That system estimates storm-specific damage from the inside of the structure using impact acoustics. This disclosure measures accumulated granule retention directly from the shingle surface using images, tracks multi-season UV and thermal aging independent of any storm, and estimates remaining service life. Aerial measurement services (e.g., EagleView) derive roof geometry and dimensions from satellite and aerial imagery, not granule-level surface texture. Color-based condition checklists in contractor apps record subjective ratings. No known method performs quantitative texture-based granule retention measurement with a consumer phone.
Filling the gap is a complete field-deployable method that: (a) quantifies granule retention per location from a phone photograph; (b) normalizes scale and illumination with a simple in-frame reference; (c) calibrates against the roof's own least-weathered plane to reduce manufacturing variability; (d) distinguishes aging, hail, traffic, and manufacturing causes by spatial pattern; and (e) converts longitudinal measurements into a remaining-life estimate with uncertainty.
Detailed Description
1. Image Acquisition Protocol
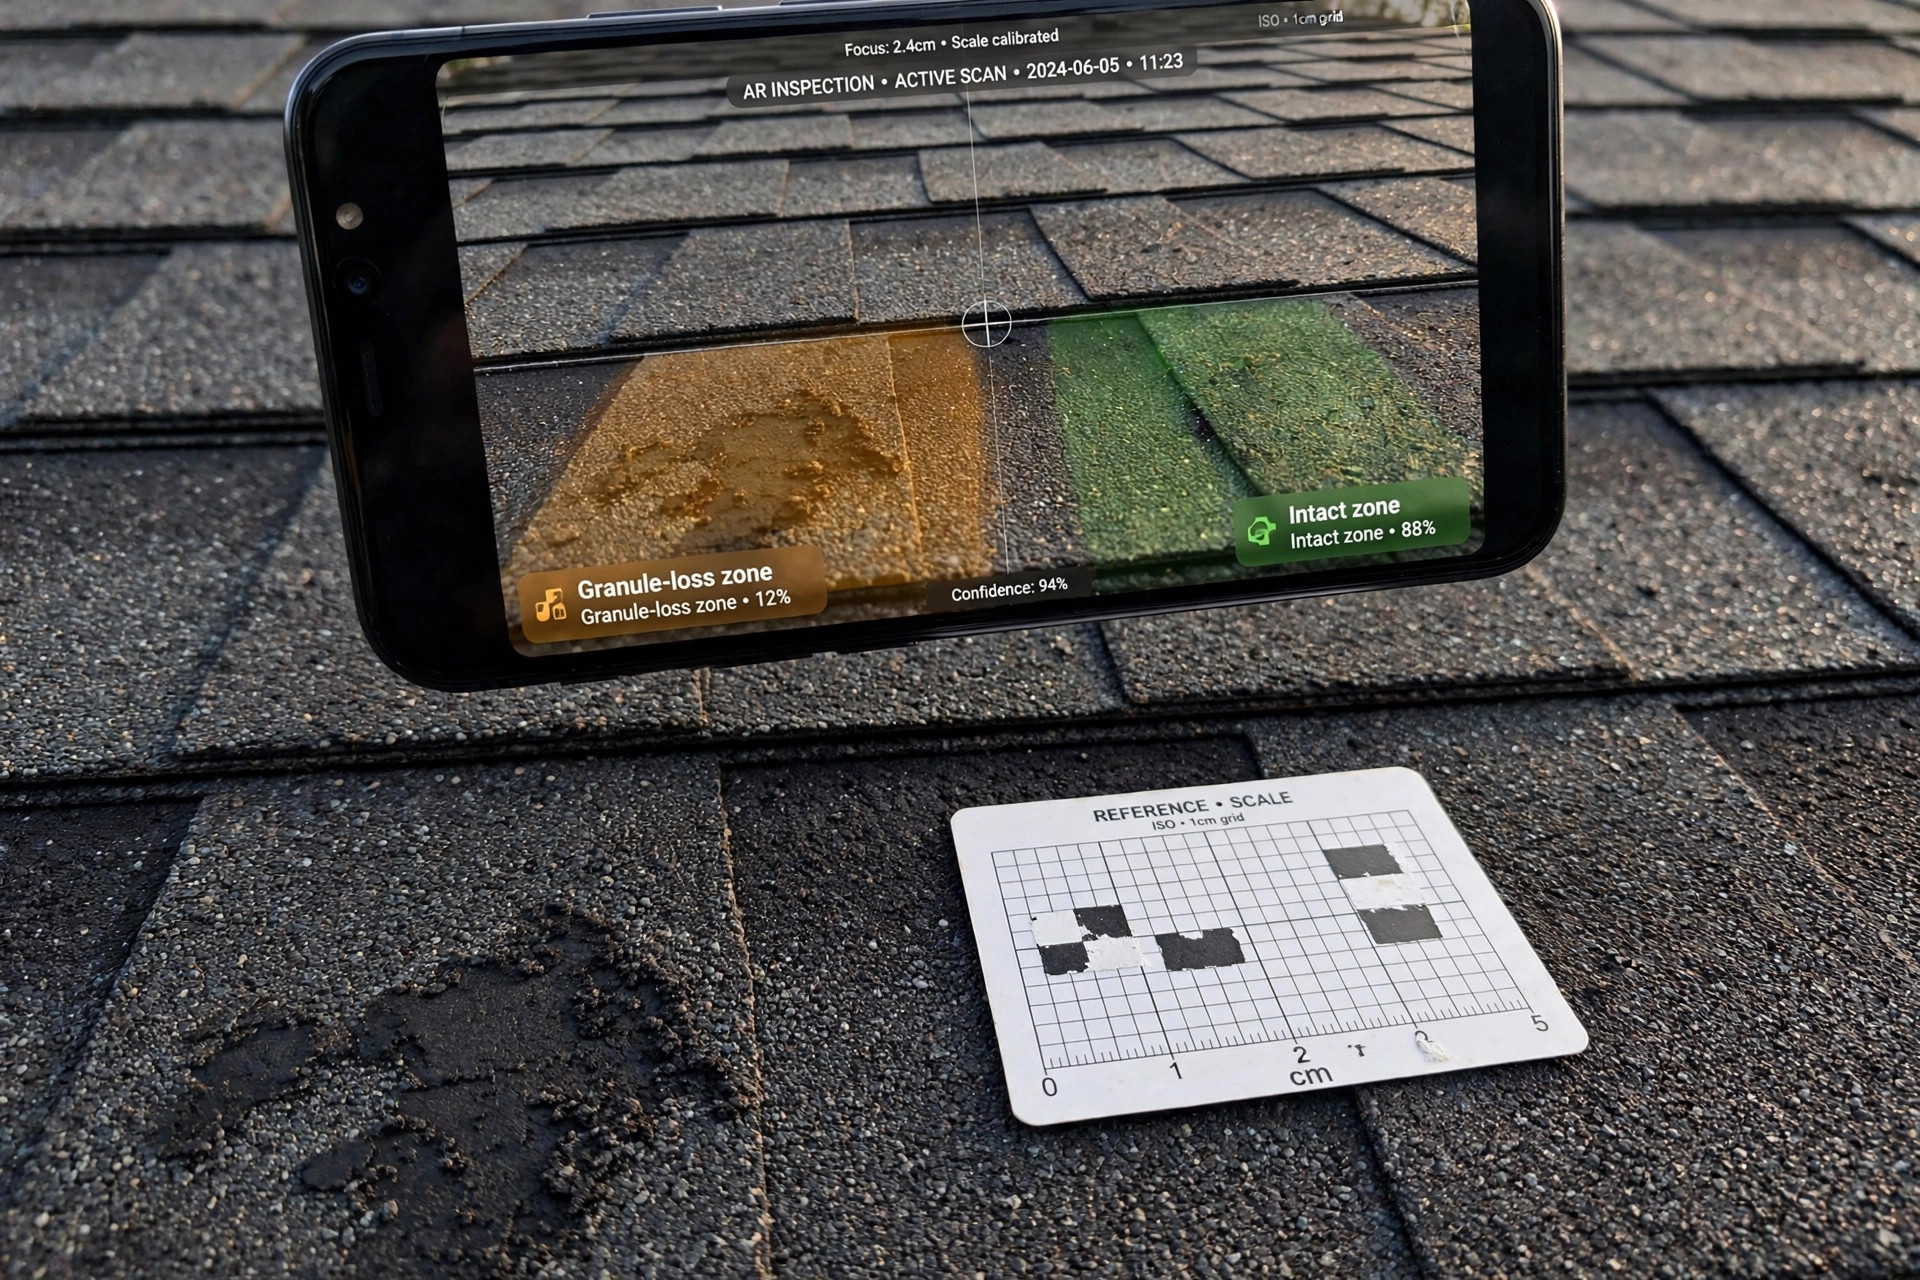
At each survey location, the user places a flat reference card on the shingle surface. Printed on the card are a centimeter scale and six neutral gray patches with known reflectance values; a credit-card-sized card serves both functions and doubles as a white-balance target. Holding the smartphone camera 25-40 cm above the shingle, perpendicular to the surface, with the card in frame, the user follows an on-screen outline that guides framing while the app confirms focus before capture. Built-in flash stays disabled, because flash speculars saturate granule texture and destroy the reflectance-uniformity measurement described in Section 3. Each location yields three bracketed exposures. Recommended lighting is overcast sky or late-morning sun at 40-70 degrees elevation (recommended parameters, not empirically validated); the app checks GPS time and warns when the sun is near noon in summer (specular blowout) or near the horizon (long shadows). Capture is permitted only when the roof surface is fully dry, with no rain within the preceding 24 hours, and the app rejects captures showing wet-sheen signatures, because wet shingles read darker and shinier and would masquerade as severe granule loss. The wetness-reject check keys on the combination of albedo darkening against the card's gray patches and uniformly elevated sheen, which distinguishes a water film from dry granule loss (patchy sheen without the albedo drop). All acquisition parameters in this section are design parameters chosen for feasibility, not validated optima.
Recommended survey density is 8-12 locations per 1,000 square feet of roof (a starting design parameter), with every safely accessible roof plane represented and stratified by course elevation at a minimum of 4-6 locations per plane, plus ridge-adjacent, eave-adjacent, and valley-adjacent positions. Locations reachable from a ladder at the eave are acceptable; where the roof is safely walkable, the remainder are photographed directly. Walking a roof carries fall risk: the app should steer users toward professional inspectors for steep or high roofs and limit self-survey to roofs the user can safely reach from a ladder or a low-slope surface. A telescoping painter's pole fitted with a rigid phone mount may supplement hard-to-reach areas, but pole captures receive wider confidence intervals, because the perspective correction in Section 2 fixes geometry, not motion blur or shifting specular response, and the app applies stricter Laplacian-variance blur gating to pole captures. GPS, compass heading, and roof-plane azimuth are recorded for each capture to identify which plane each location belongs to.
2. Scale and Illumination Normalization
Reference-card detection uses the card's high-contrast border; the app reads the centimeter ticks to compute pixels-per-millimeter at the shingle plane and corrects residual perspective with a homography when the phone is not perfectly perpendicular. Using the six gray patches, the app establishes the illumination white point and exposure response for that frame, then maps pixel values to relative reflectance before any texture computation. This normalization is intended to make a 10 AM July capture comparable to a 3 PM October capture on the same roof (cross-season comparability requires field validation). That comparability is what makes longitudinal trending possible.
3. Texture Feature Extraction
Each normalized image is analyzed in a grid of 128×128-pixel tiles (approximately 10–16 mm × 10–16 mm at the 25-40 cm capture distance, computed from the card-measured pixels-per-millimeter for each frame rather than assumed). Four complementary measurements are computed per tile:
- GLCM texture features: gray-level co-occurrence matrices at 0, 45, 90, and 135 degrees, computed at multiple offsets (2, 5, and 12 pixels) to probe sub-granule correlation, granule-scale texture, and multi-granule coarseness respectively, yielding contrast, entropy, homogeneity, and correlation (Haralick features). The granule features of interest sit at roughly 0.5-3 mm (5-32 pixels), so the multi-scale offsets bracket the informative scale while the 2-pixel offset captures fine within-granule correlation. Intact granule coverage produces high-contrast granular texture with high entropy. As granules shed, the smoother underlying asphalt dominates and the tile moves toward lower contrast and lower entropy. A classifier (for example a random forest) trained on implementer-provided labeled reference tiles maps the multi-scale features to a tile-level granule retention score. Labeled reference tiles are produced by correlating field photographs with laboratory ASTM D4977 granule-adhesion measurements on matched shingle samples from the same production lot, binned into retention score bands. Because ASTM D4977 measures granule adhesion (mass loss under abrasion) rather than optical retention, the implementer must establish the transfer function mapping adhesion measurements to retention score bands; the disclosed correlation assumes a monotonic relationship, which is itself a hypothesis to validate.
- Exposed-mat pixel fraction: color segmentation in CIELAB space separates ceramic-coated granules (which carry strong chromatic signal) from exposed asphalt (near-black, low chroma) and exposed fiberglass mat (gray, higher lightness). Within each tile, the fraction of pixels classified as asphalt or mat gives an image-based estimate of granule coverage. CIELAB thresholds are color-family-specific and calibrated against the roof's internal plane baseline described in Section 4, not global constants.
- Specular uniformity: granules scatter light in all directions; intact coverage produces diffuse, uniform reflectance. Where granules are lost, the smoother asphalt shows directional sheen that varies with local micro-geometry. The coefficient of variation of luminance across the tile, computed after white-point normalization, flags tiles where sheen betrays granule loss that color segmentation alone might miss on dark-colored shingles. Because flash is disabled, the specular signal comes from the sun; the app records sun azimuth and elevation per capture and normalizes the coefficient-of-variation against the expected specular response for that geometry.
- Tile-level fusion: the three measurements are combined in a logistic model to produce a per-tile Granule Retention Index (GRI) from 0 (fully stripped) to 100 (intact), calibrated so that GRI 100 corresponds to the measured texture of new, in-specification shingles (design mapping; implementers establish it against their own reference tiles).
4. Differential Cross-Plane Calibration
Manufacturing variation means absolute GRI values differ between shingle production lots and colors, so a fixed global scale would misclassify roofs. Instead, the system calibrates each roof against itself. As the internal new-equivalent baseline it adopts the median GRI of the least-weathered plane (typically the north-facing plane in the Northern Hemisphere, which receives the least UV), provided two conditions hold: the plane's age-normalized GRI falls within an implementer-defined age-normalized range (derived from the population baseline described below), and the plane's unmasked tile coverage is at least 60% (design parameter), since north planes also collect the most moss and a heavily masked plane makes a sparse, biased baseline. Every other plane is scored as retention relative to this baseline. Differential measurement is intended to reduce lot variation, color effects, and camera-model differences so that the measured signal predominantly reflects environmental degradation; this cancellation has not been validated. When no plane qualifies (all planes severely weathered, roof age unknown, or the qualifying baseline plane unsurveyed), the app falls back to a population baseline built from the aggregated survey database with the roof's age, color family, and climate zone as covariates. Before deployment, the population baseline is seeded from manufacturer weathering curves and the IBHS aging studies, and it is refined as the aggregated database grows.
5. Contamination Masking
Lichen, moss, and algae colonize shingles and corrupt texture measurements. A green-channel mask excludes pixels where the a* channel of CIELAB is strongly negative (green), and tiles with more than 40% masked area (design parameter) are dropped from the survey with a prompt to photograph a cleaner adjacent shingle. Bird droppings and fresh debris are excluded by a luminance-and-chroma outlier test against the tile neighborhood. Per-survey masked fractions are reported so the user knows when contamination, not granule loss, limits measurement.
6. Spatial Cause Classification
Per-tile GRI values aggregate into a roof-level granule loss map, and a spatial-pattern classifier assigns each degraded region to a cause class:
- UV and thermal aging: diffuse loss graded by plane azimuth, worst on south- and west-facing planes, monotonic with elevation below the ridge (upper courses weather faster). Uniform across each plane with smooth gradients. This is the normal-aging signature.
- Hail bruising: randomly distributed circular loss zones 10-40 mm in diameter (design parameter), uncorrelated with plane azimuth, each with a crushed-center texture where granule embedding has been compacted. Matches the hail-damage pattern measured independently by LITF-PA-2026-177; the app flags regions for cross-reference when that system's storm history is available.
- Foot-traffic wear: linear wear paths from eave toward ridge or along valley lines, following the access routes installers and service technicians take. Straight or gently curved, one shingle course wide, with crushed texture rather than UV-graded loss.
- Manufacturing defect: uniform low GRI across all planes with no azimuth gradient, on a roof young enough that UV aging cannot explain it, or a single production-lot band (one pallet row) showing loss while adjacent courses remain intact. Triggers a warranty-claim evidence package: timestamped survey, lot inference from course pattern, and baseline comparison.
7. Remaining Service Life Model
Granule loss accelerates once it passes a threshold: lost granules expose asphalt, UV oxidizes the exposed asphalt faster, and the embrittled asphalt sheds more granules. This UV-oxidation feedback is the rationale for a piecewise degradation curve whose functional form and both thresholds are hypotheses to validate against longitudinal data, not established degradation physics. Phase one is linear, at a rate set by the roof's measured GRI slope from repeat surveys. Phase two is exponential once roof-level median GRI falls below the embrittlement threshold (design parameter: GRI 45). Remaining service life is defined as the time until the median GRI across planes, weighted by each plane's surveyed area, reaches the replacement threshold (design parameter: GRI 30), at which point the embrittlement-driven cracking probability exceeds the maintenance-economics cutoff (the point at which expected repair costs from cracking-related leaks exceed the amortized cost of replacement, implementation-specific).
Longitudinal surveys are the critical input. Repeat surveys are prompted each spring and fall, and also before and after any hail season. Each new survey updates the per-plane GRI slope. The model is designed so that its confidence interval (level implementation-specific, for example 90%) on remaining life narrows with each additional data point (illustrative; interval widths are implementation-specific), and the app displays this explicitly: a single survey yields a wide, honest band, while several years of surveys yield a tighter one. Where no repeat survey exists, the model uses the differential cross-plane calibration as a single-point age-normalized estimate with a correspondingly wide interval.
8. Outputs and Actions
- Granule loss map: a per-plane color map of GRI over the roof, identifying which planes and which courses are aging fastest.
- Cause classification: per-region cause assignment (aging, hail, traffic, defect) with the evidence the app used, and the recommended action for each: continue monitoring, schedule targeted repair, file a hail claim with storm history attached, or assemble a warranty evidence package.
- Remaining-life report: estimated years of remaining service with confidence interval, the replacement-threshold date under current degradation rate, and a notification when the model projects the roof will cross the replacement threshold within 24 months (design parameter).
- Warranty and claim export: timestamped survey data, images with reference card visible, cause-classification evidence, and storm-history cross-references in a package formatted for manufacturer warranty review or insurance adjustment. Manufacturers and insurers are not obligated to accept app-generated surveys; the package organizes the user's evidence but does not guarantee its acceptance. Nothing in this disclosure creates, extends, or modifies any manufacturer's warranty, and the GRI score should not be relied on to validate or void a warranty claim.
9. Figures Description
- Figure 1: Acquisition setup showing the reference card on a shingle surface, phone at 25-40 cm, framing guide overlay, and the survey location grid over a roof plan.
- Figure 2: Processing pipeline: normalized image, GLCM feature maps, color-segmented granule versus exposed-mat masks, and per-tile GRI grid.
- Figure 3: Example granule loss map for a four-plane gable roof showing south-plane-biased UV aging, a hail-bruised region on the north plane, and a foot-traffic path to a vent stack, each cause-classified.
- Figure 4: Example (illustrative): degradation curve with phase-one linear and phase-two exponential segments, three illustrative longitudinal survey points with confidence bands designed to narrow as surveys accumulate, and the replacement threshold intersection.
Claims
- A system for quantifying asphalt shingle granule loss, comprising: a smartphone with a camera; a flat reference card carrying a printed dimensional scale and color patches of known reflectance; and a software application that captures an image of a shingle surface with the card in frame, normalizes the image for scale and illumination using the card, computes image texture features correlated with granule coverage, and outputs a per-location Granule Retention Index.
- The system of claim 1, wherein the texture features comprise gray-level co-occurrence matrix features (contrast, entropy, homogeneity, correlation) computed at multiple orientations and multiple pixel offsets, and wherein the application further comprises a classifier mapping the features to a tile-level retention score.
- The system of claim 1, further comprising an exposed-mat pixel fraction module that segments ceramic-coated granules from exposed asphalt and fiberglass mat in CIELAB color space and computes the fraction of non-granule pixels per image tile.
- The system of claim 1, further comprising a specular uniformity module that computes the coefficient of variation of normalized luminance across image tiles, wherein elevated sheen variance indicates granule loss on dark-colored shingles where color segmentation is less discriminative.
- The system of claim 1, further comprising a differential calibration module that designates the least-weathered roof plane as an internal baseline and expresses all other planes' retention indices relative to the baseline, thereby reducing manufacturing lot variation, shingle color effects, and camera-model differences.
- The system of claim 1, further comprising a contamination masking module that excludes lichen, moss, algae, and debris pixels from texture analysis and reports the masked fraction of each survey.
- The system of claim 1, further comprising a spatial cause classifier that distinguishes uniform UV and thermal aging (azimuth-graded diffuse loss), hail bruising (random circular loss zones), foot-traffic wear (linear wear paths along access routes), and manufacturing defects (uniform loss across all planes on a young roof or single-course banding).
- The system of claim 7, further comprising an action-recommendation module that recommends a corresponding action for each cause class, selected from: continue monitoring, schedule targeted repair, file a hail claim with storm history attached, and assemble a warranty evidence package for manufacturing defects.
- The system of claim 1, further comprising a remaining-service-life model that fits longitudinal repeat-survey Granule Retention Index data to a piecewise linear-then-exponential degradation curve and reports an estimated remaining roof life with a confidence interval designed to narrow with each additional survey.
- The system of claim 7, further comprising a warranty evidence package generator that assembles timestamped survey images, retention measurements, and cause-classification evidence for manufacturing-defect claims.
- A method for quantifying asphalt shingle granule loss, comprising: placing a reference card of known dimensions and reflectance patches on a shingle surface; capturing a flash-disabled close-up photograph with a smartphone camera with the card in frame; normalizing the image for scale and illumination using the card; computing gray-level co-occurrence matrix texture features, an exposed-mat pixel fraction, and specular uniformity per image tile; fusing the features into a per-location Granule Retention Index; calibrating indices across roof planes against the least-weathered plane as an internal baseline; and classifying degradation cause by spatial pattern.
- The method of claim 11, further comprising repeating the survey at seasonal intervals, fitting the longitudinal Granule Retention Index data to a piecewise degradation curve, and estimating remaining roof service life with a confidence interval.
- The method of claim 11, further comprising cross-referencing hail-classified loss regions with storm-impact history from an independent acoustic hail sensing system to corroborate the cause classification.
Implementation Notes
Scope of this disclosure: This document is a design proposal. No prototype has been built and no field validation has been performed; all quantitative parameters in this disclosure (GRI thresholds, classifier architecture, survey density, capture distances, lighting windows, contamination thresholds, and confidence-interval behavior) are untested design choices.
Everything hinges on the reference card. Without it, two captures are not comparable: the user stands at a different distance, the sun is different, the phone's auto white balance has drifted. A printed card shipped with the app, or a downloadable PDF printed at 100% scale, resolves all three. Card detection is verified before any capture is allowed; no card, no measurement. This is a deliberate friction point, because an uncalibrated photo corrupts the trend.
Smartphone cameras are good enough. The texture features of interest sit at 0.5-3 mm spatial scale, within the resolving power of a 12-megapixel phone camera at 30 cm under good focus, and the app should capture or prefer the highest available JPEG quality (or RAW when supported) to keep JPEG 8×8 DCT artifacts away from the fine GLCM offset scale. Camera-model variation is expected to be absorbed by the differential cross-plane calibration, so mixed-device surveys are expected to produce valid relative measurements because the calibration normalizes camera-model effects; this has not been validated across device pairs. Lens smudges are the real enemy; the app includes a capture-reject check for global blur via Laplacian variance.
Safety constrains the survey. Most homeowners can photograph eave-adjacent courses from a ladder and reach further with a telescoping pole. Where planes cannot be photographed, the location grid marks them unsurveyed rather than interpolating, because interpolating across a ridge is exactly the kind of silent overclaim the confidence intervals are meant to prevent.
Shingle profile bounds the texture model. Three-tab shingles present a flat, uniform field where the granular-versus-smooth texture model applies directly; architectural (dimensional) shingles carry deep relief and shadow lines that change the texture statistics independent of granule retention. Tile sizes and feature weights in this design are specified for 3-tab shingles, with dimensional profiles as an extension requiring profile-aware features.
Degradation thresholds (embrittlement at GRI 45, replacement at GRI 30) are design parameters informed by the granule-coverage/UV-exposure relationship reported in IBHS aging research (Prior Art References 3). Implementers should calibrate these thresholds against roof ages and failure observations in their climate zone before presenting them as decision criteria. This document describes a proposed design, not a validated engineering method.
Measurement misuse is a foreseeable failure mode. A home seller could survey only the best-preserved courses to inflate a roof score; an insurer could demand the score as an underwriting condition. The method's defenses are structural: the stratified per-plane minimum survey density (Section 1) prevents cherry-picking from being reported as a complete survey, and the per-survey location log with timestamps and plane assignments makes selective omission detectable. The GRI is a homeowner's informational tool, not an underwriting instrument, and any party relying on a survey should demand the full location log before the aggregate score.
All image processing runs on the device. Reference images with the card visible are stored locally for warranty export; no imagery is uploaded. Only per-tile indices, survey metadata, and roof-level aggregates leave the device, and then only for backup or the user's own multi-device access.
Prior Art References
- ASTM D4977: Standard test method for granule adhesion to mineral-surfaced roofing by abrasion (laboratory method)
- ASTM D3462: Standard specification for asphalt shingles made from glass felt and surfaced with mineral granules
- Insurance Institute for Business & Home Safety (IBHS): Asphalt shingle aging research; UV exposure, thermal cycling, and granule loss effects on impact resistance
- Haralick, R. M., Shanmugam, K., and Dinstein, I., "Textural Features for Image Classification," IEEE Transactions on Systems, Man, and Cybernetics, 1973: Gray-level co-occurrence matrix texture features
- LITF-PA-2026-177: Per-address hail damage severity assessment using attic-mounted acoustic impact sensing; storm-specific damage from inside the structure, distinct from surface image-based granule retention measurement
- GAF steep-slope technical bulletins (document library): Granule loss mechanisms and manufacturing factors
- Owens Corning technical literature: Shingle weathering and granule adhesion guidance
- EagleView: Aerial and satellite roof measurement services; geometry and dimensions from imagery, not surface-texture granule assessment
- National Roofing Contractors Association (NRCA): Roofing manual guidance on shingle weathering assessment (visual, qualitative)