System and Method for Continuous Soil Moisture Profiling and Root Zone Health Assessment Using Autonomous Robotic Mower-Integrated Multi-Frequency Impedance Spectroscopy with Geostatistical Spatial Inference
Abstract
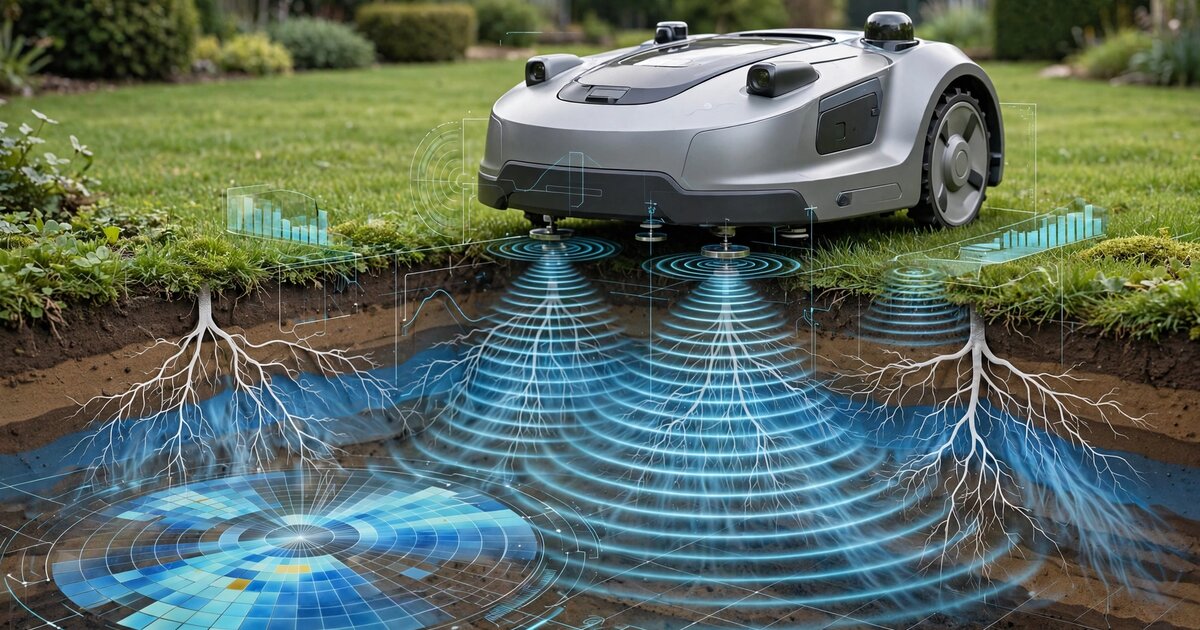
Disclosed is a system and method for continuous, spatially dense soil moisture profiling and root zone health assessment in residential and commercial turf environments by integrating multi-frequency electrical impedance spectroscopy (EIS) electrodes into the chassis or wheels of autonomous robotic lawn mowers. The mower's existing RTK-GNSS positioning system (±2 cm accuracy) provides precise geolocation for each impedance measurement. During each mowing cycle, the system acquires impedance spectra at frequencies spanning 100 Hz to 1 MHz through blade-contact or wheel-contact electrodes that couple galvanically with the turf surface. Impedance magnitude and phase angle at low frequencies (100 Hz to 10 kHz) correlate with volumetric soil moisture content via established dielectric relaxation models. Mid-frequency responses (10 kHz to 100 kHz) encode soil salinity and ionic conductivity. High-frequency responses (100 kHz to 1 MHz) capture the capacitive contribution of living root cell membranes, enabling non-destructive estimation of root biomass density. The system applies regression kriging with soil-type covariates to interpolate point measurements into continuous raster maps of the entire lawn at sub-meter resolution. A temporal change-detection neural network, trained on seasonal baselines, identifies anomalous zones indicating irrigation system failures, subsurface drainage problems, grub damage to root systems, fungal disease onset, and compaction from foot traffic, triggering spatially targeted remediation recommendations via a companion mobile application.
Field of the Invention
This invention relates to precision turf management and landscape maintenance, specifically to automated, mobile soil sensing using impedance spectroscopy integrated into autonomous robotic platforms for continuous soil moisture profiling, salinity monitoring, and root zone health assessment without dedicated sensing infrastructure.
Background
Residential and commercial turf irrigation in the United States consumes approximately 9 billion gallons of water per day (EPA WaterSense), accounting for roughly 30% of total residential water use nationally and exceeding 50% in arid western states. The Irrigation Association estimates that 50% of landscape irrigation water is wasted through overwatering, runoff, and evaporation due to imprecise scheduling. Water districts in California, Arizona, and Colorado have implemented tiered pricing structures where overuse penalties can reach $10-25 per hundred cubic feet (HCF) above baseline allocation. Despite these incentives, most residential irrigation systems operate on fixed timer schedules with no soil moisture feedback.
Current soil moisture monitoring approaches for residential turf have fundamental limitations:
- Point sensors (TDR/FDR probes): Time-domain reflectometry (TDR) and frequency-domain reflectometry (FDR) sensors such as the METER Group TEROS 12 ($150-300/unit) provide accurate volumetric water content at a single point. A typical 5,000 sq ft residential lawn requires 8-12 sensors for representative coverage ($1,200-3,600 in hardware alone), plus installation labor and wiring. Vereecken et al. (2014) demonstrated that point-sensor networks systematically miss heterogeneous soil moisture patterns caused by variable soil texture, root density, microtopography, and irrigation non-uniformity.
- Smart irrigation controllers: EPA WaterSense-certified controllers (Rachio, RainMachine, Hunter Hydrawise) use evapotranspiration (ET) models driven by weather data to adjust irrigation schedules. These systems calculate a single ET value for each irrigation zone (typically 500-2,000 sq ft per zone) and cannot detect within-zone moisture variability, localized drainage problems, or root zone stress. EPA WaterSense data shows labeled controllers reduce outdoor water use by approximately 15% compared to conventional timers, but still cannot approach the theoretical 40-60% savings achievable with spatially precise soil moisture feedback.
- Satellite and aerial remote sensing: Normalized Difference Vegetation Index (NDVI) from satellite imagery (Sentinel-2, 10 m resolution; Landsat, 30 m) and drone-mounted multispectral cameras can identify turf stress patterns. However, satellite resolution is too coarse for individual residential lawns. Drone surveys require manual operation and regulatory compliance (FAA Part 107). Both approaches detect surface vegetation stress only after it becomes visible, providing lagging rather than leading indicators. Khanal et al., Remote Sensing 2020 found that NDVI-based stress detection in turfgrass lags soil moisture deficit by 5-14 days depending on grass species and temperature.
- Electrical resistivity tomography (ERT): Fixed electrode arrays for ERT-based soil moisture imaging (Besson et al., Geoderma 2010) achieve high spatial resolution but require permanent installation of 20-60 electrodes per survey line, making them cost-prohibitive for residential applications ($5,000-15,000 per installation).
Separately, autonomous robotic lawn mowers have achieved market penetration of approximately 1.5 million units globally (Grand View Research, 2024 estimate), with RTK-GNSS equipped models from Husqvarna (AUTOMOWER NERA), Segway (Navimow), EcoFlow (BLADE), and others achieving ±2 cm positional accuracy without boundary wires. These platforms traverse the entire lawn surface systematically during each mowing cycle (typically 2-4 times per week), providing a high-frequency, spatially complete traversal of the turf surface. No existing system exploits this traversal opportunity for soil sensing.
Electrical impedance spectroscopy of soil is a well-characterized technique. Hübner et al., Applied Sciences 2021 demonstrated that multi-frequency impedance measurements can simultaneously resolve soil moisture content, salinity, and structural density through the frequency-dependent dielectric relaxation behavior of soil-water-air-root systems. US11060989B2 (Iowa State, 2021) discloses microneedle-based EIS for plant tissue water status monitoring but does not address soil-level sensing or mobile platform integration. WO1995006881A1 (1995) describes a static soil moisture sensor using impedance at a single frequency but does not contemplate mobile or multi-frequency measurement.
The gap in the art is a system that: (a) integrates multi-frequency impedance spectroscopy into an autonomous mobile platform that already traverses the entire lawn surface; (b) exploits the mower's RTK positioning for precise geolocation of each measurement; (c) applies geostatistical interpolation to convert discrete measurements into continuous spatial maps; (d) uses temporal change detection across repeated traversals to identify emerging problems before they become visible; and (e) distinguishes moisture, salinity, and root health conditions through multi-frequency spectral decomposition.
Detailed Description
1. Electrode Integration into Autonomous Mower Chassis
Multi-frequency EIS measurement requires at least two electrodes in galvanic contact with the soil or turf surface. The system integrates electrodes into the mower platform using one or more of the following configurations:
- Blade-contact configuration: The mower's cutting blade assembly, which rotates in direct contact with the grass canopy, serves as one electrode. A second ring electrode is mounted on the mower's underside, concentric with the blade disk, at a fixed radial offset (50-80 mm). During operation, cut grass clippings and surface moisture provide a conductive path between the blade and the turf surface. Excitation current flows from the blade electrode through the grass-soil system to the ring electrode. Electrode material: 316L stainless steel or titanium-coated steel for corrosion resistance and electrochemical stability. This configuration measures only during active mowing.
- Wheel-contact configuration (preferred): Conductive tire inserts or metallic rim segments on two or more wheels serve as electrodes. Each wheel maintains contact with the turf surface under the mower's weight (typically 8-15 kg for consumer models). The inter-electrode spacing is fixed by the mower's wheelbase (300-500 mm for most models). This configuration allows measurement during both mowing and non-mowing transit. Electrode geometry: annular conductive bands (width 10-15 mm, circumference matching tire diameter) embedded in the tire tread surface or molded into the tire compound using conductive carbon-loaded silicone rubber (volume resistivity < 10 Ω·cm). Two-electrode measurements use the front-left and front-right wheels; four-electrode (Wenner array) measurements use all four wheels.
- Trailing sled configuration: A small trailing sensor pod (mass < 500 g) connected to the mower by a flexible tether contains four spring-loaded stainless steel pin electrodes arranged in a Wenner array (equal inter-electrode spacing, configurable 20-50 mm). The sled is weighted to maintain electrode-soil contact. This configuration provides the most controlled electrode geometry and consistent soil coupling, independent of mower wheel design.
2. Multi-Frequency Impedance Measurement Circuit
The impedance measurement subsystem comprises a programmable frequency synthesizer (DDS-based, e.g., Analog Devices AD9833, unit cost $2.50) generating sinusoidal excitation signals; a programmable gain amplifier (PGA) driving the excitation electrode with a constant-voltage signal (100 mV RMS, configurable 10-500 mV to avoid polarization artifacts); a transimpedance amplifier measuring the current through the soil path; and a digital lock-in amplifier (implemented on the mower's existing microcontroller, e.g., ESP32-S3 or STM32H7) computing impedance magnitude |Z| and phase angle φ at each excitation frequency.
The system sweeps through a logarithmically spaced frequency set during each measurement cycle:
- Band A (100 Hz - 1 kHz, 8 frequencies): Dominated by electrode polarization and ionic double-layer capacitance. Used for soil salinity estimation after correcting for electrode polarization using the Cole-Cole dispersion model (Schwan, 1957). Salinity correlates with the real component of impedance at 1 kHz (R² > 0.92 for EC range 0.1-10 dS/m in loamy soils).
- Band B (1 kHz - 100 kHz, 12 frequencies): The bulk soil impedance regime, where the dielectric response is dominated by the water content of the soil matrix. Hilhorst (2000) established that the real permittivity of soil at 20 kHz is linearly related to volumetric water content (θ) with soil-type-dependent calibration coefficients: θ = (ε′ - ε_dry) / (ε_water - ε_dry), where ε_water ≈ 80 at 20°C and ε_dry ranges from 2.5 (sand) to 5.0 (clay). Impedance phase angle at 10 kHz provides a secondary moisture indicator less sensitive to soil type than magnitude alone.
- Band C (100 kHz - 1 MHz, 8 frequencies): At frequencies above 100 kHz, the capacitive contribution of living cell membranes in plant roots becomes significant. Root cell membranes behave as parallel RC elements with characteristic relaxation frequencies of 0.5-5 MHz depending on cell size and turgor pressure. The magnitude of the β-dispersion (the step change in permittivity between 100 kHz and 1 MHz) correlates with root biomass density. Cseresnyés et al., Journal of Experimental Botany 2019 demonstrated that root electrical capacitance measured at 1 kHz correlates with root dry mass (R² = 0.67-0.88 across six crop species). The present system extends this principle to multi-frequency measurement for more robust root health estimation.
Total sweep time per measurement point: 50-100 ms (limited by settling time at the lowest frequencies). At a typical mowing speed of 0.3-0.5 m/s, this yields one complete impedance spectrum every 15-50 mm of travel, producing 20,000-100,000 georeferenced spectra per mowing cycle on a 5,000 sq ft lawn.
3. RTK-GNSS Geolocation and Measurement Registration
Each impedance spectrum is tagged with the mower's RTK-GNSS position at the moment of acquisition. Modern RTK-equipped mowers achieve horizontal accuracy of ±2 cm and update position at 5-10 Hz. The measurement subsystem synchronizes its acquisition trigger with the GNSS PVT (position-velocity-time) solution via a shared PPS (pulse-per-second) signal.
Measurement positions are projected onto a local Cartesian coordinate system aligned with the lawn boundary polygon (established during the mower's initial mapping run). A spatial index (R-tree) groups measurements into 0.25 m × 0.25 m grid cells. Each cell accumulates multiple measurements across passes, and a cell-level median filter rejects outliers caused by transient contact anomalies (driving over a rock, crossing a hardscape edge, wheel slip on wet grass).
4. Geostatistical Spatial Inference via Regression Kriging
The system converts discrete impedance measurements into continuous raster maps using regression kriging, a geostatistical method that combines a regression model for spatial trend with kriging of residuals for local variation.
The regression component models the relationship between derived soil properties (moisture content θ, EC, root density index) and spatial covariates: (a) distance to nearest irrigation head (from the user-provided irrigation zone map or inferred from periodic moisture spike patterns); (b) local elevation relative to the lawn's drainage plane (derived from the mower's barometric altimeter or RTK vertical component, ±5 cm); (c) distance to hardscape edges (driveways, foundations) that affect subsurface drainage; and (d) canopy density, inferred from the mower's blade motor current draw (denser grass increases cutting resistance).
The kriging component models the spatial autocorrelation structure of the regression residuals using a semivariogram fitted to the measurement data. For typical residential soils, the spatial autocorrelation range for soil moisture is 2-8 meters (Western et al., Geoderma 2004), well within the sampling density achieved by the mower's systematic traversal pattern. Kriging prediction intervals provide per-pixel uncertainty estimates.
Output maps are generated at 0.5 m × 0.5 m resolution and updated after each mowing cycle. Maps are stored in GeoTIFF format and served to the companion mobile application via a local API on the mower's base station or via cloud upload.
5. Temporal Change Detection and Anomaly Classification
The system maintains a rolling archive of soil property maps from the previous 90 days. A temporal change-detection module compares each new map against the seasonal baseline (computed as the 30-day moving average for the same calendar period in the current and previous years, when available). The change-detection module uses a 1D convolutional neural network (Conv1D) operating on the time series of soil properties at each grid cell, with the following target anomaly classes:
- Irrigation system fault: Localized moisture deficit in a geometric pattern consistent with a clogged, misaligned, or broken sprinkler head. Detection signature: sharply bounded dry zone with shape matching the expected coverage arc of the nearest irrigation head, persistent across 2+ mowing cycles.
- Subsurface drainage failure: Persistent moisture excess that does not respond to irrigation cutoff. Indicates a broken drain pipe, high water table intrusion, or slope-driven subsurface flow accumulation. Detection signature: elongated saturated zone aligned with topographic gradient, moisture level exceeding field capacity for >7 consecutive days.
- Grub or insect damage: Localized decline in root density index (Band C β-dispersion) without corresponding change in moisture content. White grubs (Phyllophaga spp., Cyclocephala spp.) sever roots below the thatch layer, reducing root biomass while soil moisture remains normal or increases (due to reduced transpiration). Detection signature: root density index decline >25% from baseline in a patch >0.5 m² with stable or increasing moisture.
- Fungal disease onset: Spatially expanding zones of simultaneously elevated moisture and declining root density, consistent with damping-off fungi (Pythium spp., Rhizoctonia solani). Detection signature: ring-shaped or irregular expanding front with moisture >field capacity and root density declining at the leading edge. The expansion rate (typically 5-20 cm/day for brown patch) distinguishes fungal spread from static drainage problems.
- Compaction zones: Elevated impedance magnitude across all frequency bands without moisture change, indicating increased soil bulk density. Common under play equipment, along paths, and near gates. Detection signature: consistent impedance increase >15% from baseline across Bands A-C, stable over weeks, with spatial pattern correlated to high-traffic areas.
- Soil salinity buildup: Progressive increase in Band A real impedance (salinity indicator) without corresponding moisture decrease, indicating salt accumulation from irrigation water, fertilizer runoff, or de-icing salt. Detection signature: monotonic EC increase over >30 days, not correlated with irrigation volume changes.
The Conv1D classifier is trained on synthetic datasets generated by coupling a finite-element soil physics model (solving Richards' equation for unsaturated flow, advection-dispersion for salt transport, and a root growth/death model) with a forward impedance model (Cole-Cole relaxation). Training data augmentation includes variation in soil texture (12 USDA texture classes), initial conditions, irrigation schedules, and anomaly injection timing.
6. Fleet Learning and Soil Type Calibration
Impedance-to-soil-property calibration depends on soil type. The system addresses this through a fleet learning architecture. When a user provides a ground-truth soil moisture measurement (e.g., from a consumer moisture probe or a soil test report), the mower's impedance data for that location and date is paired with the ground-truth value and uploaded to a federated calibration server. Over thousands of users across diverse soil types and climates, the server trains a soil-type-adaptive calibration model that conditions the impedance-to-moisture transfer function on: (a) the impedance spectral shape itself (which encodes soil texture information); (b) geographic region (as a proxy for soil series, via USDA SSURGO database lookup); and (c) historical measurement trajectories (seasonal wetting/drying cycles are soil-type-dependent). This fleet-calibrated model is distributed back to individual mowers via firmware update, progressively improving accuracy without requiring per-unit laboratory calibration.
7. Irrigation Control Integration
The system generates zone-level and sub-zone-level irrigation recommendations. For systems with conventional zone-based controllers (Hunter, Rain Bird, Rachio), the output is a per-zone watering duration adjustment (as a percentage of the ET-based baseline). For systems with individually addressable sprinkler heads or drip emitters, the output includes per-head flow duration recommendations based on the spatial moisture deficit map. Recommendations are communicated via: (a) the companion mobile app (push notification with recommended schedule adjustments); (b) direct API integration with smart irrigation controllers (Rachio API, Hydrawise API, Hunter Hydrawise Pro-C); or (c) relay control via a smart plug or valve actuator for legacy systems.
8. Figures Description
- Figure 1: System architecture showing the mower platform with electrode configurations (wheel-contact and trailing sled), EIS measurement circuit block diagram, RTK-GNSS positioning, and data flow to the companion application.
- Figure 2: Representative impedance spectra (Nyquist plots and Bode magnitude/phase plots) for the same soil at five volumetric water contents (10%, 20%, 30%, 40%, saturated), showing the frequency-dependent separation of moisture, salinity, and root density signatures.
- Figure 3: Example spatial moisture map of a 5,000 sq ft residential lawn generated from a single mowing cycle, with 0.5 m resolution, showing kriging predictions and uncertainty intervals. Overlaid: detected anomaly zones classified by type.
- Figure 4: Temporal change-detection visualization showing a 30-day time series at three grid cells: (a) normal seasonal drying, (b) irrigation head failure onset, (c) grub damage progression with root density decline preceding visible turf stress by 12 days.
- Figure 5: Fleet calibration convergence plot showing RMSE of volumetric moisture estimates vs. number of participating units and ground-truth measurements, for three soil texture classes (sand, loam, clay).
Claims
- A system for continuous soil moisture profiling in turf environments, comprising: an autonomous robotic lawn mower equipped with RTK-GNSS positioning; at least two electrodes integrated into the mower chassis, wheels, or a trailing attachment, configured for galvanic contact with the turf surface; a multi-frequency impedance measurement circuit that excites the electrodes across a frequency range spanning at least 100 Hz to 100 kHz; and a processing module that converts impedance magnitude and phase angle measurements at each frequency into estimates of volumetric soil moisture content using a dielectric relaxation model.
- The system of claim 1, wherein the electrodes are conductive elements integrated into two or more of the mower's wheels, using conductive tire inserts, metallic rim segments, or conductive rubber tread bands, such that the mower's wheelbase defines the inter-electrode spacing.
- The system of claim 1, further comprising a spatial mapping module that associates each impedance measurement with a georeferenced position from the mower's RTK-GNSS receiver and applies geostatistical interpolation to generate continuous raster maps of soil moisture content at sub-meter resolution over the entire lawn area.
- The system of claim 3, wherein the geostatistical interpolation is regression kriging combining a spatial trend model using covariates including distance to irrigation heads, local elevation, and distance to hardscape edges with variogram-based kriging of residuals.
- The system of claim 1, wherein the impedance measurement circuit additionally sweeps frequencies above 100 kHz, and the processing module estimates root zone biomass density from the magnitude of the β-dispersion in the impedance spectrum, the β-dispersion arising from the capacitive response of living root cell membranes.
- The system of claim 1, further comprising a temporal change-detection module that compares soil property maps generated from successive mowing cycles against a seasonal baseline to identify anomalous zones, and a classifier that categorizes detected anomalies into at least two of: irrigation system fault, subsurface drainage failure, insect or grub damage, fungal disease onset, and soil compaction.
- A method for spatially resolved soil health monitoring using an autonomous mowing platform, comprising: traversing a lawn surface with an autonomous robotic mower during a mowing cycle; measuring electrical impedance spectra at a plurality of frequencies through electrodes in contact with the turf surface at a plurality of georeferenced positions along the mower's path; decomposing each impedance spectrum into components corresponding to soil moisture content, soil electrical conductivity, and root biomass density; interpolating the decomposed components over the lawn area using geostatistical methods to produce continuous spatial maps; and generating remediation recommendations for zones where mapped properties deviate from expected values.
- The method of claim 7, further comprising a fleet learning step in which impedance-to-soil-property calibration parameters are refined using federated aggregation of paired impedance measurements and ground-truth soil data across a population of mower units operating on diverse soil types.
- The method of claim 7, further comprising integration with a smart irrigation controller, wherein per-zone or per-head irrigation duration recommendations are computed from the spatial moisture deficit map and communicated to the controller via an API.
- The system of claim 1, wherein the impedance measurement subsystem has a total bill-of-materials cost below $15, comprising a direct-digital-synthesis frequency generator, a transimpedance amplifier, and a digital lock-in amplifier implemented on the mower's existing microcontroller.
- The system of claim 1, further comprising a blade motor current sensor that measures cutting resistance as a proxy for grass canopy density, and uses this as an additional covariate in the geostatistical spatial model to improve soil moisture estimation accuracy in areas of heterogeneous turf cover.
Implementation Notes
This system is designed for integration into existing consumer robotic mower platforms via a modular sensor attachment or OEM firmware update. The EIS measurement circuit adds approximately $10-15 to the mower's bill of materials. No changes to the mower's mechanical drive system, blade assembly, or navigation algorithm are required for the wheel-contact or trailing sled configurations. The blade-contact configuration requires electrical isolation of the blade disk from the motor housing, achievable with a ceramic bearing insert.
Calibration accuracy improves over time through three mechanisms: (1) per-lawn self-calibration as the system builds a history of impedance measurements under known conditions (post-irrigation, post-rainfall with measured precipitation); (2) fleet learning across thousands of units, which amortizes the cost of ground-truth soil testing across the user base; and (3) integration with public soil databases (USDA SSURGO, NRCS Web Soil Survey) to initialize per-lawn soil texture priors.
The system's temporal resolution (2-4 complete lawn scans per week for a typical mowing schedule) exceeds any practical alternative for residential soil monitoring. At an acquisition rate of ~50,000 spectra per mowing cycle on a 5,000 sq ft lawn, the spatial sampling density is approximately 100 measurements per square meter, far exceeding the 0.002-0.004 measurements per square meter achievable with a 12-probe fixed sensor network.
Prior Art References
- EPA WaterSense — How We Use Water — Outdoor irrigation accounts for ~30% of residential water use, ~9 billion gallons/day
- Hübner et al., Applied Sciences 2021 — Detection of density changes in soils with impedance spectroscopy; multi-frequency EIS resolves moisture, salinity, and structural properties
- Cseresnyés et al., Journal of Experimental Botany 2019 — Root electrical capacitance correlates with root dry mass (R² = 0.67-0.88 across six crop species)
- US11060989B2 — Iowa State — Microneedle-based EIS for plant tissue water status (does not address soil-level sensing or mobile platform integration)
- WO1995006881A1 — Static soil moisture sensor using impedance at single frequency (does not contemplate mobile or multi-frequency measurement)
- Brown et al., Vadose Zone Journal 2026 — Performance comparison of eight soil moisture sensors including impedance-based designs across soil textures
- METER Group TEROS 12 — Representative commercial TDR soil moisture probe ($150-300/unit)
- Hilhorst, Water Resources Research 2000 — Linear relationship between real permittivity at 20 kHz and volumetric soil water content
- Western et al., Geoderma 2004 — Spatial autocorrelation of soil moisture: geostatistical analysis showing 2-8 m correlation range in residential-scale plots
- Khanal et al., Remote Sensing 2020 — NDVI-based turfgrass stress detection lags soil moisture deficit by 5-14 days
- Besson et al., Geoderma 2010 — Electrical resistivity tomography for soil moisture imaging with fixed electrode arrays
- Grand View Research — Robotic Lawn Mower Market — Estimated 1.5M+ units globally, RTK-GNSS penetration increasing
- Schwan, 1957 (reviewed in Grimnes & Martinsen, Measurement 2017) — Cole-Cole dispersion model for electrode polarization correction in biological and soil impedance spectroscopy
- EPA WaterSense — Labeled Controllers — WaterSense-certified controllers reduce outdoor use by ~15% vs. conventional timers
- Wikipedia — Robotic lawn mower — RTK positioning provides ±2 cm accuracy for systematic mowing; historical overview of autonomous mowing platforms