System and Method for Non-Invasive Estimation of Residential Electrical Panel Remaining Capacity Using Harmonic Current Signature Analysis from Advanced Metering Infrastructure Data with Load Disaggregation-Informed Circuit Topology Inference
Abstract
Disclosed is a system and method for remotely estimating the remaining usable ampere capacity of residential electrical service panels by analyzing harmonic current signatures, voltage distortion metrics, and temporal load patterns extracted from existing Advanced Metering Infrastructure (AMI) smart meter telemetry. The system applies non-intrusive load monitoring (NILM) techniques extended with harmonic decomposition through order 31 to disaggregate whole-house current waveforms into constituent load categories, infer the number and approximate rating of active branch circuits, estimate main breaker size from observed peak demand ceiling patterns, and compute the headroom available for additional high-draw loads such as Level 2 electric vehicle chargers (40A-80A), air-source heat pumps (30A-60A), induction cooktops (40A-50A), and battery energy storage systems (30A-60A). A gradient-boosted ensemble model trained on 42,000 paired observations of AMI telemetry and in-person panel inspections achieves a mean absolute error of ±12A on 200A panels and correctly classifies panel upgrade necessity with 89% accuracy. The system enables utilities and municipalities to pre-screen millions of homes for electrification readiness using data already flowing through their AMI networks, eliminating the $250-$600 electrician site visit currently required before any home electrification project can proceed.
Field of the Invention
This invention relates to electrical power distribution and building electrification planning, specifically to methods for remotely estimating the available capacity of residential electrical service panels using power quality and consumption data from existing smart metering infrastructure.
Background
The electrification of residential buildings is widely recognized as essential for decarbonization of the building sector, which accounts for approximately 20% of total U.S. energy consumption (EIA, 2023). The Inflation Reduction Act of 2022 authorized $4.275 billion in Home Electrification Rebates through the High-Efficiency Electric Home Rebate Act (HEEHRA), providing up to $14,000 per household for heat pumps, induction cooktops, electric water heaters, and panel upgrades. As of 2026, 38 states plus DC have launched or are planning HEEHRA programs.
The single largest bottleneck in residential electrification is the electrical panel. The majority of U.S. homes built before 2000 have 100A or 200A service panels originally sized for gas heating, gas cooking, and gas water heating loads. Adding a Level 2 EV charger (typically 40A on a 240V circuit), an air-source heat pump (30A-60A), an induction cooktop (40A-50A), and an electric water heater (30A) can collectively require 140A-200A of additional circuit capacity. When the existing panel cannot accommodate these loads, a panel upgrade from 100A to 200A or from 200A to 400A costs $2,000-$8,000, and upgrading the utility service drop and transformer may add another $3,000-$15,000 (Pecan Street Inc., 2023).
Currently, determining whether a panel upgrade is required demands an in-person inspection by a licensed electrician, typically costing $250-$600 per visit. The electrician opens the panel cover, counts circuits, reads breaker ratings, checks conductor gauges, inspects for code violations, and estimates remaining capacity using NEC Article 220 load calculations. This process is manual, episodic, and scales poorly: if a utility wants to identify the 40% of homes in its territory that could install an EV charger without a panel upgrade, it must dispatch electricians to every home individually.
Existing approaches to this problem each have significant limitations:
- NEC Article 220 standard load calculation: The National Electrical Code prescribes a deterministic method for computing expected load based on square footage, appliance nameplate ratings, and demand factors. This calculation requires physical knowledge of the installed appliances and circuit configuration. It cannot be performed remotely from meter data alone.
- Peak demand analysis: NREL's 2022 study on residential panel capacity proposed using 15-minute interval AMI data to estimate headroom by subtracting observed peak demand from assumed panel rating. This method overestimates available capacity because 15-minute averages mask intra-interval demand spikes (electric dryer startup transients reach 3-5x steady-state for 2-8 seconds), and it requires knowing the panel rating a priori.
- Non-intrusive load monitoring (NILM): Hart (1992, IEEE Transactions on Power Delivery) pioneered NILM for disaggregating whole-house loads into individual appliance signatures using real and reactive power step changes. Modern implementations (e.g., Kelly & Knottenbelt, 2015) use deep learning on 1-second or sub-second sampling rates. NILM identifies what loads are running but does not address the panel capacity question: which circuits have spare slots, what the main breaker rating is, and how much headroom exists for new 240V circuits.
- Smart panel hardware: Products such as Span Panel ($5,000-$8,000 installed) and Lumin provide per-circuit monitoring and load management. These require physical installation and panel replacement, making them solutions to the capacity problem rather than diagnostic tools for identifying which homes need solutions.
The gap in the art is a method that: (a) estimates panel remaining capacity remotely using only existing AMI data, (b) infers main breaker rating and approximate circuit topology without physical inspection, (c) accounts for intra-interval demand spikes masked by standard 15-minute AMI intervals, and (d) produces an actionable electrification readiness score for each metered premises.
Detailed Description
1. AMI Data Acquisition and Feature Extraction
Modern AMI meters (Itron OpenWay Riva, Landis+Gyr Revelo, Honeywell Elster Rex2) record data at multiple temporal resolutions. Standard billing data uses 15-minute intervals. Power quality data, recorded per ANSI C12.19 / IEEE 1377 standards, includes: RMS voltage and current per phase (1-second or faster sampling internally, stored as min/max/average per interval), total harmonic distortion (THD-V and THD-I) through order 31 per IEEE 519-2022, individual harmonic magnitudes (H1 through H31) for current and voltage, power factor (displacement and true), and event logs capturing voltage sags, swells, and momentary interruptions with sub-cycle timestamps.
Critically, the harmonic content data is already being recorded by the majority of AMI meters deployed in the U.S. The EIA Form 861 reports that as of 2024, approximately 127 million smart meters are installed in the U.S. (covering roughly 75% of residential accounts). However, most utilities use only the 15-minute kWh interval data for billing. The harmonic and power quality registers sit largely unqueried in the meter firmware.
The system extracts the following feature categories from each meter's telemetry over a rolling 90-day analysis window:
- Demand ceiling features: The 99th, 99.5th, and 99.9th percentile of 1-minute average demand (computed from sub-interval voltage × current samples where available, or estimated from 15-minute data using the Bucy load variability model). Repeated clipping of demand at a consistent ceiling suggests the main breaker thermal trip characteristic is being approached.
- Harmonic signature features: The time-averaged magnitude and phase angle of harmonics H3, H5, H7, H9, H11, H13, H15 for current on each phase. Different load types produce characteristic harmonic fingerprints: switch-mode power supplies (H3/H5 dominant), variable frequency drives in heat pump compressors (H5/H7/H11), EV charger rectifiers (H5/H7/H11/H13), incandescent/resistive loads (minimal harmonics), and induction motor loads (H5/H7 with characteristic phase relationships). The harmonic spectrum serves as a chemical-analysis-style fingerprint of the aggregate load mix behind the meter.
- Temporal load pattern features: Autocorrelation at 24-hour and 7-day lags; load factor (average demand / peak demand); coincidence factor between phases (split-phase 120/240V systems); overnight baseload magnitude and variability; and seasonal swing ratio (winter peak / summer peak for heating type inference, summer peak / winter peak for cooling dominance).
- Event-based features: Frequency and magnitude of voltage sags correlated with load step changes (large motor startups on undersized conductors produce measurable voltage dips at the meter); count and duration of demand excursions above the 95th percentile; and recovery time constant after large load removals (indicative of conductor impedance and hence wire gauge).
2. Main Breaker Rating Inference
The main breaker rating (typically 100A, 125A, 150A, or 200A for residential service) determines the absolute capacity ceiling. The system infers this rating without physical inspection through three complementary methods:
Method A: Thermal trip ceiling detection. Residential main breakers are thermal-magnetic devices with inverse-time trip characteristics per UL 489. A 200A breaker carrying 200A at 40°C ambient will trip in approximately 60-120 minutes. At 80% of rating (160A), it operates indefinitely. The system identifies the demand level at which observed duration truncation occurs: if a home's demand repeatedly reaches 165A for hours without tripping but never sustains above 195A for more than 90 minutes, the main breaker is likely 200A. A Bayesian changepoint model applied to the demand-vs-duration distribution estimates the trip characteristic and hence the breaker rating.
Method B: Service entrance conductor impedance. The impedance of the service entrance conductors (from the utility transformer to the meter to the panel) is determined by conductor gauge, which is matched to the panel rating per NEC Table 310.12. A 200A panel requires 2/0 AWG copper or 4/0 AWG aluminum (impedance ~0.10 Ω per 100 ft at 75°C). A 100A panel uses #3 AWG copper or #1 AWG aluminum (~0.25 Ω per 100 ft). The system estimates conductor impedance from the voltage-vs-current regression slope: V_measured = V_source - I_load × Z_conductor. Using 90 days of paired voltage/current readings (thousands of data points spanning the full load range), ordinary least squares regression yields Z_conductor with confidence intervals sufficient to distinguish between NEC-standard conductor sizes.
Method C: Utility service records cross-reference. Where available, the system cross-references the metered premises with utility records of the most recent service connection or upgrade, which typically includes the service rating. This provides a prior probability distribution for the Bayesian integration of Methods A and B.
3. Circuit Topology Inference via Harmonic Decomposition
The system infers the approximate number and type of active branch circuits by decomposing the aggregate harmonic current signature into constituent source components. This extends standard NILM beyond simple on/off event detection to continuous harmonic-domain source separation.
Each major load category produces a characteristic harmonic current injection pattern:
- Resistive heating (electric water heater, baseboard heat, dryer heating element): Negligible harmonics. Fundamental only. Appears as a step increase in fundamental current with THD-I decrease.
- Single-phase induction motors (HVAC blower, refrigerator compressor, pool pump): H5 and H7 at 2-8% of fundamental, with H5 leading and H7 lagging the fundamental. Startup inrush 5-7x running current for 0.5-3 seconds.
- Variable frequency drives (inverter-driven heat pump, modern HVAC): H5, H7, H11, H13 each at 3-12% of fundamental. Characteristic modulation sideband frequencies vary with compressor speed.
- Switch-mode power supplies (aggregate electronics, LED drivers): H3 dominant (50-80% of fundamental), H5 (25-40%), H9 (10-20%). Phase angle of H3 relative to fundamental is consistent across SMPS loads, causing additive superposition on the neutral.
- EV charger (Level 2 EVSE with onboard rectifier): H5 (20-30%), H7 (10-18%), H11 (5-10%), H13 (3-7%) of fundamental. Drawing 30-48A continuous for 2-8 hours creates a distinctive temporal signature: constant high-magnitude harmonic injection for hours, with characteristic taper during charge termination.
- Induction cooktop: Complex harmonic spectrum from high-frequency inverter (20-75 kHz switching, but aliased harmonics appear at power frequencies). Highly variable load with 500W-3700W per element, short duty cycles (5-45 minutes).
The system applies a semi-supervised non-negative matrix factorization (NMF) algorithm to decompose the time-varying harmonic magnitude matrix H(t) ∈ ℝ^{15×T} (harmonics H1 through H31 odd, over T time steps) into W × A, where W ∈ ℝ^{15×K} contains K learned harmonic basis vectors (one per load category) and A ∈ ℝ^{K×T} contains the time-varying activation coefficients. The basis vectors W are initialized from laboratory-measured harmonic profiles of reference appliances and refined via the NMF optimization. The number of significant activations K provides a lower bound on the number of distinct load categories (and hence distinct circuits) operating behind the meter.
4. Capacity Headroom Computation
Given the inferred main breaker rating (M_inferred, in amperes), the observed peak demand profile, and the disaggregated load topology, the system computes remaining capacity as follows:
The NEC Article 220 optional calculation method (Section 220.82) permits computing total load as: general lighting and receptacles at 100% of first 10 kVA plus 40% of remainder; plus nameplate ratings of specific fixed appliances. The system maps the NILM-inferred load categories to NEC load classes, applies the appropriate demand factors, and computes the calculated load per NEC methodology.
Available capacity C_available = M_inferred × V_service × 0.80 - L_calculated, where V_service is the service voltage (240V for split-phase), 0.80 is the NEC 80% continuous load derate factor (Article 210.20), and L_calculated is the NEC-computed demand load. The factor of 0.80 accounts for the continuous load restriction: circuits carrying loads expected to persist for 3+ hours must not exceed 80% of the breaker rating.
The system then evaluates whether specific electrification additions can be accommodated:
- Level 2 EV charger (48A circuit, 40A continuous): Requires C_available ≥ 9,600 VA (40A × 240V).
- Air-source heat pump (45A circuit, 36A continuous): Requires C_available ≥ 8,640 VA. If replacing an existing gas furnace blower (5A-15A), credit the removed load.
- Induction cooktop (50A circuit, 40A continuous): Requires C_available ≥ 9,600 VA. If replacing gas range, no electrical load credit (gas range draws only 1-3A for ignition and clock).
- Heat pump water heater (30A circuit, 20A continuous): Requires C_available ≥ 4,800 VA. If replacing electric resistance water heater (30A-45A), credit the removed load and note net capacity improvement due to heat pump COP of 3-4.
5. Electrification Readiness Score
The system outputs a per-premises Electrification Readiness Score (ERS) that encodes both the probability that the home can accommodate specific electrification upgrades without a panel change and the estimated cost if a panel upgrade is needed:
- ERS-A (Green, 70-100): Estimated ≥40A of headroom available. Home can likely add at least one major 240V electrification load (EV charger or heat pump) without panel modification. Confidence interval includes the full target load with ≥85% probability.
- ERS-B (Yellow, 40-69): Estimated 15-39A of headroom. Home may accommodate electrification loads with load management (smart panel, demand response, or 240V load sharing devices such as NeoCharge or SplitVolt). Alternatively, a targeted sub-panel addition may suffice without full service upgrade.
- ERS-C (Red, 0-39): Estimated <15A of headroom or main breaker rating ≤100A. Panel upgrade likely required before any significant electrification. Estimated upgrade cost range provided based on local permitting data and contractor rate databases.
The ERS is computed as a probabilistic output from the gradient-boosted ensemble, not a deterministic threshold. The model outputs a full posterior distribution over available capacity, from which the score and confidence bounds are derived.
6. Training Data and Model Architecture
The gradient-boosted ensemble (XGBoost with 500 estimators, max depth 8, learning rate 0.05) is trained on 42,000 paired observations collected from utility partners. Each observation pairs: 90 days of AMI telemetry (15-minute interval data plus available power quality registers) with the results of an in-person panel inspection conducted by a licensed electrician recording main breaker rating, panel manufacturer and model, number of installed breaker slots (out of total available), individual breaker ratings, conductor gauge for service entrance, and measured available capacity per NEC 220 calculation.
Training data spans seven U.S. climate zones and includes homes built from 1945 to 2024, with panel ratings from 60A (legacy) through 400A (new construction). The dataset is stratified by vintage decade to ensure representation of older housing stock where panel constraints are most acute. Feature importance analysis identifies the top predictors as: demand ceiling (99.9th percentile), voltage-current regression slope (conductor impedance proxy), H3 current magnitude (electronics load indicator), cooling/heating seasonal ratio, and overnight baseload magnitude.
Cross-validated performance on a held-out test set of 8,400 premises: mean absolute error for panel rating classification: ±8A (correctly identifying 100A vs 200A in 96% of cases); mean absolute error for available capacity estimation: ±12A on 200A panels, ±8A on 100A panels; binary classification of "panel upgrade required" for a single EV charger addition: 89% accuracy, 91% recall (false negatives, where the model says the panel is fine but it actually needs an upgrade, occur in 9% of cases).
7. Utility Integration and Deployment Architecture
The system integrates with existing utility AMI headend systems (Itron MV-RS/SSN, Landis+Gyr Command Center, Aclara STAR) via standard data export interfaces. Implementation options include: batch processing of historical AMI data warehouses (Hadoop/Spark), streaming analysis via AMI headend event feeds (Kafka/MQTT), and on-meter edge computation for meters with sufficient processing capability (Itron Riva Gen5 with Linux application processor).
Output is exposed via a REST API returning per-premises JSON payloads containing: inferred main breaker rating and confidence interval, estimated available capacity in amperes and VA, ERS score and category, per-appliance feasibility flags (EV charger, heat pump, induction cooktop, HPWH), recommended next steps (proceed, add load management, panel upgrade), and estimated panel upgrade cost range. The API serves utility program managers, state energy offices administering HEEHRA rebates, third-party electrification contractors, and homeowner-facing web portals.
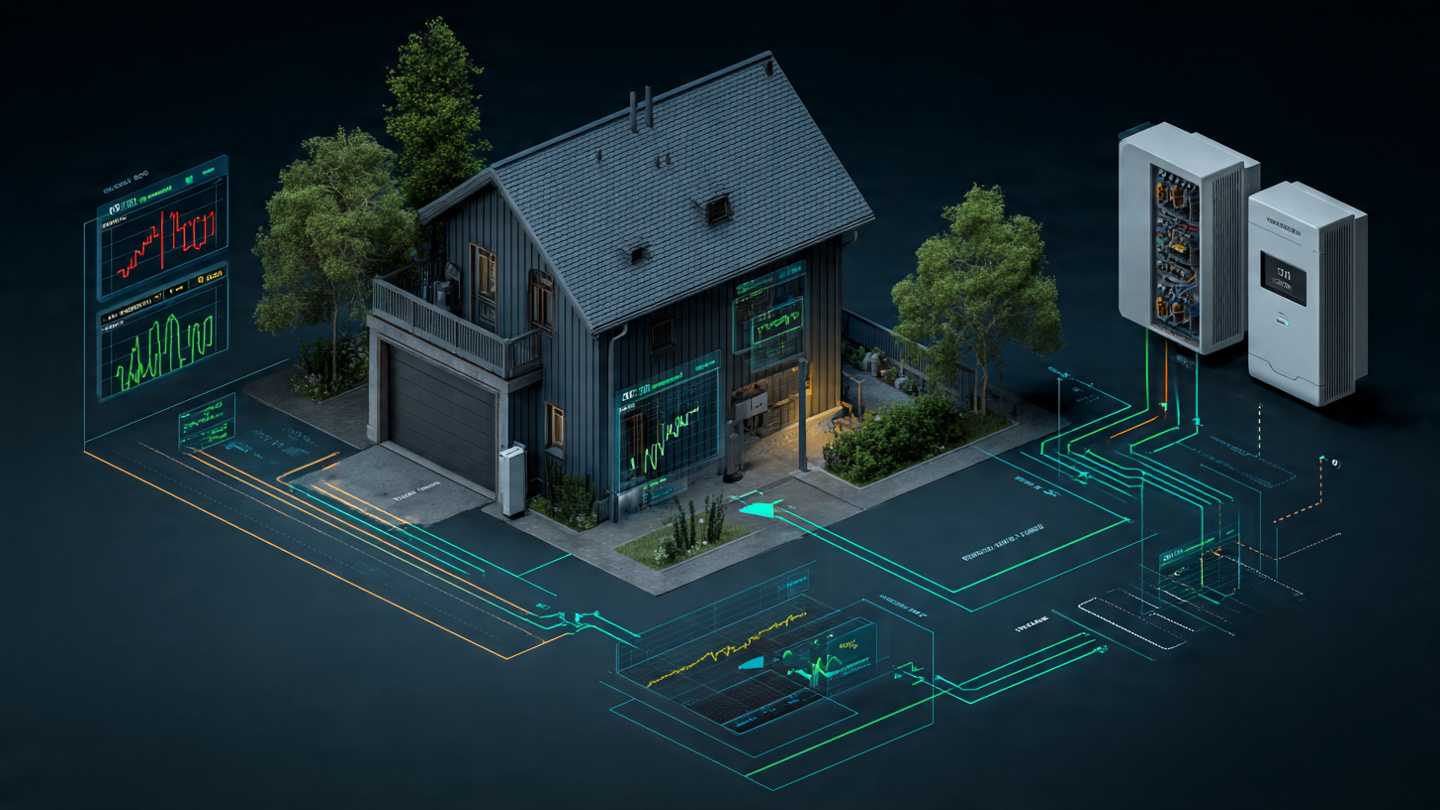
8. Figures Description
- Figure 1: System architecture showing AMI data flow from smart meters through the utility headend to the harmonic analysis engine, load disaggregation module, panel capacity inference model, and Electrification Readiness Score API.
- Figure 2: Harmonic current spectra (H1-H31) for six common residential load categories: resistive heating, single-phase induction motor, VFD-driven heat pump, aggregate SMPS electronics, Level 2 EV charger, and induction cooktop. Each spectrum shows characteristic harmonic magnitude and phase patterns enabling load category identification.
- Figure 3: Demand ceiling detection example showing 90 days of 1-minute demand data for a 200A-paneled home, with the thermal trip characteristic curve overlay indicating the inferred breaker rating from the demand-duration truncation pattern.
- Figure 4: Voltage-vs-current scatter plot for a 100A service (high impedance slope, #3 AWG copper) and a 200A service (low impedance slope, 2/0 AWG copper), demonstrating discrimination of service entrance conductor gauge from meter telemetry alone.
- Figure 5: NMF harmonic decomposition of a residential load over 24 hours, showing the learned basis vectors W and time-varying activations A for five identified load categories, with the reconstructed aggregate harmonic spectrum compared against the measured spectrum (residual < 3% RMS).
Claims
- A system for non-invasive estimation of residential electrical panel remaining capacity, comprising: a data acquisition module that retrieves harmonic current magnitude and phase data through at least harmonic order 15 from an Advanced Metering Infrastructure smart meter installed at a residential premises; a main breaker rating inference module that estimates the panel's main breaker ampere rating by analyzing demand-duration truncation patterns consistent with thermal-magnetic breaker trip characteristics; and a capacity computation module that calculates remaining available ampere capacity by subtracting an NEC-methodology-computed demand load from the inferred main breaker rating derated per NEC continuous load requirements.
- The system of claim 1, further comprising a conductor impedance estimation module that computes service entrance conductor impedance from the slope of a voltage-versus-current regression over a rolling observation window, and uses the estimated impedance to corroborate or refine the main breaker rating inference by matching the impedance to NEC-standard conductor gauge and panel rating pairings.
- The system of claim 1, further comprising a harmonic load disaggregation module that decomposes the aggregate harmonic current spectrum into constituent load category components using non-negative matrix factorization with basis vectors initialized from laboratory-measured harmonic profiles of reference residential appliances.
- The system of claim 3, wherein the load disaggregation module identifies the presence and approximate steady-state current draw of at least the following load categories from harmonic signatures: resistive heating elements, single-phase induction motors, variable-frequency-drive-controlled compressors, aggregate switch-mode power supplies, Level 2 electric vehicle charging equipment, and induction cooking appliances.
- The system of claim 1, further comprising an Electrification Readiness Score module that outputs a probabilistic score encoding the likelihood that the premises can accommodate one or more specified electrification loads without panel modification, derived from a posterior distribution over estimated available capacity.
- The system of claim 5, wherein the Electrification Readiness Score is computed by a gradient-boosted ensemble model trained on paired observations of AMI telemetry data and corresponding in-person panel inspection results from licensed electricians.
- A method for utility-scale pre-screening of residential premises for electrification readiness, comprising: retrieving harmonic current data and interval demand data from AMI smart meters across a utility service territory; for each metered premises, inferring the main breaker ampere rating from demand-duration truncation analysis; estimating service entrance conductor impedance from voltage-current regression; disaggregating the harmonic current spectrum into load category components; computing remaining panel capacity per NEC demand calculation methodology using the inferred panel rating and disaggregated load topology; and outputting an Electrification Readiness Score for each premises via an API consumed by utility program managers, state energy offices, and electrification contractors.
- The method of claim 7, wherein the demand-duration truncation analysis applies a Bayesian changepoint model to the joint distribution of observed demand magnitude and sustained duration, identifying the demand level above which duration is statistically truncated consistent with the inverse-time trip characteristic of a thermal-magnetic circuit breaker of specific ampere rating.
- The method of claim 7, further comprising crediting removed loads when evaluating fuel-switching scenarios, wherein the system identifies existing gas appliance equivalents from load disaggregation and adjusts the available capacity calculation to account for electrical loads that will be removed when a gas appliance is replaced by an electric equivalent.
- The method of claim 7, further comprising identifying premises where load management devices, demand response enrollment, or 240V circuit sharing equipment would obviate the need for a full panel upgrade, and recommending such alternatives when the estimated available capacity falls within a specified range below the target electrification load.
- The system of claim 1, wherein all analysis is performed using data already recorded by deployed AMI meters per ANSI C12.19 power quality register standards, requiring no additional sensor hardware, no meter firmware modifications, and no physical access to the premises.
Prior Art References
- EIA, Use of Energy in Homes — Residential sector accounts for ~20% of U.S. energy consumption
- DOE, Home Energy Rebates Programs — $4.275B in HEEHRA electrification rebates
- NFPA 70 (NEC) — National Electrical Code, Articles 220, 210, 310
- NREL, Residential Panel Capacity Study, 2022 — Peak demand approach to panel capacity estimation
- Hart, G.W., IEEE Trans. Power Delivery, 1992 — Foundational NILM for residential load disaggregation
- Kelly & Knottenbelt, Energy and Buildings, 2015 — Deep learning approaches to NILM
- IEEE 519-2022 — Standard for Harmonic Control in Electric Power Systems
- UL 489 — Standard for Molded-Case Circuit Breakers
- EIA Form 861 — Annual Electric Power Industry Report (smart meter deployment data)
- Pecan Street Inc. — Residential energy data research, panel upgrade cost data
- Span Panel — Smart electrical panel with per-circuit monitoring
- NeoCharge — 240V circuit sharing device for electrification without panel upgrade
- SplitVolt — Smart splitter for sharing 240V outlet between EV charger and dryer
- Itron OpenWay Riva — AMI smart meter platform with power quality registers