System and Method for Distributed Photovoltaic Array Fault Detection and Power Loss Attribution Using Inter-Inverter Production Correlation Analysis and Weather-Normalized Degradation Modeling
Abstract
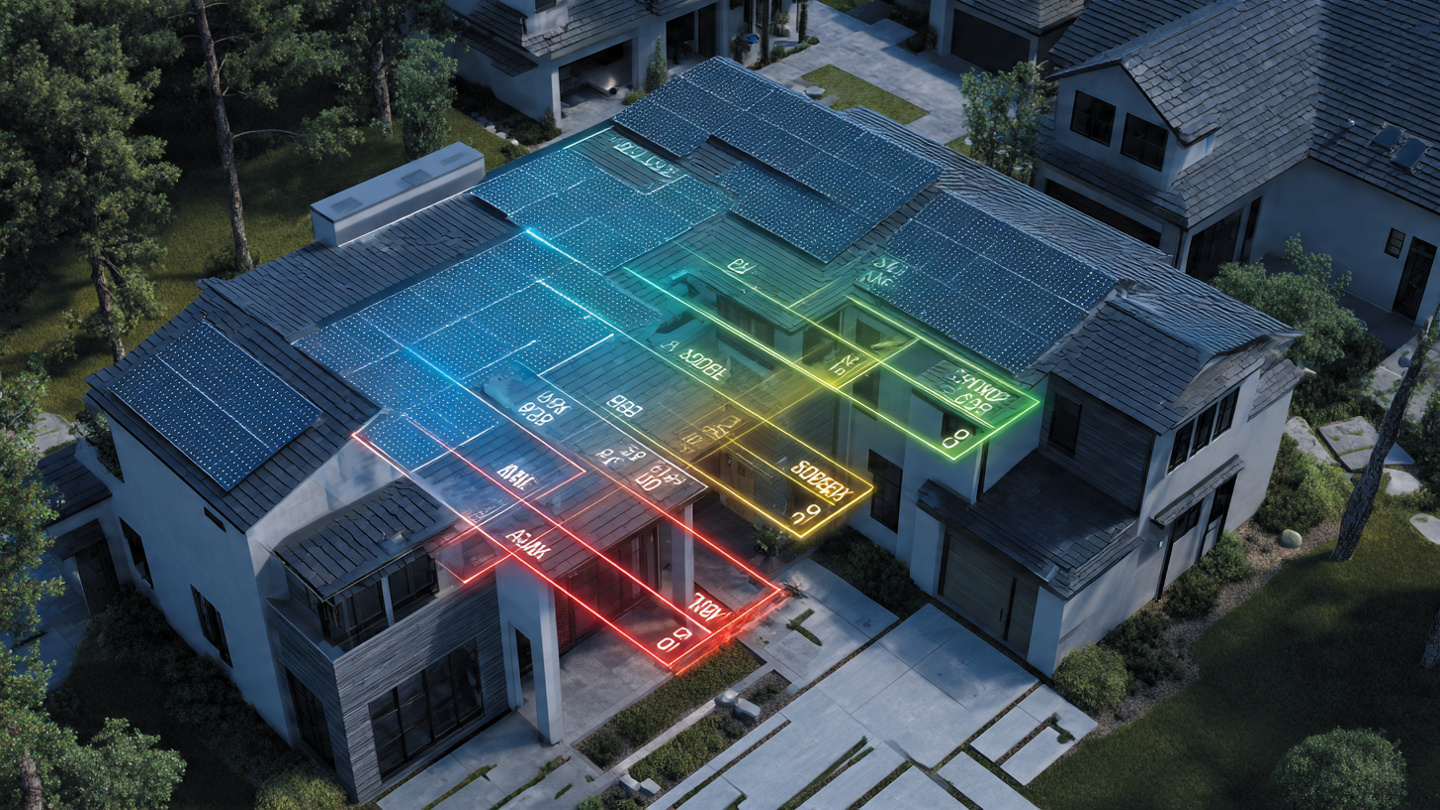
Disclosed is a system and method for detecting, classifying, and quantifying faults in distributed photovoltaic (PV) installations by exploiting the statistical correlation structure of production telemetry across co-located microinverters. In a residential or commercial PV array where each panel connects to an individual microinverter (e.g., Enphase IQ8+, AP Systems DS3), all panels share nearly identical irradiance, ambient temperature, and spectral conditions at any given moment. The system ingests per-inverter AC power, voltage, current, and temperature readings at 5-minute intervals via existing monitoring APIs. A weather-normalized expected-production model, trained per installation using the first 90 days of clean operation as a baseline, predicts each inverter's output as a function of global horizontal irradiance (GHI) from the nearest weather station, ambient temperature, solar zenith angle, and day-of-year spectral correction. The system then computes pairwise Pearson correlation coefficients and normalized production ratios across all inverters within a rolling 7-day window. Deviations from the baseline correlation matrix and production ratio vector are classified into five fault categories: partial shading (time-of-day-dependent production deficit in a spatial subset), soiling (gradual monotonic decline in a spatial cluster), cell or interconnect degradation (step-change or accelerating decline in a single inverter's ratio), connector or wiring resistance increase (current-dependent power loss increasing with irradiance), and inverter electronics degradation (efficiency curve shape change visible in the power-vs-irradiance relationship). Each fault type produces a mathematically distinct signature in the correlation-ratio feature space, enabling classification without physical inspection. The system generates prioritized maintenance alerts with estimated annual energy loss per fault, payback period for repair, and suggested remediation actions.
Field of the Invention
This invention relates to photovoltaic system monitoring and predictive maintenance, specifically to automated fault detection and power loss attribution in distributed PV arrays using statistical analysis of production telemetry from existing microinverter hardware without additional sensors or instrumentation.
Background
The United States had 5.6 million residential and commercial PV installations operating as of Q4 2025 (SEIA/Wood Mackenzie), generating approximately 205 GW of cumulative capacity. The vast majority of residential installations built after 2018 use module-level power electronics (MLPE), with Enphase Energy alone reporting 76 million microinverters shipped worldwide through 2025. These microinverters report per-panel production data at 5- to 15-minute granularity via cloud monitoring platforms.
Despite this unprecedented telemetry density, most residential PV system owners and installers lack the tools to detect faults that reduce output without causing complete failure. NREL Technical Report NREL/TP-5J00-65040 found that the median annual degradation rate for crystalline silicon modules is 0.5-0.8%/year under normal conditions, but systems with undetected faults (soiling, partial shading from vegetation growth, connector degradation, cell cracking) can lose 5-15% of annual production. A 2024 Sandia PV Performance Modeling Collaborative analysis estimated that 15-25% of residential PV systems in the U.S. underperform their expected output by more than 10%, often for years before the owner notices.
Current fault detection approaches fall into three categories, each with significant limitations:
- Threshold-based alerts: Monitoring platforms like Enphase Enlighten and SolarEdge Monitoring flag individual inverters whose output drops below a fixed percentage of the array average. These catch complete failures (inverter dead, panel disconnected) but miss slow-onset faults. A panel producing 92% of its expected output generates no alert but loses the owner $40-80/year in a typical 8 kW system.
- Thermal imaging inspection: Drone-mounted or handheld infrared cameras (FLIR, DJI) can identify hot spots from cell cracks, bypass diode failures, and connection resistance. Cost: $150-400 per inspection. Performed at most annually. Cannot detect soiling, inverter degradation, or subtle production deficits.
- I-V curve tracing: Dedicated instruments (e.g., Solmetric PVA-1500) measure the full current-voltage characteristic of each string. Highly diagnostic but requires on-site technician access, system shutdown during measurement, and per-string manual connection. Typical cost: $500-1,500 per visit for a residential system.
The gap in the art is a purely software-based system that exploits the rich telemetry already flowing from installed microinverters to continuously detect and classify faults at the individual panel level, quantify their energy impact, and prioritize maintenance actions, all without additional hardware, site visits, or system downtime. The key non-obvious insight is that co-located microinverters serve as mutual references: because they share the same sky, each panel's production implicitly calibrates every other panel's expected output, enabling detection of faults as small as 3-5% production loss.
Detailed Description
1. Data Acquisition Layer
The system ingests telemetry from microinverter monitoring APIs. For Enphase systems, the Enphase Developer API v4 provides per-microinverter data at 5-minute intervals including: AC power output (watts), AC voltage (volts RMS), AC current (amps RMS), DC voltage (from module optimizer, where available), and microinverter internal temperature (°C). For APsystems, the EMA API provides equivalent fields. The system also ingests: global horizontal irradiance (GHI) from the nearest weather station in the NSRDB or from a co-located pyranometer if available, ambient temperature from the same source, and historical GHI data for baseline training.
Data quality filters reject intervals where: GHI < 50 W/m² (low signal-to-noise), any inverter reports zero power while others report > 100 W (likely communication dropout, not fault), or temperature data is missing or out of range (-40 to +85 °C).
2. Weather-Normalized Expected Production Model
During the first 90 days of monitoring (or using the cleanest 90-day window in historical data), the system builds a per-inverter expected production model. The model predicts AC power output P_expected(i,t) for inverter i at time t as a function of four variables:
- GHI(t): Global horizontal irradiance at time t, interpolated to 5-minute resolution.
- T_amb(t): Ambient temperature, which affects module efficiency via the temperature coefficient (typically -0.35 to -0.45%/°C for crystalline silicon).
- θ_z(t): Solar zenith angle at time t, computed from latitude, longitude, day of year, and time of day using the NREL Solar Position Algorithm. This captures the cosine incidence angle effect and atmospheric mass variation.
- DOY(t): Day of year, which serves as a proxy for spectral content variation (shorter wavelengths in summer, longer in winter) and Linke turbidity seasonal patterns.
The model is a gradient-boosted regression tree (XGBoost, 100 estimators, max depth 4, learning rate 0.1) trained on the baseline period. Separate models are trained for each inverter to capture panel-specific characteristics (orientation, tilt, nearby obstructions). The model achieves typical RMSE of 3-5% of rated power on held-out validation data from the baseline period, which sets the detection sensitivity floor.
3. Inter-Inverter Correlation Matrix
The core detection mechanism exploits the fact that co-located panels share irradiance conditions. For an array of N microinverters, the system computes two feature sets on a rolling 7-day window:
Pairwise Pearson Correlation Matrix C(i,j): The correlation coefficient between the 5-minute power time series of inverters i and j. In a healthy array, C(i,j) > 0.995 for all pairs during clear-sky periods. Fault conditions reduce the correlation between the affected inverter and its neighbors.
Normalized Production Ratio Vector R(i): For each inverter i, R(i) = Σ P_actual(i,t) / Σ P_expected(i,t) over the 7-day window. A healthy inverter has R(i) ≈ 1.0 (within the 3-5% model error band). A faulty inverter has R(i) < 1.0 by an amount proportional to the fault severity.
The system also computes time-resolved production ratios R(i, hour) for each hour of the day, enabling detection of time-dependent faults like partial shading that only affect certain solar angles.
4. Fault Classification Engine
Each fault type produces a distinct signature in the correlation-ratio feature space:
Fault Type A: Partial Shading. One or more inverters show depressed R(i, hour) during specific hours of the day (e.g., morning or afternoon), while maintaining R(i, hour) ≈ 1.0 during other hours. The affected hours shift seasonally as shadow angles change. Detection: fit a time-of-day Gaussian mixture model to the residuals R(i, hour) - R_baseline(i, hour). A bimodal distribution (shaded hours vs. unshaded hours) with separation > 2σ triggers a shading classification. The system further identifies the likely shading source by analyzing: which panels are affected (spatial pattern), which hours show depression (shadow direction), and seasonal shift rate of the affected hours (shadow source distance and height).
Fault Type B: Soiling. A subset of spatially adjacent inverters shows R(i) declining monotonically over weeks or months, with the decline rate accelerating between rain events and partially resetting after rain. Detection: compute the 30-day rolling slope of R(i) for each inverter. Flag clusters of adjacent inverters where the slope is more negative than -0.001/day (1% per month) and the slope exhibits negative correlation with cumulative precipitation (soiling resets with rain). The spatial clustering is a key differentiator from cell degradation, which affects individual panels.
Fault Type C: Cell or Interconnect Degradation. A single inverter shows a step-change or steadily accelerating decline in R(i) that is independent of time-of-day, weather conditions, and spatial position in the array. Detection: apply a CUSUM (cumulative sum) change-point detector to R(i) with a threshold of 3σ. A detected change point indicates either a sudden event (cell crack from thermal stress or hail) or a gradual process (solder joint fatigue, encapsulant browning) that has crossed the detection threshold. Differentiated from soiling by: (a) affecting only a single panel rather than a spatial cluster, (b) not correlating with precipitation patterns, and (c) not recovering after rain.
Fault Type D: Connector or Wiring Resistance Increase. An affected inverter shows R(i) that declines as irradiance increases, because higher irradiance produces higher current, which produces greater I²R loss across the degraded connection. Detection: partition the 7-day data into irradiance bins (0-200, 200-400, 400-600, 600-800, 800+ W/m²). Compute R(i) within each bin. A negative slope of R(i) vs. irradiance bin (i.e., the panel underperforms more on sunny days) indicates resistive loss. Quantification: the slope of the R(i)-vs-irradiance relationship estimates the added series resistance. For a typical 60-cell module producing 10A at peak, a 0.5Ω connector resistance increase causes 50W loss at peak (roughly 12% of rated power), manifesting as R(i) ≈ 1.0 at 200 W/m² but R(i) ≈ 0.88 at 800+ W/m².
Fault Type E: Inverter Electronics Degradation. The inverter's efficiency curve (AC output / DC input, as a function of power level) shifts over time. This manifests as a change in the shape of the P_actual vs. GHI relationship: the inverter underperforms disproportionately at either low or high irradiance levels, depending on which internal component is degrading (e.g., capacitor aging reduces low-light tracking efficiency, MOSFET degradation increases switching losses at high power). Detection: fit a second-order polynomial to the P_actual / P_expected ratio as a function of GHI for each 30-day window. Compare polynomial coefficients to the baseline period. A statistically significant change in the quadratic coefficient (shape change) indicates inverter degradation rather than module degradation.
5. Energy Loss Quantification and Maintenance Prioritization
For each detected fault, the system computes:
- Annual energy loss (kWh/year): Integrate the difference between P_expected(i,t) and P_actual(i,t) over a typical meteorological year, scaled from the observed fault severity.
- Revenue impact ($/year): Multiply energy loss by the applicable retail electricity rate or feed-in tariff, accounting for net metering rules and time-of-use rate structures.
- Fault progression rate: For progressive faults (soiling, degradation), extrapolate the current trend to estimate future energy loss if unaddressed.
- Repair cost estimate: Based on fault type, the system provides a cost range from industry benchmarks: panel cleaning ($5-15/panel), connector replacement ($150-300 installed), panel replacement ($300-600 installed), inverter replacement ($200-400 installed).
- Payback period: Repair cost divided by annual revenue impact. Faults with payback < 2 years are flagged as high priority.
Maintenance alerts are ranked by payback period, with the shortest payback (highest ROI) faults recommended first.
6. Continuous Learning and Model Update
After a verified repair event (production ratio recovers to baseline), the system retrains the affected inverter's expected production model using post-repair data. This handles legitimate changes to the installation (tree trimming restores unshaded production, panel replacement changes module characteristics). The system also performs annual model recalibration using the cleanest 30-day window in the preceding year to account for normal aging (0.5-0.8%/year degradation in healthy panels).
7. Figures Description
- Figure 1: System architecture showing data flow from microinverter monitoring APIs through weather normalization, correlation analysis, fault classification, and maintenance alert generation.
- Figure 2: Example correlation matrix heatmap for a 24-panel residential array, showing a healthy baseline (all C > 0.995) versus a fault condition (one panel at C = 0.92 with neighbors, indicating cell degradation).
- Figure 3: Time-of-day production ratio profiles for the five fault types, demonstrating the distinct signatures: partial shading (morning dip), soiling (uniform decline), cell degradation (uniform decline, single panel), connector resistance (irradiance-dependent decline), inverter degradation (shape change in efficiency curve).
- Figure 4: Monthly production ratio time series for a panel with undetected soiling, showing the sawtooth pattern (gradual decline between rain events, partial recovery after rain) that distinguishes soiling from permanent degradation.
Claims
- A system for detecting faults in a distributed photovoltaic array, comprising: a data acquisition module that ingests per-inverter production telemetry from a plurality of co-located microinverters at intervals of 15 minutes or less; a weather normalization module that computes expected production for each inverter as a function of irradiance, ambient temperature, solar position, and seasonal spectral variation using a machine learning model trained on a baseline period of clean operation; and a fault detection module that computes pairwise correlation coefficients and normalized production ratios across all inverters within a rolling time window, and classifies deviations from baseline into fault categories based on the mathematical signatures of each fault type in the correlation-ratio feature space.
- The system of claim 1, wherein the fault detection module classifies partial shading faults by fitting a time-of-day mixture model to the production ratio residuals of each inverter and identifying bimodal distributions where production is depressed during specific solar angle windows while remaining normal during other hours.
- The system of claim 1, wherein the fault detection module classifies soiling faults by identifying spatial clusters of adjacent inverters whose normalized production ratios decline monotonically between precipitation events and partially recover after precipitation, using the negative correlation between production ratio slope and cumulative precipitation as a discriminative feature.
- The system of claim 1, wherein the fault detection module classifies connector or wiring resistance increase faults by partitioning production data into irradiance bins and detecting a negative slope in the production ratio as a function of irradiance, indicating current-dependent I²R losses that increase under high-irradiance conditions.
- The system of claim 1, wherein the fault detection module classifies inverter electronics degradation by fitting a parametric curve to the production ratio as a function of irradiance for successive time windows and detecting statistically significant changes in the curve shape coefficients over time.
- A method for quantifying power loss and prioritizing maintenance in a distributed photovoltaic array, comprising: ingesting per-inverter production telemetry from co-located microinverters; computing weather-normalized expected production for each inverter; detecting fault conditions by analyzing deviations in inter-inverter correlation structure and normalized production ratios; classifying detected faults into categories; estimating annual energy loss for each fault by integrating the difference between expected and actual production over a typical meteorological year; computing repair cost estimates and payback periods for each fault; and generating ranked maintenance recommendations ordered by payback period.
- The method of claim 6, further comprising a continuous learning module that retrains the expected production model for an inverter after a verified repair event, using post-repair production data to establish a new baseline that accounts for changes in the installation.
- The system of claim 1, wherein cell or interconnect degradation faults are classified by applying a cumulative sum change-point detector to the normalized production ratio time series of individual inverters, distinguishing sudden events from gradual degradation by the sharpness of the detected change point, and differentiating from soiling by the absence of spatial clustering and precipitation correlation.
- The system of claim 1, wherein the weather normalization module uses a gradient-boosted regression tree trained on global horizontal irradiance, ambient temperature, solar zenith angle, and day-of-year features from a baseline period of at least 60 days of clean operation, achieving a production prediction accuracy sufficient to detect fault-induced power losses of 3% or greater.
- The system of claim 1, wherein the system operates entirely on telemetry data from existing microinverter monitoring infrastructure without requiring additional sensors, physical site access, or system downtime, and wherein the co-located microinverters serve as mutual calibration references that eliminate the need for a dedicated irradiance sensor at the installation site.
Implementation Notes
The system can be deployed as a cloud-hosted service consuming data from Enphase, APsystems, or other microinverter monitoring APIs. No hardware installation is required at the PV site. The computational requirements are modest: the correlation and ratio calculations for a 30-panel system over a 7-day window involve approximately 60,000 data points per inverter, and the XGBoost model inference requires < 1 ms per prediction on commodity cloud hardware. A single server instance can monitor 10,000+ residential systems. The detection sensitivity floor of 3-5% production loss per panel corresponds to approximately $15-40/year in lost revenue per panel at typical U.S. retail electricity rates ($0.12-0.30/kWh), or $60-200/year for a 4-panel fault cluster. For a typical 8 kW residential system (20-24 panels), the system can detect faults causing as little as $100/year in lost production, well below the cost of a single professional inspection visit.
Prior Art References
- SEIA/Wood Mackenzie U.S. Solar Market Insight: 5.6M U.S. PV installations, 205 GW cumulative capacity (Q4 2025)
- Enphase Energy Investor Relations: 76M microinverters shipped worldwide through 2025
- NREL Technical Report NREL/TP-5J00-65040: PV degradation rates and long-term reliability analysis
- Sandia PV Performance Modeling Collaborative: PV degradation modeling and RdTools methodology
- Enphase Developer API v4: Per-microinverter telemetry access at 5-minute intervals
- APsystems EMA Platform: Module-level monitoring and data export
- NSRDB (National Solar Radiation Database): Solar irradiance and meteorological data
- NREL Solar Position Algorithm: Solar zenith angle computation
- Jordan & Kurtz, Progress in Photovoltaics 2013: Photovoltaic degradation rates: an analytical review
- XGBoost Documentation: Gradient boosted decision trees for regression
- Zhao et al., IEEE Transactions on Power Delivery 2014: PV fault detection using machine learning on inverter data
- Solmetric PVA-1500: I-V curve tracer for PV fault diagnosis
- US20120247542A1: Method for recognizing faults in a photovoltaic system (UDC voltage measurement)
- EP4165743A1: Device for detecting fault current in a photovoltaic installation