System and Method for Passive Structural Health Monitoring of Bridges Using Consumer Smartphone Accelerometers and Computer Vision
Abstract
Disclosed is a crowdsourced structural health monitoring (SHM) system that combines accelerometer data from smartphones in vehicles crossing bridges with periodic computer-vision analysis of dashcam and smartphone camera footage to detect and track structural deterioration. The system uses GPS geofencing to identify bridge crossings, extracts vertical acceleration profiles corresponding to the bridge's dynamic response, and aggregates data from hundreds of daily crossings to compute statistical indicators of structural health including natural frequency shifts, damping ratio changes, and mode shape anomalies. A companion computer vision module processes dashcam imagery to detect surface cracks, spalling, corrosion staining, and bearing displacement. Both data streams feed a fusion model that generates a composite Structural Health Score (SHS) for each monitored bridge, enabling departments of transportation to prioritize inspection resources without installing dedicated sensor hardware.
Field of the Invention
This invention relates to infrastructure monitoring, specifically to methods for assessing the structural health of bridges using data from consumer mobile devices and vehicle-mounted cameras without dedicated structural monitoring instrumentation.
Background
The United States has 617,084 bridges in the National Bridge Inventory (FHWA, 2023). Of these, 42,966 (7.5%) are classified as structurally deficient (ARTBA Bridge Report 2024). Federal regulations require biennial visual inspections per 23 CFR Part 650, but these inspections are manual, subjective, and provide only snapshot assessments every 24 months.
Dedicated structural health monitoring systems using accelerometers, strain gauges, and tilt sensors cost $50,000-$500,000 per bridge to install and $5,000-$20,000 per year to maintain (FHWA-HRT-14-023). At these costs, continuous monitoring is economically viable only for critical or high-value bridges. The vast majority of the nation's bridges have no continuous monitoring.
Research has established that smartphones can detect bridge vibrations. Matarazzo et al. (2018), published in the Journal of Sound and Vibration, demonstrated that smartphone accelerometers in vehicles can identify the natural frequency of short-to-medium span bridges (20-60m) with accuracy within 5% of reference sensors, using data from as few as 30 crossings. Sitton et al. (2020) showed crowdsourced smartphone data could detect a 10% shift in bridge natural frequency, a threshold commonly associated with significant structural damage.
Relevant prior art includes:
- US10830663B2 (Sensys Networks): Dedicated wireless sensor nodes for bridge monitoring. Requires purpose-built hardware installation.
- US20190346377A1: Vehicle-based road surface monitoring. Focuses on pavement condition, not bridge structural health.
- US11215567B2 (University of Michigan): Crowdsourced road monitoring using smartphone sensors. Pavement roughness only, no bridge modal analysis.
- Matarazzo et al., 2018: Proof of concept for smartphone bridge frequency extraction. Single-sensor, no aggregation system, no computer vision component.
No existing system combines crowdsourced smartphone accelerometry with computer vision to create a continuous, no-hardware bridge monitoring platform.
Detailed Description
1. Bridge Geofencing and Crossing Detection
The system maintains a geospatial database of all NBI-listed bridges, derived from the FHWA NBI dataset which includes latitude/longitude coordinates, span length, deck width, and structure type for each bridge. A geofence polygon is computed for each bridge extending 50 meters beyond the bridge endpoints in the direction of travel and 15 meters laterally.
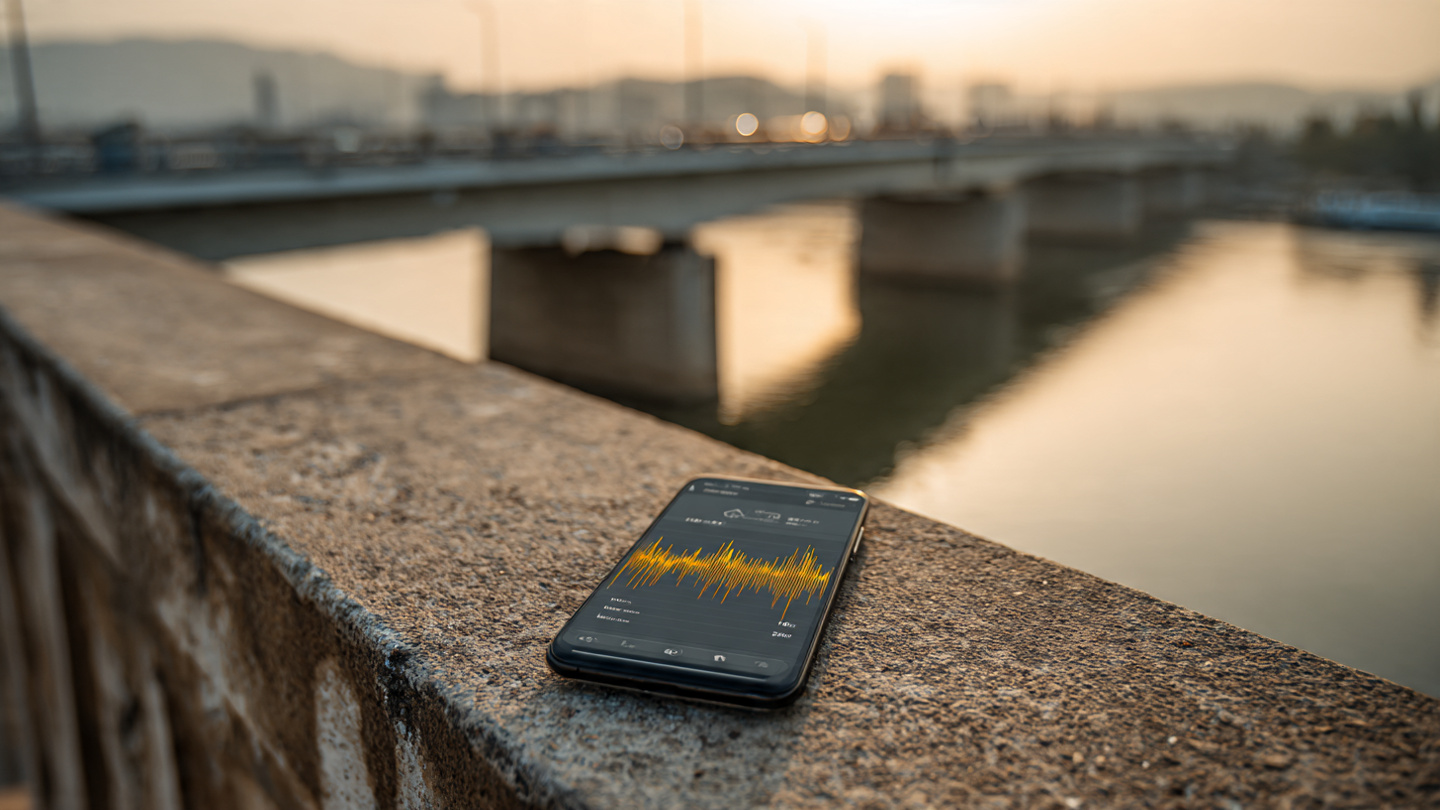
When a participating smartphone enters a bridge geofence (detected via GPS at 1 Hz update rate), the system activates high-frequency accelerometer recording at 100 Hz (the maximum reliably available on current iOS and Android platforms). Recording continues until the device exits the geofence. The GPS fix at geofence entry provides approximate vehicle speed, which is used to compute the expected crossing duration and to normalize acceleration data for speed-dependent effects.
2. Dynamic Response Extraction
The raw vertical acceleration signal from each bridge crossing is processed to extract the bridge's dynamic response, separated from vehicle-specific vibrations:
- Vehicle signature removal: A bandpass filter isolates the frequency range of interest (1-30 Hz) encompassing the first 3-5 natural frequencies of typical highway bridges. Vehicle body resonance (1-2 Hz) and wheel-hop frequencies (10-15 Hz) are identified using a vehicle profile database indexed by speed and removed via adaptive notch filtering.
- Natural frequency extraction: FFT analysis of the filtered signal identifies spectral peaks corresponding to bridge natural frequencies. The system computes: fundamental frequency (f₁), second mode frequency (f₂), and frequency ratio (f₂/f₁) which is diagnostic of damage location.
- Damping ratio estimation: The logarithmic decrement method applied to the free-vibration portion of the signal (after the vehicle has exited each span) estimates modal damping ratios. Increasing damping ratios can indicate crack development or bearing deterioration.
3. Statistical Aggregation Across Crossings
Individual crossing measurements are noisy due to vehicle-specific effects, phone mounting conditions (cup holder vs. pocket vs. dashboard), traffic loading conditions, and environmental factors (temperature, wind). The system addresses this through statistical aggregation:
For each bridge, the system maintains rolling distributions of f₁, f₂, f₂/f₁, and damping ratios computed from the most recent 500 crossings (approximately 2-4 weeks for a bridge with 3,000+ ADT). Outlier crossings (measurement quality score below threshold, based on signal-to-noise ratio and GPS accuracy) are excluded. The system reports the median and 90th percentile confidence interval for each parameter.
A change-point detection algorithm (PELT or equivalent) monitors the rolling distributions for statistically significant shifts. A decrease in f₁ exceeding 5% from the established baseline, sustained for 2+ rolling windows, triggers an alert. This threshold corresponds to the onset of detectable structural damage per the Doebling et al. damage detection threshold (LA-13070-MS).
4. Computer Vision Crack and Deterioration Detection
The companion CV module processes images of bridge elements captured by dashcams or smartphone cameras. Images are matched to specific bridges using GPS metadata and visual landmark matching. A YOLOv8-based object detection model, fine-tuned on bridge deterioration datasets, identifies:
- Surface cracks: Classified by orientation (longitudinal, transverse, diagonal, map/alligator) and estimated width (hairline < 0.1mm, fine 0.1-0.3mm, medium 0.3-1.0mm, wide > 1.0mm) using the camera's known focal length and estimated distance from the deck surface.
- Concrete spalling: Areas where surface concrete has flaked off, exposing aggregate or reinforcement. Classified by depth and area.
- Corrosion staining: Rust staining on concrete surfaces indicating reinforcement corrosion underneath. Detected by color analysis in HSV space (hue 10-25°, saturation > 40%).
- Bearing displacement: Visible offset of bearing pads or rollers from their designed position, detected by comparison to reference geometry extracted from bridge type classification.
- Joint deterioration: Expansion joint seal failure, debris accumulation, or differential elevation across joints.
5. Fusion Model and Structural Health Score
The accelerometry and computer vision data streams are combined in a fusion model that generates a Structural Health Score (SHS) on a 0-100 scale for each bridge:
SHS = 100 - (w_freq × ΔF_score + w_damp × ΔD_score + w_crack × Crack_score + w_spall × Spall_score + w_corr × Corrosion_score)
Where ΔF_score quantifies the frequency shift from baseline, ΔD_score quantifies damping ratio changes, and the CV scores quantify observed deterioration severity. Weights are calibrated against NBI condition ratings from the most recent inspection cycle using a training set of bridges with both crowdsourced and official inspection data.
The SHS is updated continuously as new crossing data arrives. When SHS drops below configurable thresholds (default: 70 for advisory, 50 for priority inspection recommendation), the system generates alerts to the relevant DOT district.
6. Figures Description
- Figure 1: System architecture showing smartphone data collection, cloud aggregation, CV analysis pipeline, fusion model, and DOT dashboard output.
- Figure 2: Example accelerometer trace from a single bridge crossing, showing raw signal, bandpass-filtered signal, and extracted bridge response with identified natural frequency peaks.
- Figure 3: Statistical aggregation visualization showing rolling distribution of f₁ for a bridge over 6 months, with change-point detection identifying a 7% frequency drop.
- Figure 4: YOLOv8 detection output on a bridge deck image showing bounding boxes for transverse cracks, spalling area, and corrosion staining with severity classifications.
- Figure 5: DOT dashboard showing map view of monitored bridges color-coded by SHS, with drill-down showing time series of all monitored parameters.
Claims
- A method for monitoring the structural health of bridges, comprising: geofencing bridge locations using a national bridge inventory database; automatically recording high-frequency accelerometer data from consumer smartphones in vehicles crossing said bridges; extracting bridge dynamic response parameters including natural frequencies and damping ratios from the accelerometer data; statistically aggregating measurements from a plurality of crossings; detecting changes in said parameters indicative of structural deterioration; and generating structural health scores for each monitored bridge.
- The method of claim 1, further comprising processing camera imagery captured during or near bridge crossings using a computer vision model trained to detect surface cracks, spalling, corrosion staining, bearing displacement, and joint deterioration.
- The method of claim 2, further comprising fusing the accelerometer-derived dynamic parameters with computer-vision-derived deterioration indicators in a weighted model calibrated against official bridge inspection ratings.
- The method of claim 1, wherein vehicle-specific vibration signatures are separated from bridge dynamic response using adaptive notch filtering informed by a vehicle profile database indexed by speed.
- The method of claim 1, wherein natural frequency extraction is performed via FFT analysis of bandpass-filtered vertical acceleration data, computing fundamental frequency, second mode frequency, and their ratio as a diagnostic indicator of damage location.
- The method of claim 1, wherein change-point detection algorithms monitor rolling distributions of extracted parameters and generate alerts when shifts exceeding 5% from baseline are sustained for multiple rolling windows.
- A system for crowdsourced bridge structural health monitoring comprising: a geospatial database of bridge locations derived from the National Bridge Inventory; a mobile application for automatic high-frequency accelerometer recording during detected bridge crossings; a cloud aggregation service for statistical combination of crossing measurements; a computer vision model for bridge deterioration detection from camera imagery; a fusion model combining dynamic and visual indicators into a composite structural health score; and a dashboard for infrastructure managers displaying health scores and alert recommendations.
- The system of claim 7, wherein accelerometer data quality is assessed by signal-to-noise ratio and GPS accuracy, and low-quality crossings are excluded from aggregation.
- The system of claim 7, wherein the computer vision model estimates crack width using the camera's known focal length and estimated distance from the bridge surface.
- The system of claim 7, further comprising a vehicle speed normalization module that adjusts dynamic response extraction parameters based on GPS-derived crossing speed to account for speed-dependent bridge excitation effects.
Prior Art References
- FHWA National Bridge Inventory — 617,084 bridges (2023)
- ARTBA Bridge Report 2024 — 42,966 structurally deficient bridges
- 23 CFR Part 650 — Federal Bridge Inspection Standards
- US10830663B2 — Sensys Networks — Wireless Bridge Sensor Nodes
- US20190346377A1 — Vehicle Road Surface Monitoring
- US11215567B2 — University of Michigan — Crowdsourced Road Monitoring
- Matarazzo et al. — "Smartphone Bridge Frequency Extraction" — J. Sound and Vibration 2018
- Sitton et al., 2020 — "Crowdsourced Bridge Frequency Detection"
- Doebling et al. — "Damage Identification from Changes in Vibration Characteristics" — LA-13070-MS (Los Alamos)
- Ultralytics YOLOv8 — Object Detection Framework
- FHWA-HRT-14-023 — Structural Health Monitoring of Highway Bridges
- FHWA NBI ASCII Data Files — Bridge coordinate and classification data
- Killick et al. — "Optimal Detection of Changepoints" (PELT algorithm)
- Logarithmic Decrement Method — Modal damping estimation technique
- Journal of Sound and Vibration — Elsevier