System and Method for Municipal Water Distribution Network Leak Detection and Localization Using Crowdsourced Pressure Telemetry from Consumer Smart Water Meters and Physics-Informed Graph Neural Networks
Abstract
Disclosed is a system and method for detecting and localizing leaks in municipal water distribution mains by aggregating high-frequency pressure telemetry from networks of consumer-grade smart water meters installed at residential and commercial service connections. When a leak opens or enlarges in a distribution main, the sudden change in flow creates a pressure transient that propagates through the pipe network at 800 to 1,400 m/s (depending on pipe material, diameter, and wall thickness). Consumer smart water meters with integrated piezoresistive pressure sensors (sampling at 120 to 240 Hz, resolution 0.01 to 0.1 psi) detect this transient at different arrival times depending on their hydraulic distance from the leak. A cloud-based aggregation engine collects timestamped pressure telemetry from participating meters across a pressure zone, applies a physics-informed graph neural network (PI-GNN) whose graph structure mirrors the utility's pipe network topology, and performs joint leak detection and localization by inverting the observed pressure transient arrival times and amplitudes against a learned hydraulic wave propagation model. The system also detects slow-developing leaks (growing background leakage) by monitoring long-term statistical shifts in overnight minimum pressure across the meter network, identifying zones where baseline pressure has drifted downward over weeks to months. All consumer-facing data is privacy-preserved through differential pressure reporting (deviations from a rolling baseline, not absolute values), preventing inference of individual household water usage patterns from the aggregated municipal leak detection data.
Field of the Invention
This invention relates to municipal water infrastructure monitoring, specifically to the repurposing of consumer-grade smart water meters as a distributed pressure sensing network for detecting and localizing leaks in water distribution mains, using physics-informed graph neural networks that incorporate pipe network topology and hydraulic wave propagation models.
Background
The American Water Works Association (AWWA) estimates that U.S. water utilities lose approximately 6 billion gallons of treated drinking water per day to leaks in distribution infrastructure, representing 14 to 18% of total production nationally and exceeding 30% in older systems. The 2021 ASCE Infrastructure Report Card graded U.S. drinking water infrastructure at C-minus, noting an estimated 240,000 water main breaks per year. The economic cost of non-revenue water (treated, pumped water that never reaches a customer meter) exceeds $7.6 billion annually in the United States alone. Globally, the World Bank estimates that utilities lose $14 billion per year to physical water losses.
Current leak detection methods fall into two categories. Active methods require deploying specialized equipment: acoustic leak correlators (SebaKMT, Gutermann) that clamp hydrophones onto two access points bracketing a suspected leak section, cross-correlate the acoustic noise, and compute leak position from the time-delay and known pipe length. These achieve 0.5 to 2 meter localization accuracy on metallic pipes but degrade severely on plastic (PVC, HDPE) pipes that attenuate acoustic signals by 10 to 100 times compared to cast iron. Active acoustic surveys cost $500 to $2,000 per mile and are performed infrequently (annually or less) due to labor intensity. Satellite-based leak detection (Utilis/Asterra, using L-band SAR to detect subsurface moisture anomalies) covers large areas but provides only 100-meter spatial resolution and cannot detect leaks smaller than approximately 10 gallons per minute. Ground-penetrating radar requires truck-mounted equipment at $3,000 to $5,000 per day.
Passive methods use permanently installed sensors. District metered areas (DMAs) divide the network into zones of 1,000 to 3,000 service connections, each with a flow meter at the inlet. Comparing nighttime minimum flow (typically 2:00 to 4:00 AM) against a baseline reveals new leakage, but only at the DMA level. Localizing the leak within the DMA still requires acoustic surveys. Deploying dedicated pressure loggers (e.g., SebaKMT Correlux) at higher density improves resolution but costs $800 to $3,000 per logger plus installation, making fine-grained deployment across an entire network prohibitively expensive for most utilities.
Meanwhile, the consumer smart water meter market has grown rapidly. Devices from Phyn (Belkin/Uponor), Flume, Flo by Moen, and StreamLabs are installed at millions of residential service connections. These devices measure water pressure continuously: the Phyn Plus, for example, uses a piezoresistive pressure transducer sampling at 240 Hz with 0.01 psi resolution, primarily to detect household leaks by monitoring for sustained flow during periods of expected zero usage. The Flo by Moen samples pressure and flow at similar rates. Crucially, these devices are connected via WiFi and report telemetry to cloud platforms. Each one is, in effect, a high-precision pressure sensor permanently installed on the water distribution network at the service connection point, reporting continuously to the internet. Nobody is using this data for municipal leak detection.
The physics that makes this possible is well established. When a leak opens in a pressurized pipe, the sudden flow increase creates a rarefaction (negative pressure) wave that propagates outward from the leak at the wave speed of the fluid-pipe system. For water in cast iron pipe, wave speed is approximately 1,200 m/s; in PVC, approximately 300 to 500 m/s; in ductile iron, 1,000 to 1,100 m/s (see Duan et al., 2006). This transient is detectable as a step change or oscillatory pressure perturbation at remote measurement points. Colombo et al. (2009) demonstrated that inverse transient analysis using pressure measurements at multiple points could localize leaks in distribution networks, and the method has been validated computationally using EPANET-based hydraulic models. The optimal pressure sensor deployment literature (Zhou et al., 2023) has studied how many sensors are needed for reliable leak detection, finding that 3 to 8 sensors per DMA achieves greater than 90% detection rates.
The gap in the existing art is a system that: (a) repurposes the existing installed base of consumer smart water meters as the pressure sensor network, eliminating the need for utility-owned sensor infrastructure; (b) handles the irregular, consumer-controlled nature of the data (meters go offline, relocate, have varying sample rates and accuracies); (c) uses a physics-informed graph neural network whose topology matches the actual pipe network to perform joint detection and localization; and (d) preserves consumer privacy by processing only differential pressure data that cannot reveal household usage patterns.
Detailed Description
1. Pressure Transient Physics in Distribution Networks
A municipal water distribution main operates at 40 to 80 psi (275 to 550 kPa) in most U.S. systems, with pressure regulated by pump stations, pressure-reducing valves (PRVs), and elevated storage tanks. When a leak initiates (pipe crack, joint failure, corrosion perforation), water begins flowing through the opening at a rate determined by the orifice area and the pressure differential. For a 1-inch-diameter circular orifice at 60 psi, the initial flow rate is approximately 30 gallons per minute (1.9 L/s), computed from the orifice equation Q = Cd · A · √(2ΔP/ρ) with discharge coefficient Cd = 0.62.
This sudden flow creates a pressure drop at the leak location and generates a transient wave. The wave amplitude at the leak point depends on the flow rate change and pipe impedance: ΔP = ρ · a · ΔV, where ρ is water density (998 kg/m³), a is wave speed, and ΔV is velocity change. For a 6-inch ductile iron main (wave speed 1,050 m/s) with flow area 0.0182 m², a 1.9 L/s leak produces ΔV = 0.104 m/s and ΔP = 109 kPa (15.8 psi). That is enormous by pressure sensing standards.
As the transient propagates through the network, it attenuates due to friction, junction losses, and radiation into branch pipes. At 500 meters from the leak, the amplitude typically drops to 20 to 40% of the origin value, and at 1,000 meters, to 5 to 15%. For a 30 GPM leak, this means 0.8 to 2.4 psi at 1 km distance, well within the detection threshold of consumer pressure sensors with 0.01 to 0.1 psi resolution. Smaller leaks (5 GPM) produce proportionally smaller transients (0.1 to 0.4 psi at 1 km), which remain detectable under favorable noise conditions but require signal averaging or matched-filter techniques to extract from background pressure fluctuations caused by normal demand variations.
The critical observation: the wave arrives at different consumer meters at different times, determined by the hydraulic path length and the wave speed of each pipe segment along the path. By measuring the arrival time at three or more meters with known positions in the network, the leak location can be triangulated through time-difference-of-arrival (TDOA) analysis, analogous to earthquake epicenter determination from seismograph networks or GPS positioning from satellite signals.
2. Consumer Smart Meter as Pressure Sensor
The system requires participating consumer smart water meters to report pressure telemetry to a centralized aggregation platform. The following specifications describe currently available consumer hardware:
- Phyn Plus (Generation 3): Piezoresistive pressure sensor, 0 to 150 psi range, 0.01 psi resolution, 240 Hz sample rate. Installed inline on the main water supply line, downstream of the shutoff valve and upstream of the first branch. WiFi connected (2.4 GHz 802.11 b/g/n). Reports continuous pressure waveforms to Phyn cloud.
- Flo by Moen (Smart Water Shutoff): Integrated pressure sensor, 0 to 175 psi range, 0.1 psi resolution, 120 Hz sample rate. Inline installation on main supply. WiFi connected. Performs daily "health tests" that pressurize the line and measure decay, plus continuous pressure monitoring.
- Flume 2: Ultrasonic flow sensor (clamp-on), no integrated pressure sensor. Not directly usable for pressure TDOA, but flow rate changes from transient events could provide supplementary detection signals.
For TDOA localization, the critical parameter is time synchronization between meters. Each meter timestamps pressure samples using its internal clock, synchronized via NTP over WiFi. Typical NTP accuracy over residential WiFi is 5 to 50 milliseconds. At a wave speed of 1,000 m/s, 50 ms timing uncertainty corresponds to 50 meters of localization uncertainty, acceptable for identifying the affected pipe segment (typical segment length 100 to 300 meters) though insufficient for pinpointing the exact break location. Improving to 1 ms accuracy (achievable with PTP-capable hardware or GPS disciplined clocks in future meter generations) would reduce localization uncertainty to 1 meter.
The system operates with whatever meters are available in a given pressure zone. Penetration rates of 5 to 15% of service connections (50 to 450 meters in a typical DMA with 3,000 connections) provide sufficient spatial sampling for DMA-level leak detection. Higher penetration rates improve localization precision sublinearly due to the diminishing returns of additional measurements once the network is adequately sampled.
3. Data Aggregation and Privacy Architecture
Consumer water pressure data is sensitive: absolute pressure values, combined with knowledge of the local distribution system, could enable inference of household usage patterns (toilet flushes produce 2 to 5 psi pressure transients at the service connection; dishwasher cycles, shower usage, and irrigation events all have distinctive pressure signatures). The system addresses this through a differential pressure reporting protocol:
- On-device baseline computation: Each smart meter maintains a rolling 15-minute exponentially weighted moving average (EWMA) of pressure as its local baseline. The EWMA time constant (τ = 120 seconds) is fast enough to track slow demand-driven pressure changes but too slow to follow transient events.
- Differential reporting: The meter reports only the difference between instantaneous pressure and the EWMA baseline: ΔP(t) = P(t) − PEWMA(t). This differential signal preserves transient events (which appear as sharp deviations from baseline) while suppressing absolute pressure information that encodes usage patterns.
- Event-triggered upload: To minimize bandwidth and cloud processing costs, the meter uploads high-rate (120 to 240 Hz) differential pressure data only when |ΔP(t)| exceeds a configurable threshold (default: 0.5 psi). During quiescent periods, only 1-minute statistical summaries (mean, variance, min, max of ΔP) are uploaded. This reduces average data volume per meter from 28.8 MB/day (continuous 240 Hz, 16-bit) to approximately 500 KB/day.
- Aggregation platform: The cloud platform receives differential pressure streams from all participating meters. No individual household water usage information is stored or derivable from the differential data. The platform maintains a network topology graph (provided by the participating utility, or inferred from GIS data and meter GPS coordinates) and performs the leak detection and localization algorithms described below.
4. Transient Event Detection and Classification
The aggregation platform processes incoming differential pressure data through a three-stage pipeline:
Stage 1: Per-meter anomaly detection. For each meter, a lightweight 1D convolutional anomaly detector (3 layers, 16 filters, kernel size 7) processes the differential pressure time series and flags candidate transient events. The detector is trained to distinguish five event classes: (a) distribution main leak or break (rapid onset, monotonic pressure drop, sustained depression), (b) fire hydrant operation (large-amplitude transient with characteristic pressure oscillation from valve bounce), (c) pump station start/stop (gradual pressure ramp, 5 to 30 seconds), (d) household demand event (small amplitude, short duration, periodic patterns), (e) water hammer from valve closure (sharp positive spike followed by decaying oscillation). Only class (a) events proceed to the network-level analysis.
Stage 2: Cross-meter correlation. When multiple meters flag class (a) events within a configurable time window (default: 10 seconds, corresponding to wave propagation time across a typical DMA diameter of 5 to 10 km at 1,000 m/s), the system groups them as a candidate leak event. The arrival time at each meter is refined by fitting a parametric model (sigmoid onset with exponential decay) to the differential pressure waveform and extracting the inflection point as the arrival time. Refinement typically improves timing precision from the raw threshold-crossing time by a factor of 3 to 5, achieving effective timing resolution of 2 to 10 ms even with 5 to 50 ms NTP synchronization uncertainty, because the waveform shape provides sub-sample timing information.
Stage 3: Consistency check. Candidate leak events are validated against physical constraints: (a) arrival times must be consistent with wave propagation through the pipe network (no meter can detect the event before the minimum propagation time from any point in the network), (b) amplitude ratios between meters must be consistent with known attenuation characteristics of the intervening pipe segments, (c) the event must persist for at least 60 seconds (distinguishing sustained leaks from transient water hammer). Events passing all three checks are escalated to the localization engine.
5. Physics-Informed Graph Neural Network for Leak Localization
The core localization algorithm uses a physics-informed graph neural network (PI-GNN) whose graph structure directly mirrors the water distribution network topology:
- Graph construction: Nodes represent pipe junctions (T-intersections, crosses, dead ends, PRVs, pump stations). Edges represent pipe segments, with edge attributes encoding pipe length, diameter, material (which determines wave speed), age, and estimated roughness. Consumer smart meters are represented as leaf nodes connected to the nearest junction node via service line edges. The graph is constructed from the utility's GIS database (available from most utilities in ESRI Shapefile or GeoJSON format via public records requests or utility partnership agreements).
- Node features: For junction nodes without meters, features are initialized to zero. For meter nodes, features encode the observed arrival time, peak amplitude, and waveform shape parameters (onset slope, decay constant) from the detected transient event.
- Architecture: The PI-GNN uses 6 message-passing layers with 64-dimensional hidden states. Each layer performs: (a) edge-conditioned message computation, where the message passed along each edge is modulated by the edge's wave propagation delay (length/wave_speed) and attenuation (exponential decay with pipe-material-specific coefficient), and (b) node update via gated recurrent unit (GRU) aggregation. After message passing, a final readout MLP predicts, for each edge in the graph, the probability that the leak is located on that pipe segment, plus a continuous position parameter (0 to 1, fractional distance along the segment).
- Physics-informed loss: The training loss combines a supervised localization loss (cross-entropy over edges, MSE over position) with a physics consistency penalty. The physics penalty enforces that the predicted leak location must be consistent with the observed arrival times at all meters, given the pipe network topology and wave speeds. Specifically, for a predicted leak at position x on edge e, the expected arrival time at each meter m is computed as the shortest hydraulic path time from x to m (sum of segment_length/wave_speed along the shortest path). The physics penalty is the mean squared difference between predicted and observed arrival times, weighted by the confidence of each meter's timing estimate. This penalty acts as a hard constraint during training, preventing the network from learning spurious localization patterns that violate wave propagation physics.
Training data generation: Because real leak events are rare (a utility with 1,000 miles of main might experience 200 to 500 breaks per year, most unobserved by the meter network), the PI-GNN is trained primarily on synthetic data generated by hydraulic simulation. EPANET (the EPA's open-source hydraulic simulation engine) models the distribution network and simulates pressure transients from leaks at random locations with random magnitudes. The simulation accounts for time-varying demand patterns, pump schedules, and tank levels to produce realistic background pressure conditions. Each simulated leak generates synthetic pressure readings at all meter locations, from which the training pipeline extracts the same features used in real-time detection. Transfer learning from simulation to real-world data is performed by fine-tuning on the small set of confirmed real leak events (verified by utility field crews) that accumulate over time.
6. Slow Leak Detection via Statistical Pressure Monitoring
Not all leaks produce detectable transients. Background leakage (small cracks, weeping joints, corroded service connections) develops gradually over weeks to months, increasing flow and decreasing pressure in the affected zone without any single discrete event. The system detects these slow leaks through longitudinal statistical analysis:
- Overnight minimum pressure tracking: For each meter, the system records the minimum pressure during the 2:00 to 4:00 AM window (when demand is lowest and pressure most closely reflects the static condition of the network). Over weeks, this value forms a time series for each meter. A downward trend (after correcting for seasonal variations in water table, temperature-dependent demand, and known utility operations) indicates increasing leakage in the vicinity.
- Spatial coherence analysis: A leak in a distribution main depresses pressure at nearby meters more than distant ones. The system applies a spatial coherence filter: a genuine leak produces correlated pressure decline across a cluster of 3+ meters in the same neighborhood, while a service line leak or meter drift affects only a single meter. The spatial coherence is quantified by computing the Pearson correlation of overnight minimum pressure trends between all meter pairs within 2 km, then identifying clusters of positively correlated declining trends using DBSCAN with a minimum cluster size of 3 meters.
- Rate estimation: The magnitude of pressure decline, combined with the known pipe diameters and network topology, enables estimation of the leak flow rate using the Hazen-Williams equation solved over the local network graph. A 1 psi decline in overnight minimum across a cluster of 10 meters in a 6-inch cast iron zone typically corresponds to 5 to 20 GPM of new leakage, depending on network topology and proximity to pressure sources.
7. Utility Integration and Alert Pipeline
The system integrates with utility operations through a tiered alert architecture:
- Tier 1 (immediate): Large transient events consistent with a main break (pressure drop exceeding 5 psi at 3 or more meters, sustained for over 60 seconds). The system generates an alert with GPS coordinates of the estimated leak location, a confidence interval polygon, the estimated leak flow rate, and a list of affected service connections that may experience low pressure or service interruption. Delivered via API webhook to the utility's SCADA system, work order management platform (e.g., Cityworks, Lucity), or dispatch center.
- Tier 2 (priority): Moderate transient events or slow leak detections with high confidence. Scheduled for investigation within 48 hours. Includes a prioritization score based on estimated water loss rate, proximity to critical facilities (hospitals, schools), and pipe criticality (trunk mains scored higher than distribution branches).
- Tier 3 (monitoring): Weak or ambiguous signals that do not yet meet the detection threshold but are trending. The system places these zones on a watch list and increases the effective sampling rate by requesting participating meters in the area to upload continuous (rather than event-triggered) differential pressure data for 7 days.
8. Figures Description
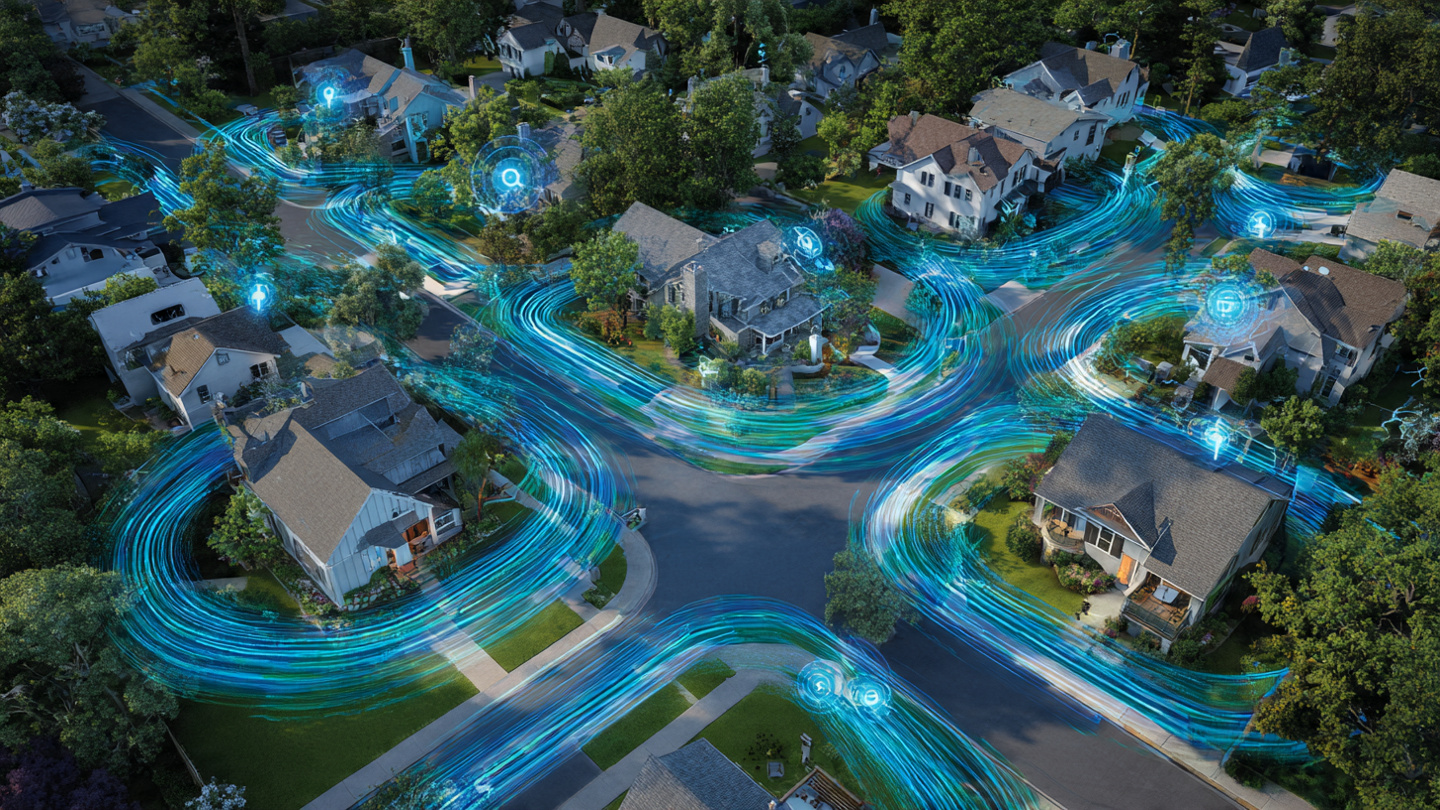
- Figure 1: System architecture showing consumer smart water meters at residential service connections reporting differential pressure telemetry via WiFi to a cloud aggregation platform, which overlays the data onto the utility's pipe network graph and outputs leak alerts to utility dispatch.
- Figure 2: Pressure transient propagation from a main break through a distribution network, showing the transient arriving at four consumer meters at different times depending on hydraulic path distance, with arrival time annotations and the resulting TDOA hyperbolic localization geometry.
- Figure 3: PI-GNN architecture diagram showing the pipe network graph with junction nodes, pipe edges with wave-speed attributes, meter leaf nodes with observed pressure features, message-passing layers with physics-informed edge modulation, and per-edge leak probability output.
- Figure 4: Longitudinal overnight minimum pressure time series for a cluster of 8 consumer meters showing correlated downward drift over 6 weeks due to developing background leakage, with a single-meter outlier caused by a service line issue (filtered out by spatial coherence analysis).
- Figure 5: Privacy architecture diagram showing the on-device EWMA baseline computation, differential pressure reporting, event-triggered high-rate upload, and the information barrier that prevents household usage inference from the aggregated municipal data.
- Figure 6: Simulation results from an EPANET model of a 500-node network showing leak localization accuracy as a function of meter penetration rate (5%, 10%, 15%, 25%), demonstrating that the PI-GNN achieves median localization error below 50 meters at 10% penetration for leaks exceeding 10 GPM.
Claims
- A system for detecting and localizing leaks in a municipal water distribution network, comprising: a plurality of consumer-grade smart water meters installed at residential or commercial service connections, each meter containing a pressure sensor that samples water pressure at a rate of at least 100 Hz; a cloud-based aggregation platform that receives timestamped pressure telemetry from the plurality of meters; and a trained graph neural network whose graph topology corresponds to the pipe network topology of the water distribution system, the graph neural network processing observed pressure transient features from multiple meters to predict the location of a leak within the pipe network.
- The system of claim 1, wherein each consumer smart water meter computes a local pressure baseline using an exponentially weighted moving average and reports only differential pressure values (deviations from baseline) to the aggregation platform, thereby preventing inference of individual household water usage patterns from the aggregated data.
- The system of claim 1, wherein the graph neural network is physics-informed, incorporating a loss function that penalizes predicted leak locations that are inconsistent with the observed pressure transient arrival times given the known pipe segment lengths and material-dependent wave propagation speeds.
- The system of claim 1, wherein leak localization is performed by time-difference-of-arrival analysis of pressure transient waves detected at three or more consumer meters, with arrival times refined by fitting a parametric waveform model to each meter's differential pressure signal to achieve sub-sample timing resolution.
- The system of claim 1, further comprising a slow leak detection module that monitors overnight minimum pressure at each meter over periods of weeks to months, identifies clusters of meters exhibiting correlated downward pressure trends using spatial coherence analysis, and estimates the leak flow rate from the magnitude of pressure decline using a hydraulic model of the local network.
- The system of claim 1, wherein the graph neural network is trained primarily on synthetic pressure transient data generated by hydraulic simulation of the distribution network using EPANET or equivalent hydraulic solver, with transfer learning fine-tuning on confirmed real leak events as they accumulate over time.
- A method for detecting leaks in a water distribution network comprising: receiving timestamped pressure measurements from a plurality of consumer smart water meters distributed across the network; detecting pressure transient events at individual meters using anomaly detection on differential pressure time series; correlating transient events across multiple meters within a time window consistent with hydraulic wave propagation; constructing a graph representation of the pipe network with nodes at junctions and edges representing pipe segments; and predicting the leak location by processing the correlated transient features through a graph neural network whose message-passing operations are modulated by pipe segment wave propagation delays and attenuation characteristics.
- The method of claim 7, wherein candidate leak events are validated against physical constraints including arrival time consistency with wave propagation through the pipe network, amplitude ratio consistency with pipe attenuation characteristics, and minimum event persistence duration, before escalation to utility dispatch.
- The method of claim 7, further comprising a tiered alert pipeline that classifies detected leaks by severity based on estimated flow rate and affected infrastructure criticality, generating immediate alerts for main breaks, priority investigation requests for moderate leaks, and monitoring watch-list entries for developing anomalies.
- The system of claim 1, wherein the aggregation platform dynamically adjusts the telemetry reporting mode of participating meters based on current detection needs, requesting continuous high-rate differential pressure data from meters in zones under active investigation while maintaining event-triggered low-bandwidth reporting for meters in quiescent zones.
Implementation Notes
The primary deployment pathway is partnership between consumer smart meter manufacturers and water utilities. Phyn (owned by Uponor), Flo by Moen (owned by Fortune Brands), and Flume collectively have an estimated 3 to 5 million devices installed in the U.S. as of 2026. Even at 5% penetration in a given utility's service area, a city of 100,000 service connections would have 5,000 participating meters, providing average inter-meter spacing of approximately 200 meters in suburban areas. This density exceeds the minimum required for DMA-level leak detection (3 to 8 sensors per DMA per the optimal sensor placement literature) by an order of magnitude.
The business model involves the aggregation platform selling leak detection alerts to water utilities as a subscription service, with consumer meter owners opting in to share anonymized differential pressure data in exchange for reduced water bills or enhanced leak protection features. The utility avoids the capital cost of deploying dedicated pressure loggers ($800 to $3,000 each) and replaces expensive periodic acoustic surveys ($500 to $2,000 per mile) with continuous, automated monitoring. A utility spending $2 million per year on leak detection and water loss could justify $500,000 to $1,000,000 annually for a service that provides continuous, network-wide coverage.
Limitations deserve candid acknowledgment. First, meter clock synchronization via NTP introduces 5 to 50 ms uncertainty, limiting localization to the pipe-segment level (100 to 300 m resolution) rather than the meter-level precision achievable with purpose-built synchronized sensors. GPS-disciplined clocks or PTP-capable network hardware could improve this in future meter generations, but current consumer devices lack such capability. Second, plastic pipes (PVC, HDPE) attenuate pressure transients much more rapidly than metallic pipes, reducing the effective detection radius per meter. In networks dominated by plastic pipe, higher meter penetration rates (15 to 25%) are needed to maintain coverage. Third, the system depends on consumer participation and sustained internet connectivity. Meters that are offline, disconnected, or uninstalled create gaps in coverage. The PI-GNN must be robust to varying and time-changing sensor configurations, which the graph architecture naturally accommodates by treating absent meters as nodes with missing features.
The strongest counterargument against this approach is that purpose-built utility sensors will always outperform repurposed consumer devices. This is true on a per-sensor basis: a SebaKMT PermaNET+ pressure logger with GPS-disciplined clock and 1 kHz sampling provides superior data quality. But the deployment economics are dramatically different. A utility deploying PermaNET+ at the density required for segment-level localization (every 200 to 500 meters, 2,000 to 5,000 loggers for a medium city) faces $2 to $15 million in hardware costs plus ongoing maintenance. The consumer meter network already exists, is maintained by homeowners, and grows organically as more consumers adopt smart water devices. The per-point data quality is lower, but the network density and continuous coverage compensate, much as GPS navigation succeeded not because any single satellite measurement is precise, but because the constellation geometry enables triangulation.
Prior Art References
- American Water Works Association. "Water Loss Control." AWWA resource page on non-revenue water, benchmarking, and audit methodology.
- American Society of Civil Engineers. "2021 Infrastructure Report Card: Drinking Water." Grade C-minus, 240,000 main breaks per year, $7.6 billion in annual water losses.
- Duan, H.F. et al. (2006). "Transient wave-blockage interaction in pressurized pipe systems." Journal of Sound and Vibration, 296, 1028-1049. Wave propagation speed and transient analysis in pressurized pipe systems.
- Colombo, A.F. et al. (2009). "A selective literature review of transient-based leak detection methods." Journal of Hydro-environment Research, 2(4), 212-227. Comprehensive review of inverse transient analysis for leak detection.
- Zhou, X. et al. (2023). "Optimal Pressure Sensor Deployment for Leak Identification in Water Distribution Networks." PMC. Minimum sensor count analysis achieving 92% detection accuracy.
- Hajgato, G. et al. (2021). "Reconstructing nodal pressures in water distribution systems with graph neural networks." arXiv:2104.13619. GNN-based pressure reconstruction from sparse sensor observations, achieving 5% relative error at 5% observation ratio.
- Ashraf, I. et al. (2023). "Graph Neural Networks for Pressure Estimation in Water Distribution Systems." arXiv:2311.10579. Physics-informed GNN combining simulation with data-driven learning, reducing pressure estimation error by 52%.
- Zhang, C. et al. (2019). "Sequence-to-point learning with neural networks for non-intrusive load monitoring." BuildSys 2019. Sequence-to-point CNN architecture relevant to per-device signal extraction from aggregate measurements.
- Phyn (Uponor). "Phyn Plus Smart Water Assistant." Consumer smart water monitor with 240 Hz pressure sampling and 0.01 psi resolution.
- Flo by Moen (Fortune Brands). "Flo Smart Water Monitor and Shutoff." Consumer smart water device with integrated pressure sensor and WiFi connectivity.
- U.S. EPA. "EPANET." Open-source hydraulic and water quality modeling software for water distribution systems.
- US20200158291A1. "Method for detecting pipe burst in water distribution systems based on pressure disturbance extraction." Utility-owned pressure sensor approach to burst detection. Does not disclose crowdsourced consumer meter data, graph neural network localization, or privacy-preserving differential pressure reporting.
- WO2020046838A1. "Systems and methods for detecting water leaks." Single-point consumer leak detection using pressure pattern analysis. Does not disclose multi-meter network-level correlation, municipal main leak localization, or physics-informed graph neural network inversion.
- World Bank. "Water Overview." Global water infrastructure loss estimates ($14 billion per year in physical losses).