System and Method for Real-Time Mosquito Population Density Estimation and Species-Level Classification Using Distributed Acoustic Wingbeat Frequency Analysis from Consumer Internet-of-Things Device Microphone Networks with Edge-Deployed Spectral Neural Network Classifiers
Abstract
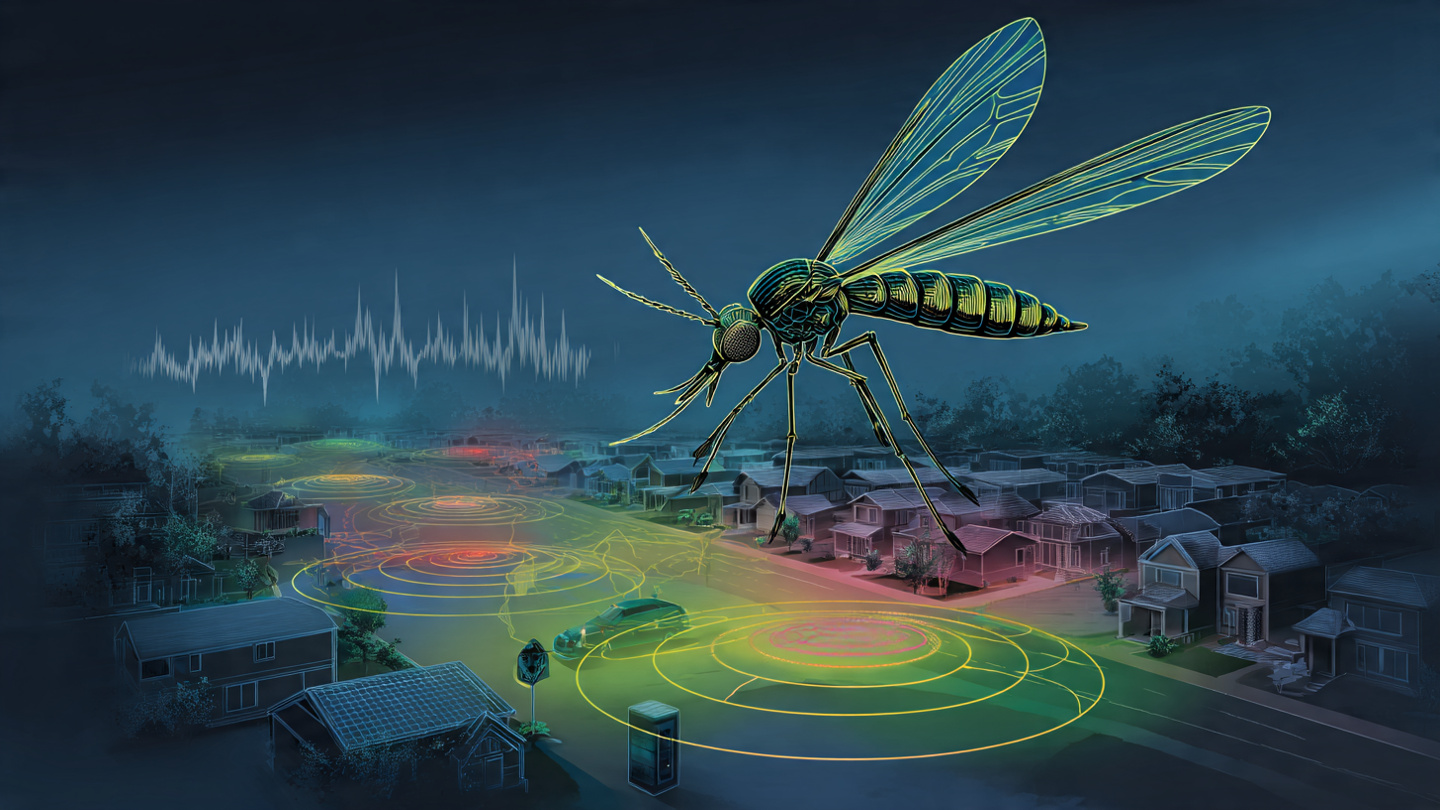
Disclosed is a system and method for estimating mosquito population density and classifying mosquito species in real time by repurposing the microphone arrays embedded in consumer Internet-of-Things (IoT) devices already deployed at residential and commercial properties. Smart speakers (Amazon Echo, Google Nest, Apple HomePod), outdoor security cameras, video doorbells (Ring, Nest Hello), smartphones, and tablet devices collectively represent an installed base exceeding 15 billion microphone-equipped endpoints worldwide. Each mosquito species produces a characteristic wingbeat frequency: Aedes aegypti females at 460–530 Hz, Aedes albopictus at 463–541 Hz, Culex quinquefasciatus at 366–437 Hz, and Anopheles gambiae at 300–380 Hz (Brahma et al., Scientific Reports 2025). The system deploys a lightweight spectral neural network classifier (18,000 parameters, 72 KB quantized) to the always-on audio processing pipeline of participating IoT devices, where it continuously monitors ambient audio for mosquito wingbeat signatures in the 150–900 Hz band. Detections are tagged with GPS coordinates, ambient temperature, humidity (from co-located weather sensors or interpolated from nearby stations), time of day, and a confidence score, then aggregated by a cloud-based spatiotemporal fusion engine that applies a Gaussian process regression model over a city-scale spatial grid to produce hourly population density estimates and species distribution maps. The system reports to public health vector surveillance dashboards, enabling proactive mosquito abatement responses and early warning of disease vector population surges without deploying any dedicated entomological monitoring hardware.
Field of the Invention
This invention relates to computational entomology and distributed environmental sensing, specifically to the use of consumer IoT device microphone networks for automated mosquito surveillance through acoustic wingbeat frequency analysis and edge-deployed machine learning classification.
Background
Mosquito-borne diseases kill more humans than any other animal vector. The World Health Organization reports that malaria alone caused 608,000 deaths in 2022, with dengue infecting an estimated 100–400 million people annually. In the United States, West Nile virus has caused over 2,800 deaths since 1999 (CDC ArboNET), while the 2015–2016 Zika outbreak caused thousands of cases of microcephaly in newborns across the Americas. Effective mosquito control depends critically on surveillance: knowing where mosquitoes are, what species are present, and how populations change over time.
Current mosquito surveillance methods suffer from fundamental scalability limitations:
- CDC light traps and gravid traps: The gold standard for entomological surveillance. Battery-powered ultraviolet attractant traps collect mosquitoes overnight, which are then manually identified by trained entomologists under a microscope. Cost: $200–$500 per trap plus $50–$150 per collection event for labor. A typical U.S. county mosquito abatement district operates 20–50 traps covering 500–2,000 square miles, yielding one sample per trap per week. Spatial resolution is measured in miles, temporal resolution in days to weeks.
- BG-Sentinel traps with CO2 lures: More selective for Aedes species (Kröckel et al., Journal of Medical Entomology 2006). Cost: $300–$400 per unit plus consumable CO2 cartridges ($20/week). Still requires manual collection and identification. Some districts use BG-Counter automated counters ($2,000+) that count but do not identify species.
- Ovitraps: Black cups with water and substrate that attract egg-laying Aedes females. Cost: $5 per trap, but labor-intensive to deploy, collect, and count eggs under magnification. Detects presence/absence but provides poor density estimates. No species classification without rearing or molecular analysis.
- Dedicated acoustic monitoring: Purpose-built acoustic sensors using infrared interruption or microphones in controlled enclosures have demonstrated species classification accuracy of 89–98% in laboratory settings (Vasconcelos et al., Scientific Reports 2022; Gupta et al., arXiv 2022). The HumBug project (University of Oxford) deployed smartphone-based mosquito detection but required dedicated app usage and active participation, limiting sustained adoption. The Abuzz project (Stanford) collected 20,000+ recordings via citizen science, demonstrating feasibility but not continuous autonomous surveillance.
- Infrared wingbeat sensors: Potamitis et al., Scientific Reports 2020 demonstrated infrared light-interruption sensors that classify mosquitoes by their optical wingbeat signature with >90% accuracy. These require custom hardware (LED emitter + phototransistor arrays), cost $50–$200 per unit, and must be placed within the mosquito flight path (1–3 meters effective range). Scaling to city coverage would require tens of thousands of purpose-built sensors.
Parallel advances in mosquito acoustic classification using deep learning have produced models of sufficient accuracy for field deployment:
- WbNet (Vasconcelos et al., Scientific Reports 2022): ResNet-attention model achieving 89.9% species accuracy on the WINGBEATS dataset and 98.9% on the ABUZZ dataset across six species, using mel-spectrogram input.
- MosquitoSong+ (2025): Noise-robust deep learning model achieving >80% species accuracy and 93.3% sex classification from wingbeat sounds in noisy conditions.
- DR-BioL (2025): Domain-robust bioacoustic learning framework using contrastive learning and distribution alignment for cross-domain mosquito species classification.
Meanwhile, the installed base of always-on, microphone-equipped consumer IoT devices has reached extraordinary density. Amazon reported over 500 million Alexa-enabled devices sold as of 2024. Google Nest devices exceed 100 million units. Ring video doorbells are installed at over 20 million U.S. homes. Security cameras (Arlo, Wyze, Eufy, Reolink) add tens of millions more outdoor microphones. In aggregate, a typical suburban neighborhood of 200 homes contains 400–800 IoT devices with microphones, many of them outdoors or near open windows, creating a dense acoustic sensor grid with 10–30 meter effective spacing that no purpose-built surveillance network could economically replicate.
The gap in the art is a system that: (a) repurposes these existing consumer microphone networks for entomological surveillance without dedicated hardware, (b) deploys sufficiently lightweight classifiers to run within the existing audio processing pipelines of heterogeneous IoT devices, (c) fuses detections across thousands of spatially distributed devices to produce calibrated population density estimates, and (d) integrates environmental covariates (temperature, humidity, time of day) to distinguish species whose wingbeat frequencies overlap under varying conditions.
Detailed Description
1. Mosquito Wingbeat Acoustic Signatures
Mosquito flight produces tonal acoustic signals generated by wingbeat oscillation at species-specific fundamental frequencies, with harmonic overtones extending to 3–5 kHz. The fundamental frequency varies by species, sex, age, physiological state, and ambient temperature. Comprehensive characterization from the literature establishes the following reference ranges for the medically significant vector species targeted by this system (Brahma et al., 2025; Arthur et al., JASA 2014; Pennetier et al., Current Biology 2010):
- Aedes aegypti (yellow fever, dengue, Zika, chikungunya vector): Female fundamental 460–530 Hz; male 650–750 Hz. Temperature coefficient: +2.4 Hz/°C for females (Staunton et al., PLoS ONE 2019).
- Aedes albopictus (Asian tiger mosquito, dengue, chikungunya): Female fundamental 463–541 Hz; male 650–704 Hz. Overlaps significantly with Ae. aegypti in fundamental frequency but distinguishable through harmonic structure and spectral centroid differences.
- Culex quinquefasciatus (West Nile, lymphatic filariasis): Female fundamental 366–437 Hz; male 500–534 Hz. Lower frequency band separates cleanly from Aedes species.
- Anopheles gambiae (malaria primary vector): Female fundamental 300–380 Hz; male 550–650 Hz. Lowest fundamental among target species. Harmonic convergence at ~1,500 Hz during mating provides a secondary species-diagnostic feature.
- Culex pipiens (West Nile, temperate zones): Female fundamental 350–425 Hz. Close to Cx. quinquefasciatus (sibling species complex) but distinguishable through harmonic amplitude ratios at H2 and H3.
The acoustic detection range depends on the source level of the mosquito (approximately 45–55 dB SPL at 10 cm for females in free flight; Arthur et al., 2014) and the sensitivity of the consumer device microphone. MEMS microphones in modern IoT devices (Knowles SPH0645, InvenSense ICS-43434) have noise floors of 29–33 dBA equivalent input noise, yielding a theoretical detection range of 0.5–3.0 meters depending on ambient noise conditions. Outdoor microphones (security cameras, doorbells) in suburban environments with typical 35–50 dBA ambient noise achieve effective detection ranges of 0.3–1.5 meters. While this per-device range is modest, the spatial density of IoT devices compensates: at 400–800 devices per 200-home neighborhood, the cumulative probability that a mosquito flies within detection range of at least one device during a 10-minute interval is 0.6–0.9 for neighborhoods with moderate device density (>2 outdoor microphones per 100 square meters of outdoor space).
2. Edge-Deployed Wingbeat Classifier Architecture
The classifier must operate within the severe computational constraints of consumer IoT audio pipelines, which typically allocate less than 5% of CPU cycles and less than 256 KB of RAM to third-party audio processing tasks. The system uses a two-stage detection-then-classification architecture optimized for heterogeneous deployment:
Stage 1: Tonal event detector (always-on). A lightweight infinite impulse response (IIR) bandpass filter bank (8 sub-bands spanning 150–900 Hz, 4th-order Butterworth per band) continuously monitors the microphone input. When the signal-to-noise ratio in any sub-band exceeds 6 dB above the exponentially averaged noise floor (time constant τ = 2 seconds) for a sustained duration of 50–500 ms (consistent with a mosquito transit event through the microphone detection volume), the system triggers Stage 2. The IIR filter bank consumes approximately 0.02 MFLOPS at 16 kHz sampling rate, well within the background processing budget of any ARM Cortex-M4 or higher processor found in modern IoT devices. The always-on detector rejects broadband transients (speech, traffic, wind) through the sustained-tone requirement and rejects steady-state power line hum (50/60 Hz and harmonics) through a dedicated notch filter array at 50, 60, 100, 120, 150, 180, 200, 240, 300, 360 Hz (±2 Hz bandwidth each).
Stage 2: Spectral classification neural network (triggered). Upon trigger, the system extracts a 250 ms audio window centered on the detection event and computes a 64-bin log-mel spectrogram (frequency range 100–2,000 Hz, hop length 5 ms, window length 25 ms, yielding a 64×50 time-frequency representation). This spectrogram is fed to a compact convolutional neural network with the following architecture:
- Input: 64×50 log-mel spectrogram (single channel)
- Conv2D block 1: 16 filters, 3×3 kernel, BatchNorm, ReLU, 2×2 max pool → 32×25×16
- Conv2D block 2: 32 filters, 3×3 kernel, BatchNorm, ReLU, 2×2 max pool → 16×12×32
- Conv2D block 3: 32 filters, 3×3 kernel, BatchNorm, ReLU, global average pool → 32
- Dense: 32 → number of target species + "not mosquito" class (typically 6–8 outputs)
- Softmax output with calibrated confidence threshold (default: 0.7 for positive detection)
Total parameter count: approximately 18,000 (72 KB at INT8 quantization, 36 KB with 4-bit post-training quantization). Inference time: <2 ms on a Cortex-M4 at 80 MHz. The model is trained on a composite dataset combining the Stanford Abuzz corpus (~20,000 recordings across 20 species; Mukundarajan et al., eLife 2017), the WINGBEATS dataset (279,000 recordings across 6 species; Fernandes et al., PLoS ONE 2021), and synthetic augmentations applying background noise profiles recorded from actual IoT device microphones in residential settings at varying signal-to-noise ratios (0–20 dB). Data augmentation includes time stretching (0.9–1.1×), pitch shifting (±5%), additive environmental noise (suburban, urban, rural profiles), and simulated multipath reverberation (RT60 = 0.1–0.8 s for indoor devices).
3. Environmental Covariate Compensation
Mosquito wingbeat frequency varies with ambient temperature (approximately +2–3 Hz/°C across species; Staunton et al., PLoS ONE 2019), which creates classification ambiguity between species whose frequency ranges overlap at certain temperatures. The system compensates for temperature-dependent frequency shifts through two mechanisms:
Temperature-aware classification. Ambient temperature is supplied to the classifier as an auxiliary input feature concatenated to the global average pooling output before the dense classification layer. Temperature is obtained from: (a) co-located IoT sensors (smart thermostats, weather stations, outdoor temperature sensors) via local network discovery, (b) the device's own temperature sensor if available (common in outdoor cameras), or (c) interpolated from the nearest public weather station via the National Weather Service API. The classifier is trained with temperature as an explicit input dimension, learning species-specific frequency-temperature response curves rather than fixed frequency thresholds.
Harmonic ratio features. While the fundamental frequency shifts with temperature, the ratios between harmonic amplitudes (H2/H1, H3/H1, H4/H1) remain more stable across temperature because they depend on wing morphology and stroke kinematics rather than wingbeat rate. The spectrogram input naturally captures these harmonic features, and the convolutional architecture learns to weight harmonic ratio patterns alongside fundamental frequency for temperature-robust classification. Cross-species pairs that overlap in fundamental frequency (Ae. aegypti vs. Ae. albopictus, Cx. pipiens vs. Cx. quinquefasciatus) show >15% divergence in H3/H1 amplitude ratios (Vasconcelos et al., 2022), which the classifier exploits for differentiation.
4. Spatiotemporal Fusion Engine
Individual device detections are inherently noisy: a single detection event provides a binary presence signal with species probability, limited to the 0.3–1.5 meter detection radius of one microphone. The system's value proposition emerges from aggregating thousands of detections across a dense spatial network into calibrated population density estimates. The fusion engine operates on a hierarchical spatial grid:
Grid definition. The target area (city, county, or metropolitan region) is discretized into a hexagonal grid with 100-meter cell radius (approximately 3 hectares per cell), chosen to match the typical flight range of Aedes aegypti (50–200 meters from breeding site; Harrington et al., American Journal of Tropical Medicine and Hygiene 2005). Each IoT device is assigned to its containing hex cell based on GPS coordinates (obtained from device registration, Wi-Fi-based geolocation, or IP geolocation with manual correction).
Detection rate normalization. Raw detection counts from each device are normalized by: (a) microphone sensitivity calibration factor (estimated from the device model's published specifications and verified through the noise floor measured during quiet periods), (b) outdoor exposure factor (1.0 for outdoor cameras and doorbells, 0.1–0.5 for indoor devices near open windows, estimated from the device type and seasonal time of day), (c) microphone duty cycle (some devices enter low-power states with reduced microphone sampling; the detection rate is scaled by 1/duty_cycle), and (d) ambient noise level (higher noise floors reduce detection range; the system applies an inverse-square correction based on the measured SNR relative to the calibration condition).
Gaussian process density estimation. The normalized detection rates from all devices within each hex cell are aggregated into hourly cell-level detection rate estimates. A Gaussian process (GP) regression model with a Matérn 5/2 spatial kernel (length scale 200–500 meters, learned from data) and a periodic temporal kernel (24-hour period, capturing the crepuscular activity peaks of most vector species) interpolates detection rates across the full spatial grid, including cells with no IoT devices. The GP posterior mean provides the population density estimate (mosquitoes per hectare per hour), and the posterior variance provides a calibrated uncertainty estimate that is larger in cells with few devices and smaller in densely instrumented areas. The GP hyperparameters are learned via marginal likelihood optimization on each city's historical detection data.
Calibration against ground truth. The absolute calibration between detection rate (detections per device per hour) and population density (mosquitoes per hectare) is established through a sparse set of co-located CDC light trap collections at 10–50 reference sites per metropolitan area. These calibration traps are operated by the local mosquito abatement district as part of their existing surveillance program. The system fits a species-specific calibration transfer function (log-linear model with temperature and humidity covariates) relating the GP-estimated detection rate to the trap-measured population density. This calibration is updated monthly as new trap data becomes available.
5. Privacy-Preserving Architecture
The system processes audio exclusively on-device. No raw audio, spectrograms, or identifiable acoustic content leaves the IoT device. The only data transmitted to the fusion engine is a structured detection report containing: timestamp (rounded to 1-minute resolution), device GPS coordinates (obfuscated to 50-meter precision by adding uniform random noise), species classification (categorical label), confidence score (scalar, 0–1), ambient temperature (°C), ambient noise level (dBA), and a pseudonymous device identifier (rotated monthly, unlinkable to the device's primary account). The detection report is approximately 64 bytes per event.
The wingbeat classifier operates in the 150–900 Hz frequency band. Human speech fundamental frequencies (85–255 Hz for adults) partially overlap the lower end of this band, but the classifier's tonal-event detector requires sustained narrow-band energy for 50–500 ms, which rejects speech (which exhibits rapid formant transitions and broadband spectral energy). The classifier is additionally trained with a hard negative mining curriculum that includes thousands of speech segments, music clips, and household sounds in the "not mosquito" class, achieving >99.9% rejection rate for non-mosquito audio events. Nonetheless, the system never transmits or stores the raw audio that triggered a detection; the mel-spectrogram computation and classification inference occur in a transient buffer that is overwritten at each processing frame.
For federated model updates, the system applies federated averaging (McMahan et al., AISTATS 2017) to aggregate model gradient updates from participating devices without centralizing training data. Differential privacy guarantees (ε = 4.0, δ = 10⁻⁶ per communication round) are enforced through gradient clipping and Gaussian noise addition before gradient upload.
6. Temporal Activity Pattern Analysis
Beyond instantaneous density estimation, the system captures temporal activity patterns that provide additional entomological intelligence. Most vector mosquito species exhibit bimodal activity peaks at dawn (05:00–08:00 local) and dusk (17:00–21:00 local), with species-specific timing: Ae. aegypti peaks in the two hours after sunrise, while Cx. quinquefasciatus is most active in the first three hours after sunset (Harrington et al., 2005). The system's continuous monitoring captures the full diel activity curve for each hex cell, enabling:
- Species composition inference: Even when individual detection events have ambiguous species classification (confidence 0.5–0.7), the temporal activity pattern of detections within a cell provides a strong prior for species composition. A cell with detection peaks at 06:00 and 18:00 is dominated by Aedes species; a cell with a single peak at 21:00 is dominated by Culex. The fusion engine incorporates this temporal prior as a hierarchical Bayesian prior on the species mixture proportions.
- Oviposition site proximity: Detection density decays exponentially with distance from breeding sites. Cells with consistently high detection rates at dawn (when females are host-seeking after overnight oviposition) are likely within 50–100 meters of active breeding habitat. The system flags these cells as priority targets for larval source reduction.
- Population trend detection: Week-over-week changes in detection rates provide leading indicators of population growth (e.g., following rainfall events that create new breeding habitat) 7–14 days before the population increase would be detected by weekly CDC trap collections. The system generates automated trend alerts when the 7-day rolling detection rate in any hex cell exceeds 2× the 30-day moving average.
7. Integration with Vector Surveillance Systems
The system exposes a standards-compliant data interface to existing public health surveillance infrastructure:
- CDC ArboNET integration: Species-level detection data is formatted as ArboNET-compatible surveillance records, enabling direct ingestion by state and county health departments that already use the ArboNET reporting system for mosquito-borne disease surveillance.
- ESRI ArcGIS integration: Density maps are exported as GeoJSON and ArcGIS feature layers for overlay with existing mosquito abatement district GIS systems, enabling spatial cross-referencing with known breeding sites, treatment zones, and complaint hotspots.
- Automated abatement triggering: When the estimated population density in a hex cell exceeds a configurable species-specific threshold (e.g., >50 Ae. aegypti per hectare, corresponding to elevated dengue transmission risk), the system generates a work order for the local abatement district's dispatch system, specifying the target cell, estimated density, species composition, and recommended intervention (adulticiding, larviciding, or source reduction based on the temporal activity pattern analysis).
- Citizen notification: Participating device owners receive optional push notifications when mosquito density in their neighborhood exceeds a personal protection threshold, along with species-specific risk information and recommended personal protective measures based on the detected vector species.
8. Device Heterogeneity and Microphone Calibration
Consumer IoT devices vary substantially in microphone characteristics: sensitivity (-38 to -44 dBV/Pa for MEMS microphones across manufacturers), frequency response flatness (±3 dB from 100 Hz to 10 kHz for premium devices, ±6 dB for budget devices), self-noise (29–42 dBA equivalent input noise), and automatic gain control (AGC) behavior (some devices apply AGC that compresses dynamic range). The system addresses this heterogeneity through three mechanisms:
- Device-class calibration profiles: A calibration database maps each IoT device model (identified by User-Agent string or device API model field) to a microphone characterization profile containing measured frequency response, noise floor, and AGC behavior. Profiles are populated through controlled measurements of representative devices from each model family. The spectrogram computation applies the inverse frequency response as an equalization filter before mel-binning.
- Self-calibration via ambient noise floor: Each device continuously estimates its own noise floor across the 150–900 Hz band. Deviations from the device-class expected noise floor (due to microphone aging, physical obstruction, or unusual ambient conditions) are used to adjust the detection sensitivity threshold and the detection range estimate fed to the fusion engine.
- Cross-device consistency scoring: When multiple devices in the same hex cell detect (or fail to detect) mosquito activity simultaneously, the fusion engine computes a consistency score. Devices whose detection patterns persistently diverge from their spatial neighbors (e.g., a device that never detects mosquitoes while surrounding devices detect high activity) are flagged for reduced fusion weight, potentially indicating a hardware fault, indoor placement, or miscalibrated microphone.
9. Figures Description
- Figure 1: System architecture overview. Left: consumer IoT devices (smart speaker, security camera, video doorbell, smartphone) with microphone pickup patterns shown as concentric arcs. Center: on-device processing pipeline (bandpass filter bank → tonal event detector → mel-spectrogram extraction → CNN classifier → structured detection report). Right: cloud fusion engine receiving detection reports from thousands of devices, applying Gaussian process regression over hexagonal spatial grid, outputting population density maps and species distribution overlays.
- Figure 2: Wingbeat frequency reference chart for six medically significant mosquito species, showing female and male fundamental frequency ranges, temperature-dependent variation bands, and harmonic structures up to H4. Overlapping frequency ranges between Ae. aegypti and Ae. albopictus highlighted, with H3/H1 ratio divergence shown as the discriminating feature.
- Figure 3: Edge classifier architecture diagram. 64×50 log-mel spectrogram input feeds three Conv2D blocks with BatchNorm and max pooling, followed by global average pooling and a temperature-concatenated dense classification head. Parameter counts and quantized memory footprint annotated at each layer. Total: 18K params, 72 KB INT8.
- Figure 4: Spatiotemporal fusion output example. Hexagonal grid over a metropolitan area, colored by estimated Aedes aegypti density (mosquitoes/hectare/hour) at dusk on a summer evening. GP uncertainty contours shown as opacity gradients (high confidence = opaque, low confidence = transparent). Co-located CDC trap sites marked with ground-truth density readings for calibration reference.
- Figure 5: Temporal activity profiles for three species detected simultaneously in a mixed-species neighborhood. 24-hour detection rate curves show characteristic bimodal Aedes peaks at dawn/dusk and unimodal Culex peak at night. Bayesian species decomposition overlaid, demonstrating how temporal patterns resolve classification ambiguity in the overlap frequency band.
- Figure 6: Privacy architecture. Raw audio never leaves the device. Only 64-byte structured detection reports (timestamp, obfuscated coordinates, species label, confidence, environmental covariates) are transmitted. Federated learning path shows local gradient computation, differential privacy noise injection, and aggregation server.
Claims
- A system for estimating mosquito population density and classifying mosquito species, comprising: a plurality of consumer Internet-of-Things devices, each equipped with at least one microphone, distributed across a geographic area and connected to a communication network; an edge-deployed acoustic classifier executing on each participating device, comprising a tonal event detector that monitors ambient audio for sustained narrow-band energy in the 150–900 Hz frequency range consistent with mosquito wingbeat acoustic signatures, and a spectral neural network classifier that processes a time-frequency representation of detected tonal events to output a species classification and confidence score; and a cloud-based spatiotemporal fusion engine that receives structured detection reports from the plurality of devices and applies a spatial regression model over a geographic grid to produce calibrated population density estimates and species distribution maps, without requiring purpose-built entomological monitoring hardware.
- The system of claim 1, wherein the tonal event detector comprises an IIR bandpass filter bank spanning the 150–900 Hz frequency range, divided into a plurality of sub-bands, with a sustained-tone detection criterion requiring the signal-to-noise ratio in at least one sub-band to exceed a threshold above the exponentially averaged noise floor for a duration of 50–500 milliseconds, and a notch filter array rejecting power line harmonics at 50, 60, 100, 120, 150, 180, 200, 240, 300, and 360 Hz.
- The system of claim 1, wherein the spectral neural network classifier receives a log-mel spectrogram computed from a time window of 200–500 milliseconds centered on the detected tonal event, with frequency range spanning at least the fundamental and first three harmonics of the target mosquito species, and outputs a probability distribution over a set of target mosquito species plus a "not mosquito" rejection class.
- The system of claim 1, wherein the spectral neural network classifier receives ambient temperature as an auxiliary input feature to compensate for temperature-dependent wingbeat frequency shifts, enabling the classifier to learn species-specific frequency-temperature response curves rather than fixed frequency thresholds.
- The system of claim 1, wherein the spatiotemporal fusion engine applies Gaussian process regression with a spatial kernel and a periodic temporal kernel over a hexagonal geographic grid, producing posterior mean population density estimates and posterior variance uncertainty estimates for each grid cell, with interpolation across cells containing no participating IoT devices.
- The system of claim 1, further comprising a detection rate normalization module that adjusts raw detection counts from each device by: microphone sensitivity calibration factor derived from the device model's published specifications, outdoor exposure factor based on device type and placement classification, microphone duty cycle scaling factor, and ambient noise level correction based on measured signal-to-noise ratio relative to a calibration reference condition.
- The system of claim 1, further comprising a temporal activity pattern analysis module that computes diel activity curves from aggregated detections within each grid cell, and applies a hierarchical Bayesian species mixture model that uses species-specific temporal activity priors to improve species composition estimates beyond what individual detection events provide.
- The system of claim 1, wherein all audio processing occurs on-device, and the only data transmitted to the fusion engine comprises structured detection reports containing: timestamp at reduced temporal resolution, device coordinates obfuscated by additive random spatial noise, species classification label, confidence score, ambient temperature, ambient noise level, and a pseudonymous device identifier that is periodically rotated and unlinkable to the device's primary user account.
- The system of claim 1, further comprising a cross-device consistency scoring module within the fusion engine that compares detection patterns across spatially proximate devices and reduces the fusion weight of devices whose detection patterns persistently diverge from their spatial neighbors, enabling automatic identification of miscalibrated, obstructed, or improperly classified device placements.
- The system of claim 1, further comprising a population trend alerting module that computes rolling detection rate statistics for each grid cell and generates automated alerts when the short-term detection rate exceeds a configurable multiple of the long-term moving average, providing leading indicators of mosquito population surges.
- A method for distributed mosquito surveillance using consumer IoT device microphones, comprising: continuously monitoring ambient audio on a plurality of consumer IoT devices using a low-power tonal event detector operating in the 150–900 Hz frequency band; upon detection of a sustained tonal event consistent with mosquito wingbeat acoustics, extracting a time-frequency representation and classifying the event by mosquito species using an edge-deployed neural network classifier with fewer than 100,000 parameters; transmitting structured detection reports containing species classification, confidence score, obfuscated device location, and environmental covariates to a cloud-based fusion engine; aggregating detection reports across the plurality of devices using Gaussian process regression over a spatial grid to produce hourly population density estimates and species distribution maps calibrated against sparse ground-truth trap collections; and exposing the density estimates and species maps to public health vector surveillance systems for integration with existing mosquito abatement operational workflows.
- The method of claim 11, wherein the neural network classifier is updated through federated learning, with local gradient updates computed on each participating device using on-device detection events, differential privacy noise added to gradient updates before transmission, and gradient aggregation performed at a central server, such that no raw audio data or individual detection event logs are centralized during model training.
Implementation Notes
The edge classifier can be deployed to any IoT device running a general-purpose operating system (Linux, Android, FreeRTOS with DSP extensions) with at least one microphone channel sampled at ≥8 kHz and a processor capable of 18,000 multiply-accumulate operations per inference cycle (any ARM Cortex-M4 or higher). For smart speakers (Echo, Nest, HomePod), the classifier integrates as a third-party audio processing skill or system extension. For security cameras and doorbells, it runs as a firmware module within the existing audio analytics pipeline (alongside existing sound detection features such as glass break, smoke alarm, and barking dog detectors offered by Ring, Arlo, and Nest). For smartphones, it operates as a background service similar to existing always-on keyword detection.
The system's coverage density depends on voluntary device enrollment. At 1% participation rate (achievable through opt-in prompts within existing device companion apps), a metropolitan area of 1 million residents with an estimated 4 million IoT devices yields 40,000 participating sensors. At typical suburban density (1,000 homes/km²), this provides approximately 20 sensors per hexagonal grid cell (100-meter radius), sufficient for reliable GP interpolation. Higher participation rates improve spatial resolution and reduce GP posterior uncertainty.
The calibration transfer function between detection rate and absolute population density requires a minimum of 10 co-located CDC trap collections per metropolitan area per month. This represents minimal incremental burden for mosquito abatement districts that already operate trap networks, requiring only that trap GPS coordinates be shared with the system for co-location analysis. The calibration transfer function accounts for seasonal variation in detection efficiency (mosquito body size and flight acoustics change with temperature and generation) through monthly recalibration.
The system provides the most value in the 25°C–35°C temperature range where mosquito activity peaks and acoustic detection is most reliable. Below 15°C, mosquito activity drops to near zero, and the system enters a low-power seasonal hibernation mode. Above 40°C, wingbeat frequencies shift toward the upper end of species ranges, potentially exceeding the Nyquist frequency for devices sampling at only 8 kHz; such devices are excluded from the active sensor pool when ambient temperature exceeds 38°C.
Prior Art References
- Brahma et al., Scientific Reports 2025 — Acoustic behaviour and flight tone frequency changes in adult Aedes albopictus and Culex quinquefasciatus mosquitoes
- Vasconcelos et al., Scientific Reports 2022 — ResNet attention model (WbNet) for classifying mosquitoes from wing-beating sounds
- Arthur et al., Journal of the Acoustical Society of America 2014 — Mosquito flight tones: frequency, harmonicity, spherical spreading, and phase relationships
- Pennetier et al., Current Biology 2010 — Singing on the wing as a mechanism for species recognition in Anopheles gambiae
- Staunton et al., PLoS ONE 2019 — Temperature-dependent wingbeat frequency variation in mosquitoes
- Mukundarajan et al., eLife 2017 — Using mobile phones as acoustic sensors for high-throughput mosquito surveillance (Stanford Abuzz project)
- Fernandes et al., PLoS ONE 2021 — WINGBEATS dataset: 279,000 wingbeat recordings across 6 species
- Gupta et al., arXiv 2022 — Deep learning-based acoustic mosquito detection in noisy conditions using trainable kernels
- MosquitoSong+ 2025 — Noise-robust deep learning model for mosquito classification from wingbeat sounds
- DR-BioL 2025 — Domain-robust bioacoustic learning for mosquito species classification
- Potamitis et al., Scientific Reports 2020 — Infrared light-interruption sensors for mosquito wingbeat classification
- Kröckel et al., Journal of Medical Entomology 2006 — BG-Sentinel traps for Aedes aegypti surveillance
- Harrington et al., American Journal of Tropical Medicine and Hygiene 2005 — Dispersal of the dengue vector Aedes aegypti in an urban area
- WHO Malaria Fact Sheet 2023 — Global malaria mortality and morbidity statistics
- CDC ArboNET West Nile Virus Data — U.S. West Nile virus surveillance data and case counts
- McMahan et al., AISTATS 2017 — Federated averaging for privacy-preserving distributed model training
- HumBug Project, University of Oxford — Mosquito detection using smartphones for vector surveillance