System and Method for Non-Invasive Bridge Structural Health Assessment Using Traffic-Induced Deflection Analysis from Consumer Dashcam Video with Edge-Deployed Physics-Informed Load Rating Estimation
Abstract
Disclosed is a system and method for continuously assessing the structural health and estimating the load-carrying capacity of highway and railway bridges by analyzing traffic-induced deflection patterns captured in consumer dashcam video. Modern dashcams record at 1080p to 4K resolution at 30–60 fps, providing sufficient spatial and temporal resolution to detect the millimeter-scale vertical deflections that bridges undergo when vehicles cross them. The system employs a three-stage pipeline executed on a vehicle-mounted edge compute module: (1) bridge detection and scene registration using a convolutional neural network that identifies bridge structural elements (deck edges, expansion joints, pier caps, guardrail stanchions, lane markings) and establishes a stable reference frame relative to fixed abutment features; (2) sub-pixel optical flow measurement using phase-based motion amplification on tracked feature points along the bridge deck, resolving vertical displacement to approximately 0.05–0.2 mm precision at typical dashcam mounting distances of 1.5–3 meters above the deck surface; (3) physics-informed load rating estimation using a reduced-order finite element beam model that ingests the measured deflection influence line, the estimated vehicle weight (inferred from make/model classification via computer vision), vehicle speed (from GPS), and lane position (from lane marking detection) to compute an effective flexural rigidity EI and compare it against the design load rating from the National Bridge Inventory. When aggregated across thousands of crossings by fleet vehicles equipped with the system, the approach yields statistically robust structural condition assessments with confidence intervals that tighten over time, enabling transportation agencies to prioritize inspection resources on bridges showing degradation trends without deploying any sensors on the bridge structure itself.
Field of the Invention
This invention relates to structural health monitoring of transportation infrastructure, specifically to non-contact measurement of bridge structural response under traffic loading using consumer-grade video from vehicle-mounted cameras and physics-informed machine learning inference at the edge.
Background
The United States maintains approximately 617,000 highway bridges, of which 46,154 (7.5%) are classified as structurally deficient according to the American Society of Civil Engineers' 2025 Infrastructure Report Card. The Federal Highway Administration's National Bridge Inventory estimates a maintenance backlog of $125 billion, growing by approximately $9 billion per year as bridges built during the Interstate Highway System expansion of the 1960s and 1970s approach and exceed their 50-year design life. Forty-two percent of all US bridges are now over 50 years old.
Current bridge inspection practice relies on biennial visual inspections mandated by the National Bridge Inspection Standards (23 U.S.C. § 144), in which trained inspectors physically examine each bridge element and assign condition ratings on a 0–9 scale. This system has well-documented limitations:
- Subjectivity: Phares et al., Journal of Bridge Engineering 2004, conducted the largest study of bridge inspection reliability, finding that condition ratings assigned by different inspectors to the same bridge element varied by ±2 rating points in 56% of cases and that inspectors missed 30% of structural deficiencies visible to a review team.
- Infrequency: Two-year inspection cycles cannot detect rapid deterioration between inspections. The NTSB investigation of the I-35W Mississippi River bridge collapse (2007, 13 fatalities) found that the bridge's gusset plates had been undersized since original construction in 1967, a deficiency that survived 40 years of biennial inspections.
- Cost: A routine biennial inspection costs $5,000–50,000 per bridge depending on size and access difficulty. An in-depth inspection with load testing costs $100,000–500,000. At current funding levels, many state DOTs defer in-depth inspections to bridges already flagged by routine visual inspection, creating a circular dependency.
- Access constraints: Under-deck inspection of over-water bridges requires snooper trucks, rigging, or boats. Inspectors cannot access the interior of box girders, post-tensioning ducts, or filled steel members without destructive investigation.
Structural health monitoring (SHM) systems using dedicated sensors have been deployed on high-value bridges, but remain impractical for network-scale adoption:
- Accelerometer-based systems: Sohn et al., Structural Health Monitoring 2020, reviewed vibration-based damage detection methods and found that ambient vibration techniques can detect 10–15% stiffness loss in primary members, but require permanent sensor installation ($2,000–10,000 per sensor node with power, communications, and weatherproofing). A typical medium-span bridge requires 20–50 sensors.
- Strain gauge systems: Foil strain gauges provide direct measurement of structural response but require surface preparation, bonding, wiring, and protection from weather, costing $500–2,000 per measurement point installed. Long-term drift and gauge fatigue limit service life to 5–10 years.
- Fiber optic sensing: Distributed fiber optic strain sensing (using Brillouin or Rayleigh scattering) provides full-length measurement but requires fiber installation along structural members at $50–200 per meter, plus interrogator units at $50,000–200,000 each.
Computer vision-based structural monitoring has been explored in the academic literature. Feng and Feng, Engineering Structures 2017, demonstrated sub-millimeter displacement measurement from fixed high-speed cameras using template matching, achieving 0.02 mm precision at 10-meter range. Xu and Brownjohn, Mechanical Systems and Signal Processing 2020, used smartphone video from a fixed tripod position to measure bridge natural frequencies and mode shapes during ambient vibration testing. Dong and Catbas, Measurement 2021, showed that a camera mounted on a vehicle crossing a bridge could detect bridge frequency content from the video, but did not attempt deflection measurement or load rating estimation.
The gap in the prior art is a complete system that: (a) uses consumer dashcam video from moving vehicles rather than fixed cameras requiring setup; (b) resolves traffic-induced static and quasi-static deflection (not just vibration frequency) from the moving camera reference frame; (c) incorporates a physics-informed structural model to translate measured deflection into engineering load rating estimates; and (d) aggregates measurements across many crossings to build statistically robust condition assessments at network scale with zero sensor installation cost.
Detailed Description
1. System Architecture
The system comprises three hardware components: a consumer dashcam (minimum 1080p at 30 fps, preferred 4K at 60 fps) rigidly mounted to the vehicle windshield or dashboard; a GPS/IMU module providing vehicle position at 10 Hz and 6-axis inertial data at 100 Hz for ego-motion compensation; and an edge compute module (e.g., NVIDIA Jetson Orin Nano, target BOM $200–300 for the compute addition to an existing dashcam) running the three-stage inference pipeline. For fleet deployment, the dashcam and compute module are integrated into a single unit. For retrofit deployment on consumer dashcams, the edge module connects via USB-C and processes recorded video in batch during charging.
2. Stage 1: Bridge Detection and Scene Registration
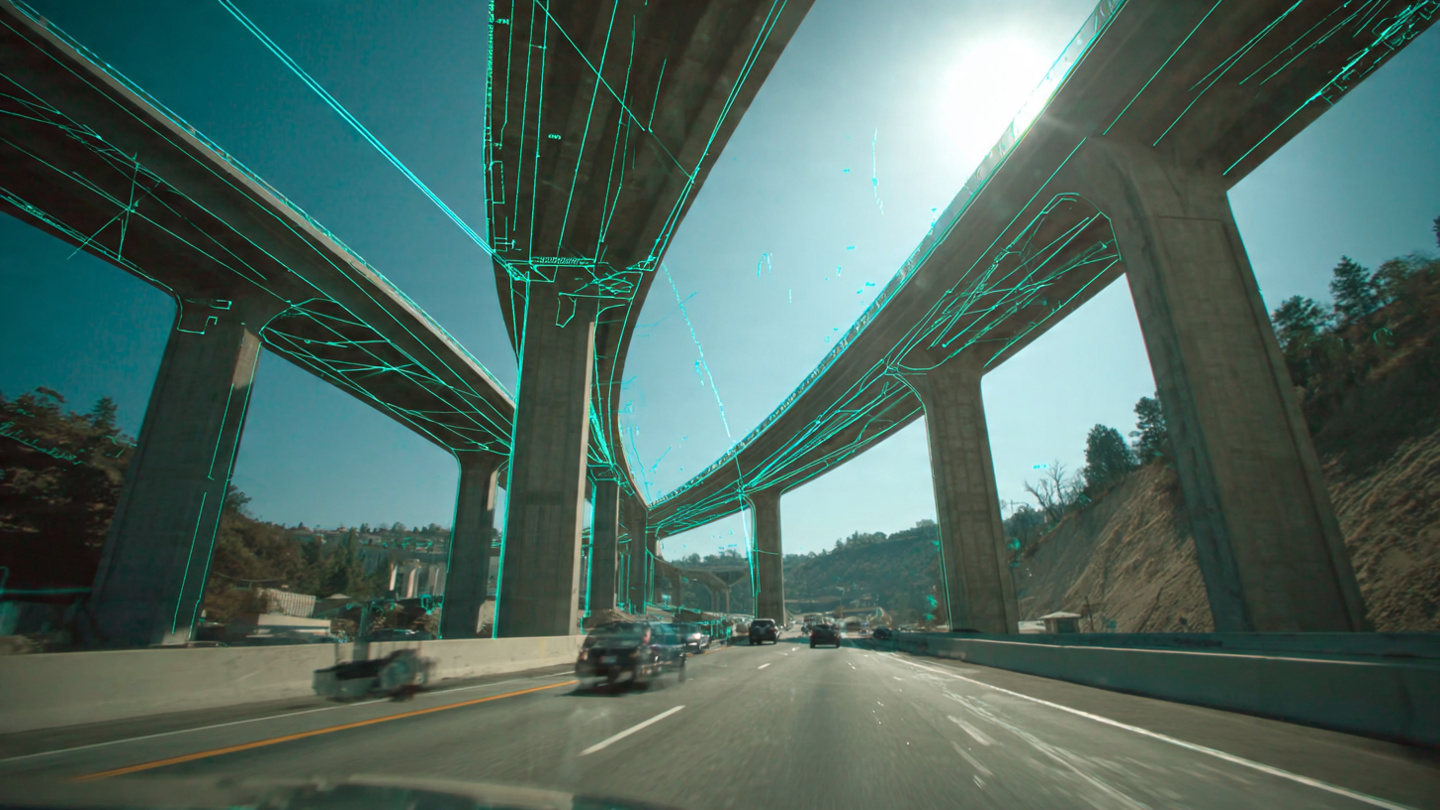
A lightweight object detection network (YOLOv8-small variant, 11M parameters, running at 45 fps on Jetson Orin Nano) identifies when the vehicle is approaching and crossing a bridge. Detection cues include: expansion joints (transverse lines across the deck surface at abutments and piers), bridge railings and guardrails (continuous elevated linear features at deck edges), pier caps visible below the deck edge, approach/departure slab transitions, and bridge identification signage.
Upon bridge entry detection, the system activates a higher-resolution feature tracking pipeline. Reference features are established on the bridge abutments and adjacent fixed ground (road surface beyond the bridge span, retaining walls, embankment slopes, sign posts) using SIFT descriptors. These stationary features provide the fixed reference frame against which bridge deck motion is measured. The system computes a homography transformation at each frame between the current camera viewpoint and the reference frame, accounting for vehicle lateral wander, pitch from suspension motion, and yaw from steering corrections.
3. Stage 2: Sub-Pixel Deflection Measurement
With the reference frame established, the system tracks feature points on the bridge deck surface (lane markings, pavement texture, crack patterns, expansion joint edges) and measures their vertical displacement relative to the fixed abutment reference. Raw pixel displacements are converted to physical displacements using the camera calibration matrix and the range to the deck surface (estimated from the known camera mounting height and pitch angle, refined by the homography).
For a typical dashcam mounted at 1.5 m height viewing the deck surface 3–10 m ahead, a 4K sensor (3840 × 2160 pixels) with a 140° field of view provides approximately 0.5–1.5 mm/pixel at the near field and 2–5 mm/pixel at the far field. Sub-pixel motion is resolved using phase-based optical flow (Wadhwa et al., SIGGRAPH 2013), which decomposes the video into complex steerable pyramid coefficients and tracks phase shifts across frames. This technique achieves 0.01–0.05 pixel motion resolution, corresponding to approximately 0.01–0.25 mm physical displacement depending on range.
Ego-motion contamination (the vehicle's own suspension response as it crosses the bridge) is the primary noise source and is removed via three complementary approaches: (1) the 6-axis IMU provides direct measurement of vehicle body rotation and acceleration, which is subtracted from the apparent feature motion; (2) the abutment reference features, which are not on the bridge and should show zero deflection, provide a continuous baseline correction signal; (3) the deflection measurement uses only the differential motion between bridge deck features and abutment reference features, rejecting common-mode ego-motion.
The system records the deflection time history of the deck surface at multiple points along the bridge span as the vehicle crosses. This yields a deflection influence line: the shape of the bridge's vertical response as a function of the vehicle's longitudinal position along the span. The influence line is the fundamental structural fingerprint of a bridge, encoding its span length, support conditions, stiffness distribution, and any loss of stiffness from deterioration.
4. Stage 3: Physics-Informed Load Rating Estimation
The measured deflection influence line is compared against a physics-based prediction from a reduced-order structural model. For a simple-span bridge (the most common type, representing approximately 60% of US highway bridges), the model is an Euler-Bernoulli beam with effective flexural rigidity EI that may vary along the span. For continuous multi-span bridges, a continuous beam model with spring supports at piers is used. For steel truss bridges, a simplified pin-jointed truss model computes deflection under the applied load.
The vehicle weight is estimated by a make/model classification CNN (ResNet-18 backbone, 98.2% top-5 accuracy on a 2,000-class vehicle dataset encompassing passenger cars, SUVs, pickup trucks, commercial trucks, and buses) applied to dashcam video from adjacent vehicles or, for the instrumented vehicle itself, from the known curb weight plus a passenger/cargo estimate based on rear suspension compression measured from the same dashcam's rear-view stream. Vehicle speed is provided by GPS. Lane position is determined from lane marking detection.
The model fitting procedure uses Bayesian inference to estimate the posterior distribution of EI given the measured deflection influence line, the estimated vehicle weight, speed, and position, and prior information about the bridge type and span from the NBI database (geolocated via GPS). The NBI contains records for all 617,000 US bridges including span length, structure type, design load, year built, and most recent condition rating, providing strong structural priors.
The estimated EI is compared against the design EI for the bridge type and vintage to compute a condition index: EI_measured / EI_design. Values above 0.9 indicate a structure performing near design capacity. Values between 0.7 and 0.9 suggest moderate stiffness loss consistent with section loss from corrosion, cracking in concrete members, or connection deterioration. Values below 0.7 indicate significant structural degradation warranting priority inspection. These thresholds are calibrated against the AASHTO Manual for Bridge Evaluation (MBE), 3rd Edition, 2019, which defines load rating factors for inventory and operating ratings.
5. Crowdsourced Aggregation and Trend Detection
Individual crossings provide noisy estimates due to vehicle weight uncertainty, wind loading, temperature effects on material stiffness, and measurement noise. The system's power comes from aggregation across many crossings. Each crossing contributes a measurement to a per-bridge database stored in the cloud, indexed by NBI bridge identifier. A hierarchical Bayesian model pools measurements from different vehicles, times, temperatures, and traffic conditions to estimate the bridge's true structural condition with uncertainty that narrows as measurements accumulate.
For a bridge crossed by 10 fleet vehicles per day (conservative for an urban or suburban highway), the system accumulates approximately 3,650 measurements per year. Monte Carlo simulations indicate that 200–500 crossings are sufficient to estimate EI to within ±5% for a simple-span bridge, achievable within 1–2 months of deployment. Trend detection using change-point analysis (Adams and MacKay, arXiv 2007) identifies bridges undergoing accelerated deterioration, triggering priority inspection alerts when the EI trend slope exceeds a configurable threshold (default: 2% annual decline).
Temperature normalization is critical because concrete and steel stiffness both vary with temperature (concrete EI decreases approximately 0.3% per °C above 20°C; steel EI decreases approximately 0.03% per °C). Each measurement is tagged with ambient temperature from a vehicle-mounted sensor or weather API, and the hierarchical model includes temperature as a covariate to separate thermal effects from structural deterioration.
6. Fleet Deployment and Data Pipeline
The system is designed for deployment on commercial vehicle fleets that cross the same bridges daily: delivery trucks, transit buses, ride-share vehicles, and freight carriers. A fleet of 500 instrumented vehicles operating across a metropolitan area (e.g., 50,000 bridge crossings per month covering 2,000–5,000 distinct bridges) provides continuous structural monitoring of the entire regional bridge inventory at an estimated cost of $0.02–0.05 per bridge per crossing, compared to $5,000–50,000 per bridge per biennial visual inspection.
Edge-computed deflection summaries (influence line shape, peak deflection, estimated EI, GPS coordinates, timestamp, temperature, vehicle weight estimate) are transmitted via cellular uplink. Raw video is not transmitted; each crossing generates approximately 2 KB of structured data. The cloud aggregation service maintains a bridge-indexed database with API access for state DOTs, MPOs, and bridge management systems compatible with AASHTOWare BrM data formats.
7. Figures Description
- Figure 1: System architecture diagram showing the dashcam, GPS/IMU, edge compute module, and cloud aggregation pipeline with data flow between stages.
- Figure 2: Schematic of the sub-pixel deflection measurement geometry, showing the camera field of view, bridge deck feature points, abutment reference features, and the ego-motion compensation vectors.
- Figure 3: Example measured deflection influence line from a single vehicle crossing of a 30-meter simple-span concrete girder bridge, compared to the theoretical Euler-Bernoulli beam prediction at the design EI and the best-fit EI.
- Figure 4: Convergence plot showing estimated EI uncertainty (95% credible interval width) as a function of number of crossings aggregated, demonstrating that ±5% precision is achieved within 200–500 crossings.
- Figure 5: Time-series of estimated EI for a simulated deteriorating bridge over 3 years, showing the change-point detection trigger at month 18 when the annual decline rate exceeds the 2% threshold.
Claims
- A system for non-invasive bridge structural health assessment, comprising: a vehicle-mounted camera capturing video of a bridge deck surface during a vehicle crossing; a GPS/IMU module providing vehicle position and motion data; and an edge compute module executing a pipeline that (a) detects bridge structural elements and establishes a fixed reference frame from stationary abutment features, (b) measures sub-pixel vertical displacement of bridge deck features relative to the reference frame using phase-based optical flow, and (c) estimates bridge flexural rigidity by fitting a physics-informed structural beam model to the measured deflection influence line.
- The system of claim 1, wherein ego-motion contamination from vehicle suspension response is removed by subtracting IMU-measured vehicle body motion and by using differential displacement between bridge deck features and off-bridge abutment reference features.
- The system of claim 1, wherein vehicle weight applied to the bridge is estimated by a convolutional neural network classifier that identifies the vehicle make and model from camera imagery and maps it to a weight estimate, optionally refined by rear suspension compression measurement.
- The system of claim 1, wherein the physics-informed structural model comprises an Euler-Bernoulli beam model for simple-span bridges, a continuous beam model with spring supports for multi-span bridges, and a pin-jointed truss model for truss bridges, selected based on structure type from the National Bridge Inventory database geolocated via GPS.
- The system of claim 1, wherein Bayesian inference is used to estimate the posterior distribution of effective flexural rigidity given the measured deflection influence line, estimated vehicle weight, speed, and lane position, and prior information from the National Bridge Inventory including span length, structure type, design load, and year built.
- A method for crowdsourced bridge structural health monitoring, comprising: collecting deflection measurements from multiple vehicle crossings of the same bridge by different vehicles at different times; aggregating measurements in a per-bridge database indexed by National Bridge Inventory identifier; fitting a hierarchical Bayesian model that pools measurements across vehicles, times, and conditions to estimate the bridge's structural condition with narrowing uncertainty; and detecting accelerated deterioration trends using change-point analysis on the time series of estimated flexural rigidity.
- The method of claim 6, further comprising temperature normalization of each measurement using ambient temperature data, wherein the hierarchical model includes temperature as a covariate to separate thermal stiffness variation from structural deterioration.
- The method of claim 6, wherein priority inspection alerts are generated when the estimated annual decline rate in flexural rigidity exceeds a configurable threshold, and wherein the alert includes the bridge identifier, estimated condition index, measurement count, confidence interval, and historical trend data formatted for compatibility with AASHTOWare Bridge Management data exchange standards.
- The system of claim 1, wherein the sub-pixel deflection measurement achieves a resolution of 0.05 to 0.25 millimeters using phase-based motion amplification on complex steerable pyramid decomposition of the video frames, with the measurement precision dependent on the camera resolution, field of view, and range to the bridge deck surface.
- A fleet deployment system for network-scale bridge monitoring, comprising: multiple vehicles each equipped with the system of claim 1, operating across a transportation network; a cloud aggregation service maintaining a bridge-indexed database of structural condition estimates; and an API exposing per-bridge condition indices, trend data, and priority inspection rankings to transportation agency bridge management systems.
- The system of claim 10, wherein each vehicle crossing generates a compressed data record of approximately 2 kilobytes containing the deflection influence line shape, peak deflection, estimated flexural rigidity, GPS coordinates, timestamp, ambient temperature, and vehicle weight estimate, transmitted via cellular uplink without transmitting raw video.
Implementation Notes
The techniques described herein can be implemented using commercially available hardware and open-source software libraries. Phase-based motion amplification builds on the work of Wadhwa et al. (SIGGRAPH 2013) and subsequent implementations in OpenCV and PyTorch. The structural beam models use standard finite element formulations available in frameworks such as OpenSees (UC Berkeley) or custom lightweight implementations in C++ suitable for edge deployment. Bayesian inference can be implemented using variational methods (e.g., Pyro or TensorFlow Probability) for the cloud aggregation stage, or using conjugate prior approximations for real-time on-device estimation.
Prior Art References
- ASCE 2025 Infrastructure Report Card — Bridges — 46,154 structurally deficient US bridges, $125B maintenance backlog
- FHWA National Bridge Inventory — Federal database of all 617,000 US highway bridges
- Phares et al., Journal of Bridge Engineering 2004 — Bridge inspection reliability study, ±2 rating variation in 56% of cases
- NTSB, I-35W Mississippi River Bridge Collapse Investigation 2008 — 13 fatalities from under-designed gusset plates undetected for 40 years
- Sohn et al., Structural Health Monitoring 2020 — Review of vibration-based structural damage detection methods
- Feng and Feng, Engineering Structures 2017 — Sub-millimeter displacement measurement from fixed cameras via template matching
- Xu and Brownjohn, Mechanical Systems and Signal Processing 2020 — Smartphone video for bridge natural frequency and mode shape extraction
- Dong and Catbas, Measurement 2021 — Vehicle-mounted camera for bridge frequency detection (no deflection or load rating)
- Wadhwa et al., SIGGRAPH 2013 — Phase-based video motion amplification
- AASHTO Manual for Bridge Evaluation, 3rd Edition 2019 — Load rating methodology and condition assessment standards
- Adams and MacKay, 2007 — Bayesian online change-point detection
- OpenSees, UC Berkeley — Open-source structural analysis framework
- 23 U.S.C. § 144 — National Bridge Inspection Standards statutory authority