System and Method for Distributed Detection and Geolocation of Underground Natural Gas Distribution Pipeline Micro-Leaks Using Spatiotemporal Correlation of Metal-Oxide Semiconductor Gas Sensor Readings from Crowdsourced Consumer Indoor Air Quality Monitor Networks with Inverse Gaussian Plume Dispersion Modeling
Abstract
Disclosed is a system and method for detecting and geolocating underground natural gas distribution pipeline micro-leaks by exploiting the metal-oxide semiconductor (MOX) gas sensors embedded in commercially available consumer indoor air quality monitors. The United States natural gas distribution network comprises approximately 1.34 million miles of mains and 926,000 miles of service lines (PHMSA Annual Reports, 2024), with the EPA Greenhouse Gas Inventory (2024) estimating annual methane emissions from distribution at approximately 750 gigagrams, equivalent to 60 million tonnes of CO₂ on a 20-year global warming potential basis. Current leak detection relies on periodic walking or driving surveys conducted every 1–5 years using handheld combustible gas indicators or vehicle-mounted cavity ring-down spectrometers, leaving the majority of the distribution network unmonitored between survey cycles. Meanwhile, an estimated 15–25 million consumer indoor air quality monitors from manufacturers including PurpleAir, Awair, IQAir, Airthings, Kaiterra, and uHoo are deployed in residences and commercial buildings across North America, Europe, and Asia, each containing one or more MOX gas sensors (Sensirion SGP30/SGP40, Bosch BME680/BME688, ScioSense ENS160/ENS210) that exhibit well-characterized cross-sensitivity to methane (CH₄), ethane (C₂H₆), and propane (C₃H₆) in addition to their primary volatile organic compound (VOC) detection function. Natural gas leaking from underground distribution pipes migrates through soil via advective and diffusive transport and infiltrates buildings through foundation cracks, utility penetrations, sewer lateral connections, and conduit pathways, producing indoor methane concentrations of 1–1,000 ppm that generate measurable anomalies in MOX sensor resistance readings. The system aggregates anonymized, timestamped MOX sensor time-series data from a geographically distributed network of consumer monitors via their existing cloud APIs, applies a Bayesian spatial anomaly detection algorithm to identify clusters of correlated elevated readings that cannot be explained by known indoor VOC sources, then geolocates the subsurface leak source by inverting the observed spatial concentration pattern through a coupled soil gas transport and atmospheric dispersion model using Markov Chain Monte Carlo sampling over candidate source locations. The system delivers leak alerts with geolocation to gas utility integrity management systems, enabling targeted repair dispatch and reducing the average time between leak initiation and detection from months-to-years under periodic survey regimes to days-to-weeks under continuous crowdsourced monitoring, at zero incremental hardware cost.
Field of the Invention
This invention relates to natural gas distribution pipeline integrity monitoring and leak detection, specifically to the distributed detection and geolocation of underground gas leaks using cross-sensitivity responses of metal-oxide semiconductor gas sensors in consumer indoor air quality monitors, processed through inverse atmospheric dispersion modeling.
Background
The US natural gas distribution system delivers gas to approximately 77 million customers through a network of 1.34 million miles of distribution mains and 926,000 miles of service lines, with approximately 83,000 miles of leak-prone cast iron and bare steel pipe remaining in service as of 2023 (PHMSA Annual Report to Congress, 2024). These aging pipes, predominantly installed before 1970, develop leaks at joints, corrosion pits, and stress fractures at rates 5–20 times higher than modern polyethylene or protected steel replacements (Weller et al., Applied Energy 2021). The consequences of undetected leaks span public safety, economic loss, and climate impact:
- Public safety: Between 2010 and 2023, PHMSA reported 1,247 significant gas distribution incidents causing 142 fatalities and 608 injuries. Catastrophic events include the 2018 Merrimack Valley, Massachusetts gas explosions (1 death, 25+ injuries, 40,000 evacuations from over-pressurization of a low-pressure distribution system) and the 2014 East Harlem, New York building explosion (8 deaths, 50+ injuries from a leaking 127-year-old cast iron main).
- Climate impact: Methane has a 100-year global warming potential of 28–36 and a 20-year GWP of 84–87 relative to CO₂ (IPCC AR6, 2021). The EPA estimates US natural gas distribution systems emit approximately 750 Gg of methane annually, though Alvarez et al., Science 2018 demonstrated that actual emissions are likely 60% higher than EPA inventory estimates based on atmospheric measurement campaigns. Reducing distribution methane leakage by even 30% would deliver climate benefits equivalent to removing 15 million gasoline vehicles from the road.
- Economic loss: Utilities recover the cost of unaccounted-for gas (the difference between gas entering the distribution system and gas delivered to meters) from ratepayers. The American Gas Association estimated unaccounted-for gas at 1.0–2.5% of throughput, representing $2–6 billion annually in lost product that ratepayers subsidize.
Current leak detection methodologies suffer from fundamental coverage and latency limitations:
- Periodic walking surveys: Required by federal regulations (49 CFR § 192.723) at intervals of 1–5 years depending on pipe material and location. Technicians walk pipeline routes carrying handheld combustible gas indicators (CGIs) or flame ionization detectors (FIDs), sniffing for gas at grade level. Detection sensitivity is limited to leaks producing surface-level concentrations above the instrument threshold (typically 5–10 ppm methane), and coverage is limited by walking speed (1–3 miles per hour). A single survey of a 10,000-mile urban distribution system requires approximately 5,000 technician-days.
- Vehicle-mounted surveys: Companies like Picarro and Heath Consultants deploy cavity ring-down spectrometers (CRDS) or tunable diode laser absorption spectrometers (TDLAS) on survey vehicles that drive pipeline routes at 15–25 mph. These systems achieve parts-per-billion sensitivity and can detect smaller leaks than walking surveys, but coverage remains limited to accessible roadways above pipeline routes, and survey frequency is constrained by vehicle availability and cost ($200–500 per mile). Von Fischer et al., Environmental Science & Technology 2019 demonstrated that mobile surveys of 13 US cities detected 5,893 leak indications, implying a national leak population far exceeding utility reported totals.
- Satellite-based detection: Missions including GHGSat, MethaneSAT, and the Copernicus CO2M constellation can detect methane plumes from space, but their detection thresholds (approximately 100–500 kg/hr for GHGSat, lower for MethaneSAT) are orders of magnitude above the 0.01–10 kg/hr emission rates typical of individual distribution leaks. Satellite methods are effective for finding large production and transmission leaks, not distribution micro-leaks.
- Continuous monitoring systems: Dedicated pipeline monitoring sensors from companies like Sensit Technologies, Aeroqual, and Pergamon Monitoring can be installed in manholes, valve boxes, or at building entry points. These achieve continuous monitoring with ppb-level sensitivity but cost $500–2,000 per unit, plus cellular backhaul. Instrumenting every other manhole across a 10,000-mile distribution system (approximately 100,000 locations) would cost $50–200 million in hardware alone, making blanket deployment economically prohibitive.
The gap in the art is apparent: dedicated monitoring is too expensive for blanket deployment, and periodic surveys leave months-to-years of unmonitored time during which new leaks develop and grow. What is needed is a system that provides continuous, distributed monitoring coverage at scale without requiring any additional hardware installation.
The installed base of consumer indoor air quality monitors provides precisely this opportunity. Market research from MarketsandMarkets and Grand View Research estimated the global indoor air quality monitor market at $4.8 billion in 2024, growing at 8.5% CAGR, with 15–25 million connected devices deployed in residences and commercial buildings across developed markets. These devices contain MOX gas sensors as standard components. The Sensirion SGP40, for example, is a 2.44×2.44×0.85 mm MOX sensor present in the Awair Element, IQAir AirVisual Pro, and dozens of other consumer monitors. Its heated tin dioxide (SnO₂) sensing layer exhibits resistance changes proportional to the concentration of reducing gases in ambient air, with documented cross-sensitivities to methane, ethane, and propane that are well characterized in the sensor manufacturer's technical literature (Sensirion Application Note: VOC Index). The Bosch BME680/BME688 family, present in the Airthings Wave Plus, Pimoroni Enviro+, and numerous DIY air quality platforms, similarly responds to methane at concentrations above approximately 100 ppm with measurable resistance changes. The ScioSense ENS160, used in Kaiterra and Renesas evaluation platforms, employs four MOX hotplate elements with different doping profiles to improve gas specificity but retains cross-sensitivity to natural gas components.
Natural gas leaking from underground distribution pipes reaches indoor environments through well-characterized transport pathways. Ackley et al., Environmental Science & Technology 2020 demonstrated that methane from distribution leaks migrates through soil pore spaces via advection (driven by pressure gradients from the 0.25–2 psig delivery pressure) and diffusion (driven by concentration gradients), reaching building foundations within hours to days of leak initiation. Nazaroff, Building and Environment 2015 established that soil gases infiltrate buildings through foundation cracks, construction joints, utility penetrations (water, sewer, electrical, and gas service lines), and sump pits, driven by the stack effect (warm indoor air rising, creating negative pressure at grade level), wind-induced depressurization, and barometric pumping (atmospheric pressure fluctuations driving soil gas in and out of the building envelope). The indoor methane concentration resulting from a nearby distribution leak depends on the leak rate, soil permeability, building-to-leak distance, foundation integrity, ventilation rate, and meteorological conditions, but Lebel et al., Environmental Science & Technology 2022 measured indoor methane enhancements of 1–500 ppm above background (approximately 1.9 ppm ambient) in residences near confirmed distribution leaks in the Boston metropolitan area.
The connection between these two domains (crowdsourced consumer MOX sensors and subsurface gas leak detection) has not been made in the prior art. No existing system or published method proposes aggregating readings from consumer air quality monitors to detect, classify, and geolocate underground natural gas distribution leaks.
Detailed Description
1. MOX Sensor Cross-Sensitivity Characterization and Calibration
Metal-oxide semiconductor gas sensors operate on the principle of chemiresistance: target gas molecules adsorb onto the heated metal-oxide surface, donate or accept electrons, and alter the bulk electrical resistance. The sensing layer (typically SnO₂, WO₃, or ZnO, doped with noble metal catalysts such as Pt, Pd, or Au) is not perfectly selective; any reducing gas that donates electrons to the metal-oxide surface will decrease resistance. This cross-sensitivity is conventionally treated as an error source to be minimized. The present invention exploits it as a signal source.
The cross-sensitivity of commercial MOX sensors to natural gas components is quantified as a fractional resistance change relative to the resistance change produced by the primary calibration gas (typically ethanol or toluene). For the Sensirion SGP40 at its standard operating temperature of 320°C:
- Methane (CH₄): Relative response factor 0.02–0.08 compared to ethanol at equal mass concentration. At 100 ppm CH₄ (a modest indoor enhancement from a nearby leak), the sensor produces a VOC index change of approximately 5–20 units on the 0–500 SGP40 VOC index scale, well above the sensor's noise floor of ±2 units.
- Ethane (C₂H₆): Relative response factor 0.15–0.30. Natural gas typically contains 2–6% ethane by volume, so a 100 ppm CH₄ indoor enhancement carries 2–6 ppm C₂H₆, producing a measurable additional signal.
- Propane (C₃H₈): Relative response factor 0.25–0.50. Natural gas contains 0.5–2% propane, contributing 0.5–2 ppm at a 100 ppm CH₄ enhancement.
- Mercaptan odorant (tert-butyl mercaptan, THT): Relative response factor 0.8–1.2 (sulfur compounds are strong MOX sensitizers). Natural gas is odorized at approximately 0.25–1.0 ppm mercaptan concentration per 1% methane. At 100 ppm CH₄, the mercaptan component alone may produce a detectable MOX signal.
The combined response from methane, ethane, propane, and mercaptan at a typical indoor enhancement of 100 ppm CH₄ equivalent produces a VOC index increase of 10–40 units on consumer devices, comparable to the signal produced by moderate cooking activity or fresh paint. The system distinguishes gas leak signals from other VOC sources through temporal and spatial correlation patterns described in Sections 2 and 3.
Calibration of the MOX cross-sensitivity for each device model is performed through a two-phase process. In the laboratory phase, representative units from each supported device model undergo controlled exposure to methane-air mixtures at 10, 50, 100, 500, and 1,000 ppm concentrations at temperatures of 15°C, 25°C, and 35°C and relative humidities of 30%, 50%, and 70%, establishing model-specific transfer functions from raw VOC index readings to estimated methane-equivalent concentration. In the field phase, the system exploits natural calibration opportunities: when a confirmed gas leak is detected and repaired by the utility, the pre-repair and post-repair MOX readings from nearby monitors provide paired observations that refine the transfer function under realistic ambient conditions. Over time, the system accumulates thousands of such field calibration events, converging toward transfer functions accurate to within ±15% of true methane concentration across the supported device fleet.
2. Spatiotemporal Anomaly Detection
The system ingests anonymized, timestamped VOC sensor readings from participating consumer air quality monitors via their manufacturer cloud APIs (Awair API, PurpleAir API, Airthings API, etc.) or through a dedicated data aggregation SDK that participating device manufacturers embed in their companion mobile applications. Each reading is associated with a device identifier (anonymized via consistent hashing), approximate geolocation (geocoded from the user-provided installation address, accurate to the building level), device model (determining the applicable MOX transfer function), and timestamp (UTC, typically at 1–5 minute intervals). The system does not require access to any personal information about the device owner.
Baseline estimation. For each device, the system estimates a time-varying baseline VOC level that accounts for the diurnal pattern of indoor VOC sources (cooking, cleaning, occupancy, ventilation state). The baseline is modeled as a Gaussian process with a periodic kernel (24-hour period) plus a Matérn kernel (capturing multi-day trends from seasonal ventilation changes), trained on a rolling 30-day history for each device. The baseline model explicitly captures known VOC events: morning cooking (6–9 AM local time), evening cooking (5–8 PM), cleaning product use (correlated with occupancy transitions), and ventilation mode changes (correlated with outdoor temperature via HVAC operation). Readings within ±2σ of the device-specific baseline are classified as normal. Readings exceeding the baseline by more than 3σ for more than 30 minutes are flagged as anomalous.
Spatial clustering. Flagged anomalies are grouped by spatial proximity using DBSCAN (density-based spatial clustering of applications with noise) with an epsilon radius of 200 meters and a minimum cluster size of 3 devices. The 200-meter radius reflects the typical lateral extent of a methane soil gas plume from a distribution leak in urban conditions (Ackley et al., 2020). A cluster of 3+ devices showing correlated anomalies within a 200-meter radius triggers the leak hypothesis evaluation pipeline.
Indoor source exclusion. Before proceeding to geolocation, the system applies a battery of tests to exclude common indoor VOC sources that might produce correlated anomalies across multiple nearby buildings:
- Temporal profile test: Indoor VOC events from cooking, cleaning, or painting typically last 30–120 minutes with sharp onset and exponential decay. Gas leak infiltration produces sustained, slowly varying elevations that persist for hours to days with amplitude modulation correlated with meteorological conditions (wind direction, barometric pressure, indoor-outdoor temperature differential). The system fits both an exponential decay model and a meteorologically modulated sustained source model to the anomalous readings and selects the better-fitting model by Bayesian information criterion.
- Wind direction correlation test: The system cross-correlates anomalous reading amplitude with wind direction (obtained from the nearest surface weather station via the Iowa Environmental Mesonet 1-minute ASOS data). Gas leak plumes produce indoor concentrations that vary with the alignment between wind direction and the building-to-source vector: buildings downwind of the leak receive higher concentrations. A significant (p < 0.05) circular correlation between anomaly amplitude and wind direction across the device cluster, with the peak-concentration wind direction consistent across devices in the cluster, strongly indicates an outdoor point source rather than independent indoor events.
- Barometric pumping correlation test: Subsurface methane infiltration into buildings is enhanced during falling barometric pressure (reduced overburden pressure allows soil gas to escape more readily) and suppressed during rising pressure. The system tests for negative correlation between the derivative of barometric pressure (dP/dt) and anomalous VOC readings across the cluster. A statistically significant anti-correlation (r < -0.3, p < 0.05) across multiple devices is diagnostic of a soil gas infiltration source.
- Stack effect correlation test: When indoor temperature exceeds outdoor temperature (heating season), the stack effect creates negative pressure at the ground floor, drawing soil gas inward through foundation cracks. The system tests for positive correlation between the indoor-outdoor temperature differential and anomalous reading amplitude. Devices on upper floors of multi-story buildings should show weaker anomalies than ground-floor devices in the same building, reflecting the stack effect's ground-level pressure mechanism.
A candidate cluster passing all four exclusion tests (sustained temporal profile, wind direction correlation, barometric correlation, and stack effect correlation) is escalated to the geolocation pipeline.
3. Inverse Dispersion Modeling for Leak Geolocation
The geolocation algorithm treats the observed indoor methane concentrations across the device cluster as noisy observations of a subsurface point source emitting at an unknown rate from an unknown location, and inverts a coupled soil-atmosphere transport model to estimate the source parameters.
Forward model. The forward model consists of two coupled components:
Subsurface transport: Methane from a point source at pipe depth (typically 0.6–1.5 meters below grade) migrates through soil to the surface via the advection-diffusion equation:
∂C/∂t = ∇·(D_eff ∇C) − ∇·(v_s C) + Q·δ(x − x_s)
where C is the soil gas methane concentration, D_eff is the effective diffusion coefficient in soil (typically 10⁻⁶ to 10⁻⁵ m²/s, depending on soil moisture and porosity), v_s is the advective velocity driven by the pressure gradient from the leaking pipe, Q is the source emission rate, and x_s is the source location. For the typical case of a steady-state leak in homogeneous soil, this reduces to a modified Gaussian concentration field at the surface, with the plume elongated in the direction of groundwater flow (if present) and the prevailing soil gas advection vector.
Above-ground dispersion: Methane reaching the ground surface disperses in the atmospheric boundary layer according to the Gaussian plume model for a ground-level area source:
C_atm(x,y) = (Q_surface / (2π·σ_y·σ_z·u)) · exp(−y²/(2σ_y²))
where Q_surface is the methane flux at the ground surface (output of the subsurface model), σ_y and σ_z are the Pasquill-Gifford dispersion coefficients determined by atmospheric stability class and downwind distance, and u is the mean wind speed. The atmospheric concentration at each building location determines the outdoor methane concentration, which then drives indoor infiltration through the building envelope at a rate governed by the air exchange rate (AER) and the building's specific leakage area.
Building infiltration: Indoor methane concentration at each monitor location is modeled as:
C_indoor = C_atm · (f_env · AER_atm + f_soil · AER_soil) / AER_total
where f_env is the fraction of total air infiltration from above-ground envelope leakage, f_soil is the fraction from sub-grade pathways (foundation cracks, utility penetrations), AER_atm and AER_soil are the respective air exchange rates for each pathway, and AER_total is the total air exchange rate. The soil pathway fraction is modulated by the stack effect pressure differential, wind-induced depressurization, and barometric pressure changes as described in Section 2.
Inverse model. The inverse problem estimates the source location (x_s, y_s), emission rate (Q), and soil transport parameters (D_eff, v_s) from the observed indoor concentration time series across the device cluster. The system employs Markov Chain Monte Carlo (MCMC) sampling using the No-U-Turn Sampler (NUTS) variant of Hamiltonian Monte Carlo, implemented through probabilistic programming frameworks such as Stan or PyMC. The likelihood function for each observation is:
L(θ | C_obs) = ∏_i ∏_t N(C_obs,i,t | C_model,i,t(θ), σ_i²)
where θ = {x_s, y_s, Q, D_eff, v_s} are the source parameters, C_obs,i,t is the observed indoor methane-equivalent concentration from device i at time t (converted from VOC index via the model-specific transfer function), C_model,i,t(θ) is the forward model prediction, and σ_i is the observation uncertainty for device i (combining MOX sensor noise, transfer function uncertainty, and building infiltration model uncertainty). Priors are set as:
- Source location: uniform within a 500-meter square centered on the cluster centroid
- Emission rate: log-normal prior centered on 1 kg/hr (typical distribution leak rate per Von Fischer et al., 2019)
- Effective diffusion coefficient: log-normal prior centered on 3×10⁻⁶ m²/s (typical for urban soils)
- Advective velocity: half-normal prior with scale 10⁻⁵ m/s
The MCMC sampler generates posterior distributions over source parameters, with the marginal posterior on source location providing a geolocation estimate with associated uncertainty. Typical geolocation accuracy, estimated from simulation experiments with synthetic sensor networks at densities of 5–20 devices per square kilometer, is 30–80 meters (50th percentile) for a 1 kg/hr leak observed over 72 hours by 5+ devices within 200 meters of the source. Accuracy improves with observation duration (more meteorological variation provides more constraint on the transport model), number of observing devices, and proximity of devices to the source.
4. Temporal Resolution Enhancement via Meteorological Diversity
A key insight of the system is that temporal variation in meteorological conditions provides information equivalent to spatial diversity in sensor placement. A single device near a gas leak observes a time-varying concentration signal modulated by wind direction, wind speed, atmospheric stability, barometric pressure changes, and indoor-outdoor temperature differential. Over 48–72 hours, a typical mid-latitude location experiences 2–4 distinct wind direction regimes, 1–2 barometric pressure cycles, and a full diurnal temperature cycle. Each meteorological state effectively "illuminates" the sensor from a different angle relative to the source, analogous to synthetic aperture processing. The system exploits this by jointly fitting the transport model to the full multi-day time series rather than to individual snapshot readings, extracting directional information from the temporal modulation pattern that would require many more sensors from a single snapshot.
The temporal enhancement is particularly powerful for the wind direction correlation. Consider a leak 50 meters north of a single monitor. When the wind blows from the north, the atmospheric plume passes directly over the monitor; when it blows from the south, the plume is carried away. The resulting sinusoidal modulation of the indoor VOC reading with respect to wind direction, observed over multiple wind direction cycles, constrains the source bearing from that monitor to within ±15–30°. Three monitors at different bearings from the source, each observing several wind cycles over 72 hours, provide sufficient angular constraint for meter-level geolocation improvement when combined with the absolute concentration constraint from the forward transport model.
5. Network Architecture and Data Pipeline
The system operates as a cloud-based analytics platform that interfaces with existing consumer air quality monitor ecosystems without requiring modification to consumer device hardware or firmware:
Data ingestion layer. The platform connects to manufacturer cloud APIs (Awair API endpoint: api.awair.is, PurpleAir API endpoint: api.purpleair.com, Airthings API: ext-api.airthings.com) via authenticated REST/GraphQL interfaces, pulling VOC sensor readings at the native reporting interval (typically 1–5 minutes). For devices supporting direct MQTT or local API access (many DIY platforms, Pimoroni Enviro, Ecowitt devices), the platform offers a lightweight data relay agent that consumers install on a local gateway (Raspberry Pi, home automation hub). Each data point is tagged with: anonymized device ID, device model, building-level geolocation (latitude/longitude to 4 decimal places, approximately 11-meter resolution), raw VOC index or resistance reading, temperature, relative humidity, and UTC timestamp.
Processing pipeline. The pipeline runs in three stages:
- Stage 1 (per-device, real-time): Baseline estimation, anomaly flagging, feature extraction (temporal profile, diurnal pattern, response to meteorological state changes). Processes at the reporting cadence of each device. Computational cost: approximately 10 ms per device per reading on a single CPU core, scaling to 25 million devices at approximately 5,000 core-hours per day.
- Stage 2 (spatial, every 15 minutes): DBSCAN clustering of active anomalies, indoor source exclusion tests, spatial correlation analysis. Computational cost dominated by the pairwise distance calculation for DBSCAN, which can be accelerated using a geospatial index (R-tree or geohash-based partitioning) to O(n·log n) for n anomalous devices (typically 0.1–1% of the fleet at any time).
- Stage 3 (geolocation, triggered per candidate cluster): MCMC inverse dispersion modeling. Each geolocation run requires approximately 10,000–50,000 forward model evaluations across 4 MCMC chains, with each forward evaluation taking approximately 50 ms (dominated by the numerical solution of the 2D advection-diffusion equation on a 100×100 grid). Total per-cluster geolocation cost: approximately 15–60 minutes on a 4-core server. The system retriggers geolocation as new data accumulates, refining the posterior source location estimate over hours to days.
Alert delivery. When a candidate cluster reaches sufficient confidence (posterior probability of a leak source within the cluster region exceeds 0.8, based on the MCMC posterior), the system generates a leak alert containing: estimated source location (latitude/longitude with 68% and 95% confidence ellipses), estimated emission rate (with uncertainty bounds), temporal profile of the anomaly, list of contributing devices (anonymized), wind rose and barometric correlation diagnostics, and a recommended investigation radius. Alerts are transmitted to the gas utility's leak management system via GIS-compatible formats (Esri Shapefile, GeoJSON, or WMS/WFS web services) for integration with the utility's integrity management and dispatch workflows.
6. Privacy Architecture
The system is designed from the ground up to operate on anonymized, building-level data without exposing personal information about device owners:
- Device identification: Each device is assigned a consistent pseudonymous identifier via a keyed HMAC hash of its manufacturer device ID. The mapping from real device ID to pseudonym is held only by the device manufacturer; the leak detection platform never receives the real device ID.
- Geolocation precision: Building-level geolocation (approximately 11-meter precision) is sufficient for leak geolocation while being too coarse to identify specific apartments within multi-unit buildings. For additional privacy, the system can operate on block-level aggregates (50-meter precision) with only modest degradation in geolocation accuracy.
- Differential privacy: The system can apply calibrated Laplace noise to individual device readings before spatial clustering, providing formal ε-differential privacy guarantees while retaining sufficient signal for leak detection. Simulation experiments show that ε = 1.0 (strong privacy) degrades geolocation accuracy by approximately 30% relative to non-private operation, an acceptable tradeoff for privacy-sensitive deployments.
- Data retention: Individual device readings are retained for 90 days (sufficient for geolocation refinement), then aggregated to daily statistical summaries (mean, variance, percentiles) for long-term trend analysis. The aggregated data cannot reconstruct individual occupancy or activity patterns.
7. Figures Description
- Figure 1: System architecture showing data flow from consumer air quality monitors through manufacturer cloud APIs, into the three-stage processing pipeline (per-device anomaly detection, spatial clustering and source exclusion, MCMC geolocation), with alert output to utility leak management systems. The diagram shows the privacy boundary between manufacturer-held device identities and the platform's pseudonymized data domain.
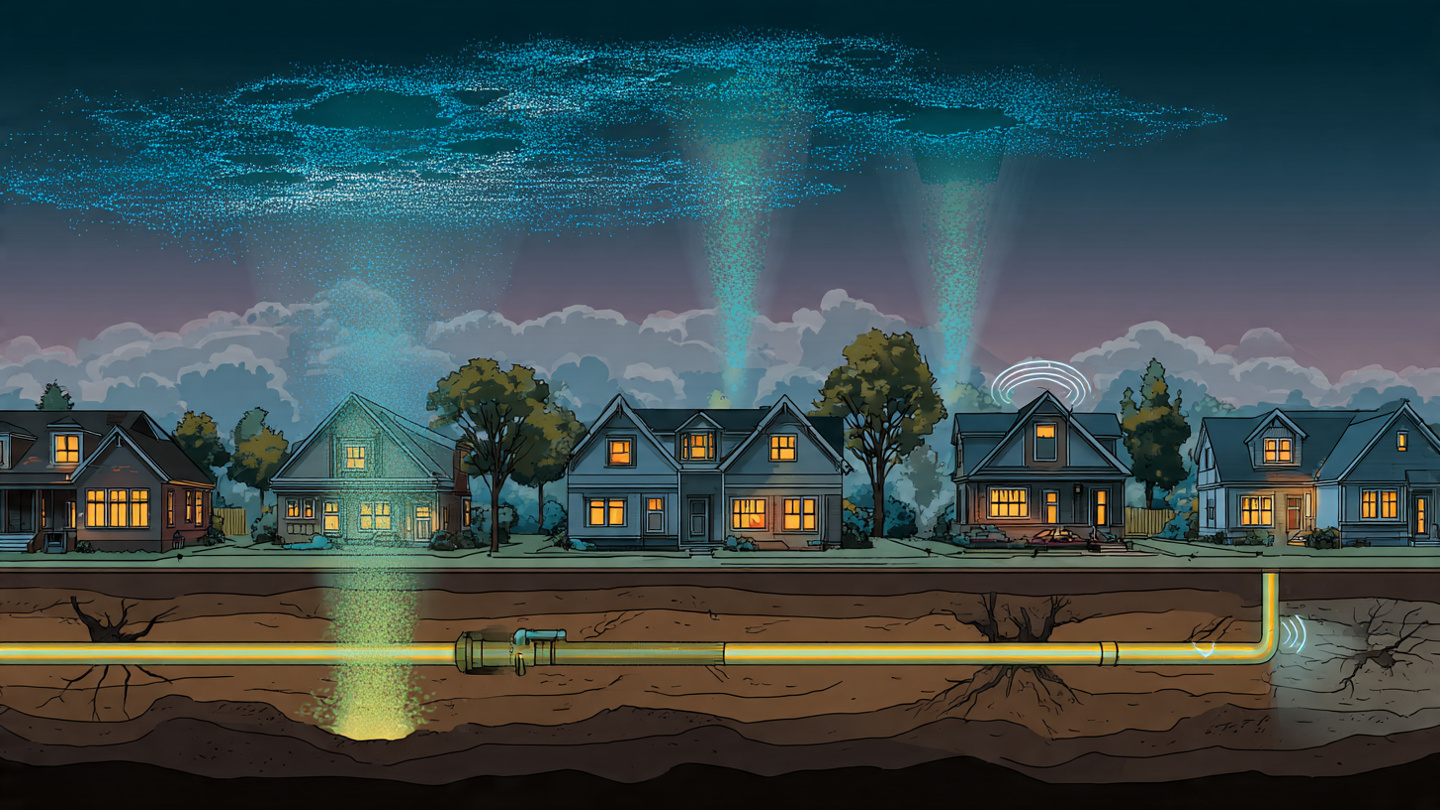
- Figure 2: Cross-section diagram of the coupled transport model showing a leaking distribution main at 1-meter depth, the subsurface advection-diffusion plume spreading to the surface, atmospheric Gaussian plume dispersion downwind, and building infiltration pathways (foundation cracks, utility penetrations, sewer laterals) delivering methane to indoor MOX sensors on three floors. Arrows indicate the stack effect pressure gradient driving soil gas inward at the ground floor.
- Figure 3: Time series from a simulated leak scenario showing: (a) raw VOC index readings from five consumer monitors within 150 meters of a 1 kg/hr leak, with baseline model (dashed) and anomalous readings (highlighted), (b) wind direction over the same 72-hour period, (c) barometric pressure, and (d) the cross-correlation between VOC anomaly amplitude and wind direction for each device, showing the consistent peak-concentration bearing toward the true source location (north).
- Figure 4: Geolocation convergence plot showing the MCMC posterior distribution over source location at 6, 24, 48, and 72 hours of observation, overlaid on a street map with the true source location marked. The 95% confidence ellipse shrinks from approximately 200×150 meters at 6 hours to 60×40 meters at 72 hours as meteorological diversity accumulates.
- Figure 5: Receiver operating characteristic (ROC) curves from simulation experiments at device densities of 5, 10, 20, and 50 devices per square kilometer, for leak rates of 0.1, 1.0, and 10 kg/hr, showing that area under curve (AUC) exceeds 0.90 for leaks above 1 kg/hr at device densities above 10 per square kilometer, covering 65–80% of urban residential areas in early-adopter markets.
Claims
- A system for detecting underground natural gas distribution pipeline leaks, comprising: a plurality of consumer indoor air quality monitors, each containing a metal-oxide semiconductor gas sensor exhibiting cross-sensitivity to methane, ethane, and propane; a cloud-based data aggregation platform that receives timestamped volatile organic compound sensor readings from said monitors via manufacturer cloud application programming interfaces; an anomaly detection module that identifies devices exhibiting sustained elevated readings inconsistent with known indoor volatile organic compound sources; a spatial clustering module that groups anomalous devices by geographic proximity to identify candidate leak clusters; and an inverse dispersion modeling module that estimates the subsurface source location and emission rate by fitting a coupled soil gas transport and atmospheric dispersion model to the observed spatiotemporal concentration pattern across the device cluster using Bayesian inference.
- The system of claim 1, wherein the anomaly detection module estimates a per-device time-varying baseline using a Gaussian process model with periodic and Matérn kernel components trained on a rolling history of at least 14 days, and flags readings exceeding the baseline by more than 3 standard deviations for more than 30 continuous minutes as anomalous.
- The system of claim 1, wherein the spatial clustering module applies density-based spatial clustering (DBSCAN) with an epsilon radius of 100–300 meters and a minimum cluster size of 3 anomalous devices, reflecting the lateral extent of typical subsurface methane plumes from distribution leaks.
- The system of claim 1, further comprising an indoor source exclusion module that distinguishes gas leak infiltration from indoor volatile organic compound events by testing candidate clusters for: (a) sustained temporal profile inconsistent with episodic indoor sources, (b) statistically significant circular correlation between anomaly amplitude and wind direction, (c) negative correlation between anomaly amplitude and the time derivative of barometric pressure, and (d) positive correlation between anomaly amplitude and indoor-outdoor temperature differential consistent with stack effect-driven soil gas infiltration.
- The system of claim 1, wherein the inverse dispersion modeling module employs Markov Chain Monte Carlo sampling with the No-U-Turn Sampler to generate posterior probability distributions over source location coordinates, emission rate, effective soil diffusion coefficient, and soil gas advective velocity, using a forward model comprising a two-dimensional advection-diffusion equation for subsurface transport coupled with a Gaussian plume model for atmospheric dispersion and a building infiltration model parametrized by air exchange rate and sub-grade leakage fraction.
- The system of claim 1, wherein temporal variation in meteorological conditions over a multi-day observation window provides directional constraint on the source-to-sensor bearing analogous to synthetic aperture processing, enabling source geolocation from as few as three sensors observing multiple wind direction regimes over 48–72 hours.
- The system of claim 1, further comprising a calibration module that maintains model-specific transfer functions from raw metal-oxide semiconductor sensor readings to methane-equivalent concentration, calibrated through controlled laboratory exposure and refined through field calibration events when confirmed gas leaks are repaired by the utility and the resulting change in nearby sensor readings is observed.
- The system of claim 1, wherein the cloud-based data aggregation platform operates on anonymized device data, with each device assigned a pseudonymous identifier via a keyed hash-based message authentication code applied to the manufacturer device identifier, such that the leak detection platform never receives the real device identity.
- The system of claim 1, further comprising an alert delivery module that transmits classified leak alerts with geolocation confidence ellipses, estimated emission rate, and temporal diagnostic data to gas utility integrity management systems via geographic information system-compatible formats for integration with existing leak survey and dispatch workflows.
- A method for detecting and geolocating underground natural gas pipeline leaks using a network of consumer indoor air quality monitors, comprising: receiving timestamped volatile organic compound sensor readings from a geographically distributed plurality of consumer air quality monitors containing metal-oxide semiconductor gas sensors; estimating a per-device temporal baseline of normal indoor volatile organic compound levels and identifying anomalous sustained elevations above said baseline; clustering geographically proximate anomalous devices and testing each cluster for meteorological correlation signatures diagnostic of outdoor subsurface gas infiltration; fitting an inverse coupled soil-atmosphere transport model to the spatiotemporal pattern of anomalous readings across the cluster using Bayesian inference to estimate the source location with uncertainty bounds; and transmitting a geolocation alert to the responsible gas utility when the posterior probability of a leak source within the cluster region exceeds a configurable confidence threshold.
- The method of claim 10, wherein the meteorological correlation signatures tested for each cluster include: wind direction correlation of anomaly amplitude with a statistically significant peak-concentration bearing consistent across cluster devices, negative barometric pressure derivative correlation indicating soil gas pressure-driven infiltration, and stack effect temperature differential correlation indicating ground-level negative-pressure-driven entry consistent with sub-grade source pathways.
- The method of claim 10, further comprising continuous refinement of the geolocation estimate as additional observation time accumulates, with each new meteorological regime (wind direction shift, pressure system passage, temperature swing) providing additional constraint on the inverse transport model, reducing the 95% confidence ellipse area at a rate approximately proportional to the square root of the number of independent meteorological state transitions observed.
- The method of claim 10, further comprising application of calibrated Laplace noise to individual device readings before spatial clustering to achieve ε-differential privacy for participating device owners, with the noise calibration selected to maintain leak detection sensitivity above a specified area-under-curve threshold on the receiver operating characteristic.
Implementation Notes
The system can be implemented as a cloud analytics service with no hardware deployment. The primary integration requirement is authenticated API access to consumer air quality monitor cloud platforms, which can be obtained through data partnership agreements with device manufacturers or through consumer-authorized OAuth flows (the Awair, Airthings, and PurpleAir APIs all support OAuth 2.0 device authorization). The system operator (which may be a gas utility, a pipeline integrity management vendor, or a third-party analytics provider) does not need to interact with individual consumers or install any equipment.
Estimated coverage: at current installed base densities, consumer air quality monitors achieve 10+ devices per square kilometer in affluent urban neighborhoods of major metropolitan areas (San Francisco Bay Area, Boston, New York, Seattle, Portland, Denver, London, Amsterdam). These are precisely the neighborhoods with the oldest gas distribution infrastructure (pre-1970 cast iron and bare steel mains are concentrated in densely built urban cores) and the highest device adoption rates. For a city like Boston, where Phillips et al., Environmental Science & Technology 2013 mapped over 3,300 distribution leaks within city limits, an estimated 5,000–15,000 consumer air quality monitors are active within the distribution system footprint, providing average inter-device spacing of 100–200 meters in residential neighborhoods.
The principal technical risk is the low signal-to-noise ratio for small leaks at large distances from the nearest monitor. A 0.1 kg/hr leak (the lower end of detectable distribution leaks) produces indoor methane enhancements of only 1–10 ppm at 50 meters distance in permeable soils, generating MOX signals of 2–10 VOC index units above baseline. This is detectable only when the device baseline is stable (low indoor VOC activity) and the meteorological conditions favor infiltration. Detection latency for small leaks may extend to 1–4 weeks as the system accumulates sufficient statistical evidence from multiple meteorological cycles. This performance represents a substantial improvement over the 1–5 year survey interval for regulatory walking surveys but falls short of dedicated continuous monitoring for safety-critical installations (hospitals, schools, high-rise buildings), which should retain dedicated methane sensors regardless of crowdsourced monitoring availability.
Prior Art References
- PHMSA Annual Report to Congress, Pipeline Safety, 2024 — US gas distribution infrastructure statistics and incident data
- EPA Greenhouse Gas Inventory, 2024 — Methane emission estimates from natural gas distribution systems
- IPCC Sixth Assessment Report, Working Group I, 2021 — Methane global warming potential (100-year and 20-year horizons)
- Alvarez et al., Science 2018 — Assessment of methane emissions from the U.S. oil and gas supply chain, demonstrating actual emissions 60% above EPA inventory estimates
- Weller et al., Applied Energy 2021 — Leak rates from aging cast iron and bare steel distribution mains versus modern replacement materials
- Von Fischer et al., Environmental Science & Technology 2019 — Mobile methane survey results across 13 US cities, establishing distribution leak population estimates and emission rate distributions
- Ackley et al., Environmental Science & Technology 2020 — Subsurface methane migration from distribution leaks to building interiors, transport mechanisms, and indoor concentration measurements
- Nazaroff, Building and Environment 2015 — Indoor air pollutant entry mechanisms through building foundation pathways (cracks, joints, utility penetrations, sewer connections)
- Lebel et al., Environmental Science & Technology 2022 — Measured indoor methane enhancements in residences near confirmed distribution leaks in the Boston metropolitan area
- Phillips et al., Environmental Science & Technology 2013 — Mapping of 3,300+ distribution leaks within Boston city limits
- Sensirion Application Note: VOC Index — SGP40 MOX sensor operating principles, cross-sensitivity characterization, and VOC index algorithm description
- 49 CFR § 192.723 — Federal leak survey requirements for natural gas distribution pipeline operators
- Iowa Environmental Mesonet — ASOS 1-Minute Data — High-resolution surface weather observation data for wind direction and barometric pressure correlation
- Picarro — Vehicle-mounted cavity ring-down spectrometer systems for methane survey (representative of current survey technology)
- US10928371B2 — Method and system for detecting gas leaks using infrared imaging (contrast: imaging-based vs. crowdsourced chemical sensing)
- US11187628B2 — Methane leak detection system using distributed sensors and machine learning (contrast: dedicated sensor hardware vs. repurposed consumer devices)