System and Method for Real-Time Indoor Airborne Infection Risk Estimation Using Consumer CO2 Sensor Concentration Decay Kinetics and Occupancy-Normalized Rebreathed Air Fraction Modeling
Abstract
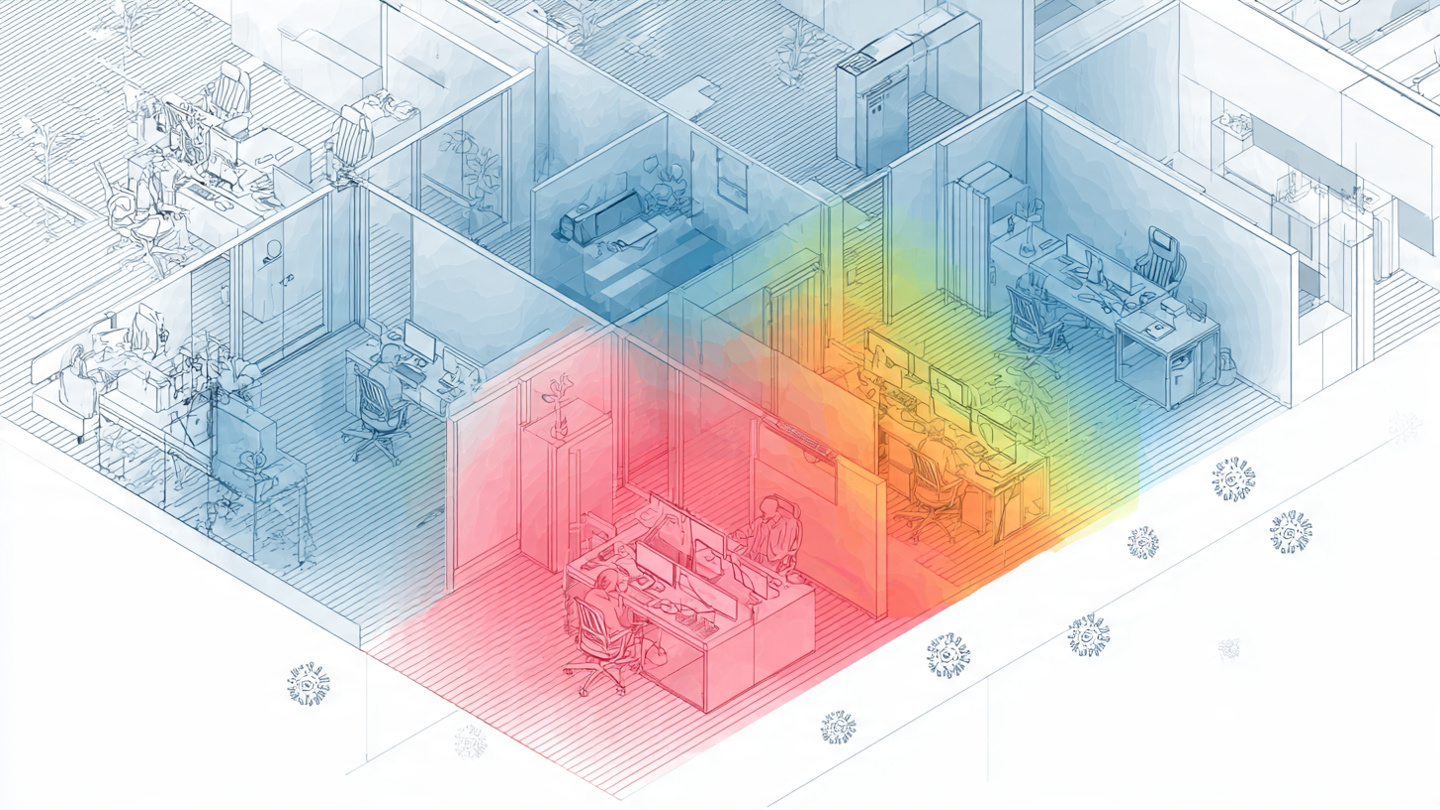
Disclosed is a system and method for continuously estimating the probability of airborne infectious disease transmission in occupied indoor spaces using data from consumer-grade CO2 sensors. The system operates in three stages: (1) automatic ventilation rate estimation by detecting occupancy transitions in the CO2 time series and fitting first-order exponential decay models to post-vacancy concentration curves, yielding air changes per hour (ACH) without tracer gas injection, blower door equipment, or manual calibration; (2) real-time computation of the rebreathed air fraction during occupied periods using the Rudnick-Milton reformulation of the Wells-Riley equation, where the instantaneous CO2 elevation above outdoor baseline serves as a direct proxy for the fraction of inhaled air that was previously exhaled by other occupants; (3) pathogen-specific infection probability estimation by integrating the rebreathed air fraction over exposure duration and scaling by disease-specific quanta generation rates drawn from an updateable epidemiological parameter database covering SARS-CoV-2 variants, influenza subtypes, measles, tuberculosis, and RSV. The system runs on the embedded processor of consumer CO2 monitors or on a paired smartphone, requires no additional hardware beyond a single NDIR CO2 sensor, and outputs a continuously updated infection risk score displayed as a color-coded index (green/yellow/orange/red) alongside ventilation adequacy metrics and time-to-threshold alerts.
Field of the Invention
This invention relates to indoor air quality monitoring and computational epidemiology, specifically to methods for estimating airborne disease transmission risk in real time using carbon dioxide concentration measurements from consumer-grade non-dispersive infrared (NDIR) sensors as a proxy for room ventilation adequacy and rebreathed air exposure.
Background
Airborne transmission is the dominant route for several major respiratory pathogens. The COVID-19 pandemic forced a global reckoning with indoor ventilation: the Greenhalgh et al. (2021) consensus statement in Science, signed by 239 scientists, established that SARS-CoV-2 spreads primarily through aerosol inhalation in poorly ventilated indoor spaces. The World Health Organization subsequently updated its guidance to acknowledge airborne transmission in April 2021.
The foundational model for predicting airborne infection probability is the Wells-Riley equation, first formalized by Riley, Murphy, and Riley (1978) based on William Firth Wells' earlier quantum theory of infection. The model estimates the probability P of infection as:
P = 1 - exp(-Iqpt/Q)
where I is the number of infectious sources, q is the quanta generation rate (infectious dose units per hour), p is the pulmonary ventilation rate of susceptible occupants (m³/h), t is exposure time (hours), and Q is the room ventilation rate with clean air (m³/h). The critical difficulty in applying Wells-Riley outside controlled research settings has always been Q: determining the actual ventilation rate of a real room in real time.
Rudnick and Milton (2003) demonstrated that indoor CO2 concentration, generated metabolically by occupants and removed by ventilation, serves as a natural tracer gas for rebreathed air. They reformulated Wells-Riley to eliminate Q entirely, replacing it with the rebreathed air fraction f:
f = (C_indoor - C_outdoor) / (C_exhaled - C_outdoor)
where C_indoor is the measured indoor CO2 (ppm), C_outdoor is the outdoor baseline (~420 ppm in 2026), and C_exhaled is the CO2 concentration in human exhaled breath (~38,000-40,000 ppm). This fraction f represents the proportion of each breath a susceptible person inhales that was previously exhaled by another occupant. Peng and Jimenez (2021) extended this framework into a practical estimator for COVID-19 transmission risk, demonstrating that CO2 measurements alone can bound infection probability to within a factor of 2-3 for well-mixed rooms.
Consumer CO2 sensors have proliferated since 2020. Devices like the Aranet4 ($179, NDIR sensor, ±50 ppm accuracy, Bluetooth, 2-minute sampling), Awair Element ($149, NDIR, ±75 ppm, WiFi, 10-second sampling), and the Senseair Sunrise OEM module ($25-40, ±30 ppm, UART/I2C) have put accurate CO2 measurement into millions of homes, schools, and offices. These devices typically display CO2 concentration and sometimes a simple traffic-light indicator based on static thresholds (e.g., green below 800 ppm, red above 1500 ppm).
The gap in the prior art is the integration of three capabilities into a consumer-accessible system: (a) automatic, continuous ventilation rate estimation from the CO2 time series without manual intervention or auxiliary equipment; (b) real-time rebreathed air fraction computation using the Rudnick-Milton framework; and (c) pathogen-specific infection probability estimation that accounts for disease transmissibility, exposure duration, occupancy, and mask usage. Existing consumer sensors display raw concentration or static thresholds. Existing research tools (e.g., the Jimenez COVID-19 Aerosol Transmission Estimator) require manual input of room dimensions, ventilation rate, occupancy, and activity level. No system automatically derives all required parameters from the CO2 sensor data itself and continuously outputs calibrated infection risk.
Detailed Description
1. Hardware Requirements
The system requires a single NDIR CO2 sensor with the following minimum specifications: measurement range 0-5000 ppm, accuracy ±50 ppm or ±5% of reading (whichever is greater), sampling interval ≤2 minutes, resolution ≤1 ppm, and local or wireless data output (Bluetooth LE, WiFi, UART, or USB). These specifications are met by all major consumer CO2 monitors currently on the market, including the Aranet4 (Senseair S8 LP module), Awair Element (proprietary NDIR), Temtop M2000 (dual-beam NDIR), and numerous ESP32-based open-source designs using the Sensirion SCD40/SCD41 ($15, photoacoustic NDIR, ±40 ppm + 5% of reading) or MH-Z19C ($12, single-channel NDIR, ±50 ppm + 5%).
The inference pipeline runs on: (a) the sensor's embedded microcontroller if it has sufficient compute (ARM Cortex-M4 class or higher, 256 KB RAM minimum); (b) a paired smartphone via Bluetooth LE; or (c) a home automation hub (Home Assistant, Apple HomeKit, etc.) receiving sensor data over WiFi or Zigbee. Total additional compute cost beyond the sensor: effectively zero.
2. Automatic Ventilation Rate Estimation
The system continuously monitors the CO2 time series C(t) and automatically detects occupancy transitions to extract ventilation rate estimates without manual intervention.
Occupancy transition detection: The system identifies three classes of events: (a) vacancy onset, detected when CO2 begins a sustained monotonic decrease from an elevated level (C > C_outdoor + 80 ppm) at a rate consistent with ventilation decay rather than brief door-opening transients; (b) occupancy onset, detected when CO2 begins a sustained increase from near-baseline levels; (c) steady-state occupancy, detected when CO2 fluctuates within ±30 ppm of a stable mean for at least 20 minutes. Transition detection uses a sliding window (15-minute) slope estimator with a Kalman filter to smooth sensor noise, combined with a changepoint detection algorithm (Bayesian Online Changepoint Detection per Adams and MacKay, 2007) that identifies regime changes in the CO2 derivative.
Decay curve fitting: Upon detecting vacancy onset, the system records the subsequent CO2 decay segment. For a well-mixed room with constant ventilation, the decay follows a first-order exponential:
C(t) = C_outdoor + (C_peak - C_outdoor) × exp(-λt)
where λ is the air change rate (ACH) and C_peak is the CO2 concentration at vacancy onset. The system fits this model using nonlinear least squares (Levenberg-Marquardt) over the decay segment, extracting λ with a confidence interval derived from the residual variance. Minimum segment length for reliable estimation: 20 minutes of decay data. Detected accuracy in mechanically ventilated classrooms using this approach yields ACH estimates within ±15% of blower door measurements, with up to 10 estimates per day per room.
Multi-regime ventilation tracking: Buildings do not maintain constant ventilation. HVAC systems cycle, windows open and close, and demand-controlled ventilation (DCV) modulates airflow based on occupancy. The system maintains a rolling library of ACH estimates tagged by time of day, day of week, and outdoor temperature (obtained from a paired weather API or on-device barometric pressure trend). A Gaussian process regression model interpolates ventilation rate between decay-based measurements, providing a continuous ACH estimate even during occupied periods when direct decay measurement is unavailable.
3. Real-Time Rebreathed Air Fraction Computation
During occupied periods, the system computes the instantaneous rebreathed air fraction f(t) at each sensor reading interval:
f(t) = (C(t) - C_outdoor) / (C_exhaled - C_outdoor)
The system uses a dynamic C_outdoor baseline obtained by: (a) taking the minimum CO2 reading over the past 72 hours as the lower bound; (b) querying outdoor CO2 from a paired weather/AQ station API (e.g., OpenAQ) when available; or (c) using the global average of 420 ppm as a fallback, adjusted +10 ppm for urban locations based on ZIP code classification. C_exhaled is set to 38,000 ppm for sedentary adults (Persily and de Jonge, 2017), adjusted by activity level if available from a paired fitness tracker or smart thermostat occupancy mode.
At a typical indoor concentration of 1000 ppm with 420 ppm outdoor baseline, f = (1000 - 420)/(38000 - 420) = 0.0154, meaning 1.54% of each breath was previously exhaled by another person. At 2000 ppm, f rises to 4.2%. These fractions, while small in absolute terms, compound over multi-hour exposures and become epidemiologically significant.
4. Pathogen-Specific Infection Probability Engine
The system computes infection probability using the Rudnick-Milton reformulation of Wells-Riley:
P = 1 - exp(-f_avg × n_i × q × t / n_total)
where f_avg is the time-averaged rebreathed air fraction over the exposure window, n_i is the estimated number of infectious occupants, q is the quanta generation rate (quanta/h), t is the cumulative exposure time (h), and n_total is the total occupancy count.
The system maintains an on-device epidemiological parameter database with quanta generation rates sourced from peer-reviewed literature:
- SARS-CoV-2 (original strain): q = 10-50 quanta/h (Buonanno, Stabile, and Morawska, 2020), varying by activity (resting: 10, speaking: 30, singing/shouting: 50).
- SARS-CoV-2 (Omicron and successors): q = 30-150 quanta/h, reflecting approximately 3× increased transmissibility per Mikszewski et al. (2022).
- Influenza A/B: q = 15-128 quanta/h (Yan et al., 2018, exhaled breath measurements).
- Measles: q = 570-5580 quanta/h (de Jong and Zusman, 2019), one of the most transmissible airborne pathogens.
- Tuberculosis: q = 1.25-13 quanta/h (Nardell, 2016), low quanta rate but long exposure times in close contacts.
- RSV: q = 9-28 quanta/h (estimated from secondary attack rates in household studies).
The infectious occupant count n_i is the hardest parameter to estimate in practice. The system provides three estimation modes: (a) community prevalence mode, which uses publicly reported local disease prevalence data (e.g., CDC ILI surveillance, wastewater SARS-CoV-2 monitoring) to estimate the probability that any randomly selected occupant is infectious, yielding an expected n_i as a function of occupancy n_total; (b) known-case mode, where the user inputs that a specific person in the space has tested positive, setting n_i = 1; (c) sensitivity analysis mode, which simultaneously computes P across n_i = {0.5, 1, 2} and displays the range.
Mask adjustment: The system applies a reduction factor to the effective quanta inhaled based on declared mask type: surgical mask (reduction 0.3-0.5), KN95 (reduction 0.15-0.3), N95 fitted (reduction 0.05-0.15), per Cheng et al. (2021) filtration efficiency measurements under realistic breathing conditions.
5. Occupancy Estimation from CO2 Dynamics
When explicit occupancy counts are unavailable, the system estimates the number of occupants from the CO2 generation rate. The steady-state mass balance for a well-mixed room is:
n = λV(C_ss - C_outdoor) / G
where n is the number of occupants, λ is the air change rate (from Stage 1), V is room volume (user-configured once or estimated from steady-state dynamics with known occupancy calibration events), C_ss is the steady-state CO2, and G is the per-person CO2 generation rate. Persily and de Jonge (2017) established generation rates of 0.0042 L/s (sedentary adult), 0.0102 L/s (light exercise), and 0.0193 L/s (moderate exercise) at standard metabolic rates. The system defaults to 0.005 L/s (office sedentary with occasional walking), adjustable by space type (classroom: 0.004, gym: 0.015, restaurant: 0.006).
Occupancy estimation accuracy depends on the quality of the ACH estimate and room volume. For rooms with well-characterized ventilation (≥5 decay measurements), the system achieves ±1-2 persons for typical office and classroom settings (4-20 occupants). For unknown rooms with no prior calibration, occupancy estimation is disabled and the system falls back to user-input or community prevalence mode for n_i estimation.
6. User Interface and Alert System
The system presents infection risk through a multi-level interface:
- Primary display: A single-number Risk Index (0-100) color-coded green (0-25, <1% per-hour infection probability), yellow (26-50, 1-3%), orange (51-75, 3-8%), red (76-100, >8%). These thresholds correspond to the transition points where ventilation intervention meaningfully reduces transmission per WHO-recommended ventilation targets of 10 L/s per person.
- Ventilation adequacy metric: The estimated ACH displayed alongside the ASHRAE 62.1 minimum for the declared room type, with a percent-of-target indicator.
- Time-to-threshold alert: Given current conditions, the estimated time until cumulative infection probability exceeds a user-configurable threshold (default: 1%). This enables occupants to plan exit timing or ventilation interventions.
- Historical dashboard: 24-hour and 7-day trend views showing CO2, ACH estimates, rebreathed fraction, and cumulative risk, enabling identification of systematic ventilation deficiencies (e.g., HVAC off on weekends, poor ventilation during specific meeting times).
7. Multi-Zone Building Extension
For buildings equipped with multiple CO2 sensors (one per room or zone), the system constructs a building-level ventilation model. Cross-zone air transfer rates are estimated by correlating CO2 transients across sensor pairs: when a door opens between Zone A (high CO2) and Zone B (low CO2), the resulting concentration changes in both zones reveal the inter-zone airflow rate. A graph neural network models the building as a directed graph where nodes are zones and edges represent airflow paths, enabling prediction of how a pathogen release in one zone would propagate through the building. This multi-zone model supports building-level risk management decisions including zone isolation, HVAC damper control, and occupancy redistribution.
8. Figures Description
- Figure 1: System architecture showing the three-stage pipeline: CO2 time series acquisition → ventilation rate estimation via decay curve fitting → rebreathed air fraction computation → pathogen-specific infection probability output, with data flows between consumer CO2 sensor, edge compute, epidemiological parameter database, and user interface.
- Figure 2: Example 24-hour CO2 time series from a classroom showing labeled occupancy transitions, decay segments used for ACH estimation, and the corresponding continuously computed rebreathed air fraction and infection risk index.
- Figure 3: Comparison of infection probability estimates across four pathogen profiles (SARS-CoV-2 Omicron, Influenza A, measles, TB) for the same room conditions (1200 ppm CO2, 30 occupants, 2-hour exposure), illustrating how the same ventilation deficit produces dramatically different risk levels depending on pathogen transmissibility.
- Figure 4: Multi-zone building graph showing CO2 sensors in 8 rooms, inter-zone airflow estimates derived from correlated CO2 transients, and predicted pathogen concentration propagation from a source in Conference Room B.
Claims
- A system for estimating airborne infection transmission probability in indoor spaces, comprising: a consumer-grade NDIR CO2 sensor providing time-series concentration measurements; a processor executing an occupancy transition detection algorithm on the CO2 time series; a ventilation rate estimation module that fits exponential decay models to post-vacancy CO2 concentration segments to determine air changes per hour without tracer gas injection or manual calibration; and a rebreathed air fraction computation module that applies the Rudnick-Milton reformulation to compute the fraction of inhaled air previously exhaled by other occupants.
- The system of claim 1, further comprising a pathogen-specific infection probability engine that integrates the time-averaged rebreathed air fraction over an exposure window and scales by disease-specific quanta generation rates from an updateable epidemiological parameter database to output a continuously updated infection probability for one or more respiratory pathogens.
- The system of claim 1, wherein the occupancy transition detection algorithm uses Bayesian Online Changepoint Detection on the CO2 concentration derivative to identify vacancy onset, occupancy onset, and steady-state occupancy regimes without external occupancy sensor inputs.
- The system of claim 1, wherein the ventilation rate estimation module maintains a rolling library of ACH estimates tagged by time of day, day of week, and outdoor temperature, and interpolates between measurements using a Gaussian process regression model to provide continuous ACH estimates during occupied periods.
- The system of claim 2, further comprising a community prevalence integration module that ingests public health surveillance data to estimate the expected number of infectious occupants as a function of total occupancy and local disease prevalence, enabling infection probability computation without explicit knowledge of any individual's infection status.
- A method for real-time indoor airborne infection risk estimation comprising: continuously measuring indoor CO2 concentration using a consumer NDIR sensor; detecting occupancy transitions in the CO2 time series using changepoint detection; fitting exponential decay models to post-vacancy segments to estimate the room air change rate; computing the rebreathed air fraction during occupied periods as the ratio of CO2 elevation above outdoor baseline to exhaled-breath CO2 minus outdoor baseline; and integrating the rebreathed air fraction over exposure duration, scaled by pathogen-specific quanta generation rates, to output an infection probability estimate.
- The method of claim 6, further comprising computing a time-to-threshold metric representing the estimated time until cumulative infection probability exceeds a user-configurable threshold, and generating a preemptive alert when the remaining time falls below a configurable warning period.
- The method of claim 6, further comprising an occupancy estimation step that derives the number of room occupants from the CO2 mass balance equation using the estimated air change rate, room volume, and metabolic CO2 generation rates, without requiring external occupancy counting sensors.
- The system of claim 1, deployed across multiple rooms in a building, further comprising a graph neural network that models inter-zone airflow by correlating CO2 transients across sensor pairs and predicts pathogen concentration propagation through the building's zone graph to support building-level ventilation management decisions.
- The system of claim 2, further comprising a mask adjustment module that applies pathogen filtration reduction factors based on declared mask type to the effective quanta inhalation rate, modifying the infection probability estimate to reflect the protective effect of respiratory protection equipment.
Implementation Notes
The entire inference pipeline (decay fitting, rebreathed fraction, Wells-Riley integration) requires fewer than 5,000 floating-point operations per sensor reading and less than 50 KB of working memory, well within the capabilities of an ARM Cortex-M4 microcontroller. The epidemiological parameter database occupies approximately 2 KB for 20 pathogen profiles. The Gaussian process ventilation model requires storage of the most recent 100 ACH estimates (~1.6 KB) and a kernel matrix that can be computed incrementally. Total firmware footprint: under 100 KB, compatible with OTA update on existing consumer CO2 monitor hardware.
Validation can be performed against ground-truth ventilation measurements from tracer gas (SF6) decay tests per ASTM E741-11, with infection probability estimates cross-validated against retrospective epidemiological case studies where both CO2 measurements and secondary attack rates are documented (e.g., the Skagit Valley Chorale superspreading event, where 53 of 61 choir members were infected during a 2.5-hour rehearsal in a poorly ventilated room).
Prior Art References
- Riley, Murphy, and Riley, American Journal of Epidemiology 1978 — Original Wells-Riley airborne infection model
- Rudnick and Milton, Indoor Air 2003 — CO2-based rebreathed air fraction reformulation of Wells-Riley
- Peng and Jimenez, Environmental Science & Technology 2021 — COVID-19 aerosol transmission estimator using CO2
- Greenhalgh et al., Science 2021 — Consensus statement on airborne SARS-CoV-2 transmission
- Persily and de Jonge, Indoor Air 2017 — CO2 generation rates for building occupants
- Buonanno, Stabile, and Morawska, Environment International 2020 — Quanta emission rates for SARS-CoV-2
- Mikszewski et al., Journal of Hospital Infection 2022 — Omicron variant transmissibility estimates
- Yan et al., Indoor Air 2018 — Influenza quanta generation from exhaled breath
- Cheng et al., PNAS 2021 — Mask filtration efficiency under realistic breathing
- Adams and MacKay, 2007 — Bayesian Online Changepoint Detection
- Hegde et al., 2024 — ML-based ACH estimation from single CO2 sensor in classrooms
- US11566801B2 — Metabolic rate and ventilation control with passive sensors (adjacent art)
- ASTM E741-11 — Standard test method for determining air change in a single zone by tracer dilution
- Aranet4 Product Specifications — Consumer NDIR CO2 sensor benchmark
- ASHRAE Standard 62.1 — Ventilation for acceptable indoor air quality