System and Method for Quantifying Child Restraint Installation Tightness Using Smartphone Inertial Sensing and Structural Vibration Analysis
Abstract
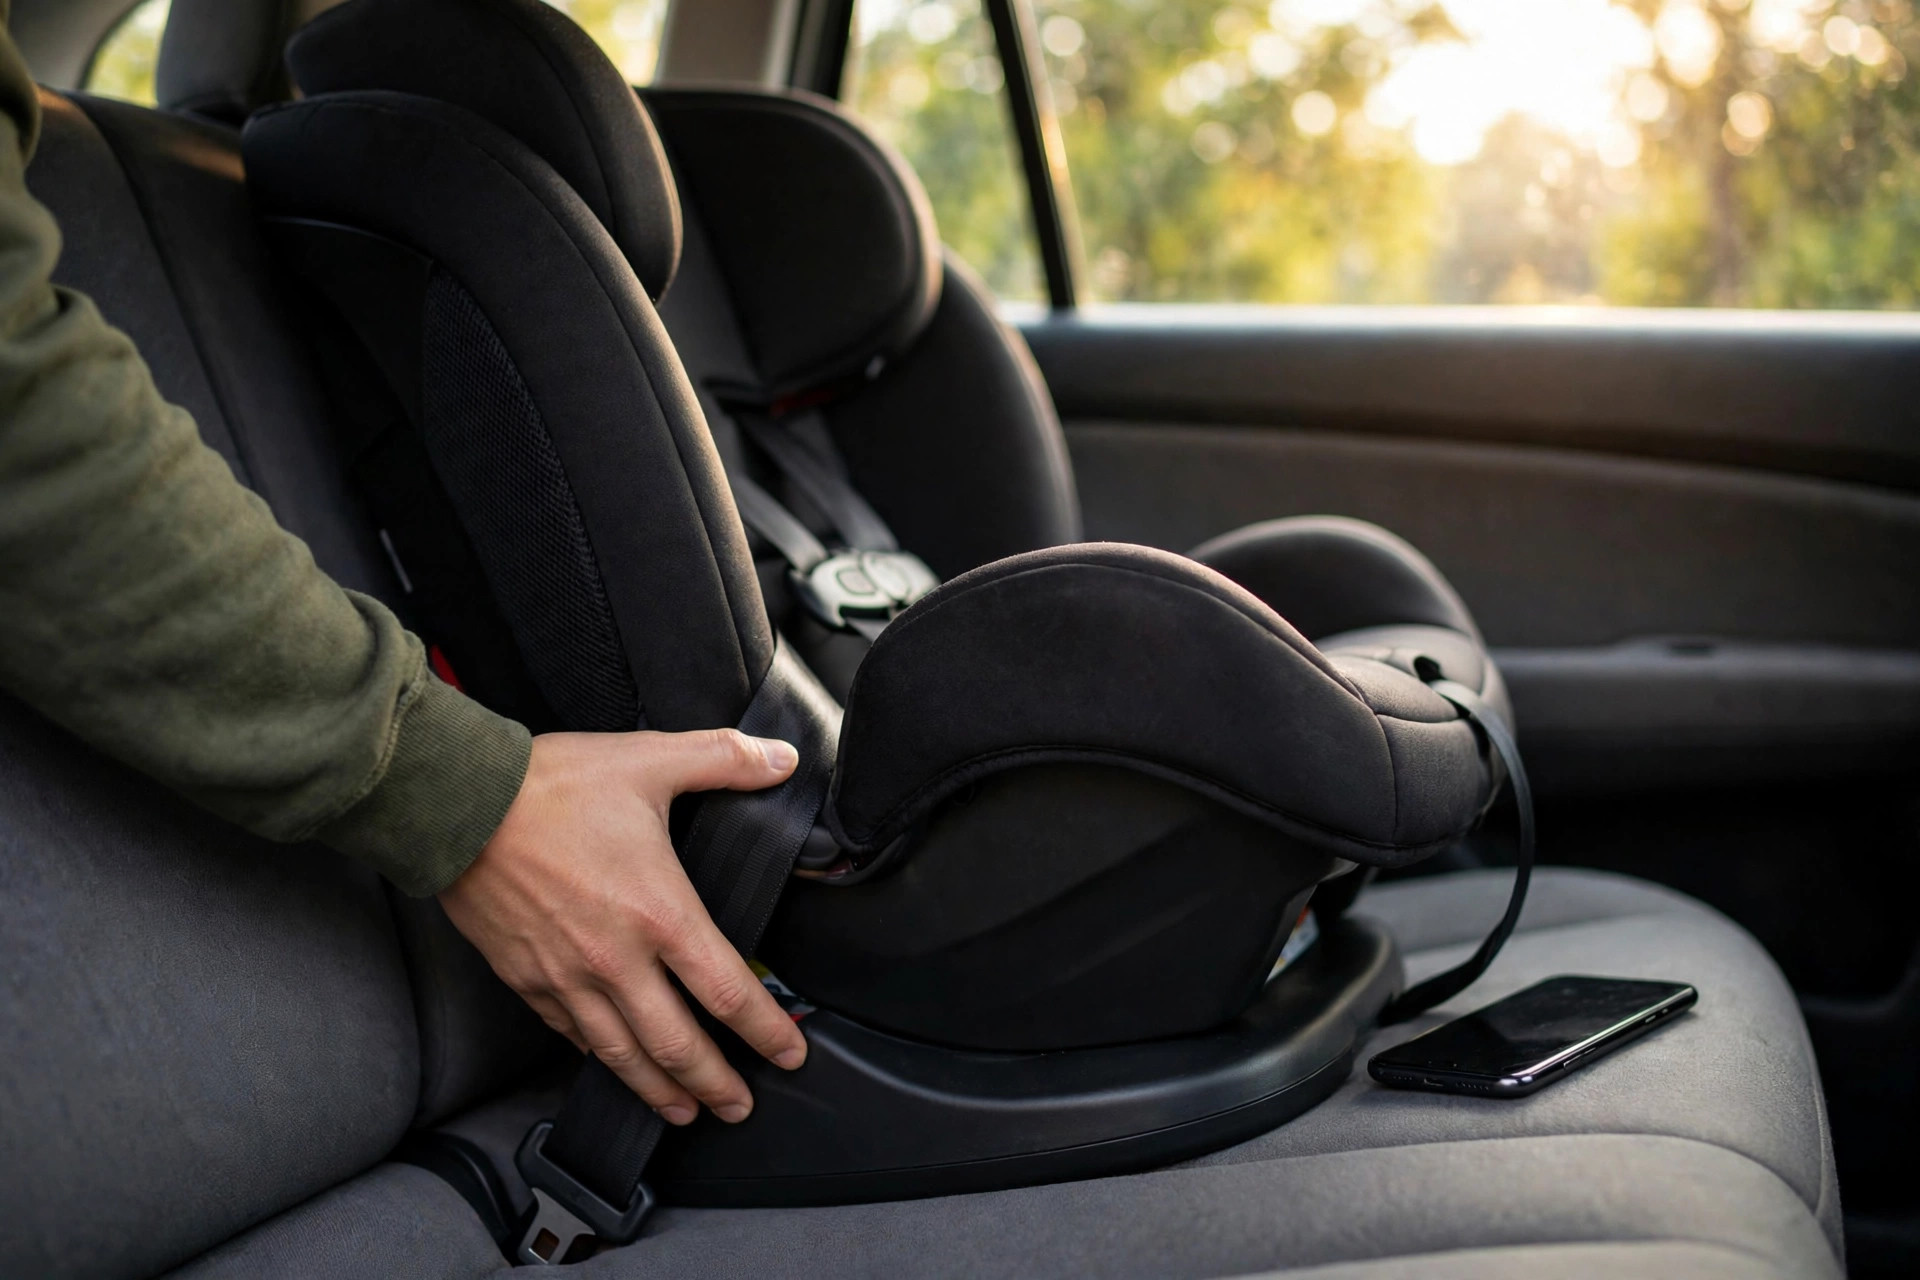
Disclosed is a system and method that turns an ordinary smartphone into a quantitative gauge of child restraint installation tightness. Three independent physical measurements run on the phone's existing sensors. First, a guided quasi-static push test: the user places the phone on the restraint at the belt path and applies a controlled lateral push, while the accelerometer records the resulting displacement; measured travel is compared against the 25.4 mm (1 inch) belt-path movement limit taught in Child Passenger Safety Technician curricula. Second, a tap-test modal analysis: a tap to the restraint shell excites structural resonance, and the phone extracts the dominant natural frequency and damping ratio from the ring-down, using both as stiffness proxies that separate tight installations from loose ones. Third, an acoustic pluck test for seat-belt installations: the microphone captures the fundamental frequency of a plucked span of belt webbing, and the classical vibrating-string relation converts that pitch into belt tension. Installation-type-specific baselines (LATCH versus seat belt, rear-facing versus forward-facing) calibrate every measurement, a composite score fuses the three modalities, and repeated tests over months detect loosening long before it becomes dangerous. Each session produces a timestamped evidence packet a technician can review remotely, and the system guides corrective re-tightening through a retest loop. No hardware beyond the phone is required.
Field of the Invention
This invention relates to child passenger safety, specifically to quantitative verification of child restraint installation tightness using inertial and acoustic sensors in consumer smartphones.
Background
Motor vehicle crashes remain one of the leading causes of death for children in the United States. NHTSA reports that child restraints reduce the risk of fatal injury by 71 percent for infants and 54 percent for toddlers in passenger cars, which makes correct installation one of the most effective safety interventions available to any parent.
Observational studies keep finding the same uncomfortable pattern: a large share of inspected restraints contain at least one form of misuse, and a loose installation ranks among the most common critical errors. Every Child Passenger Safety Technician teaches the same field check: grasp the restraint at the belt path and confirm it moves no more than one inch side to side or front to back. That check is sound. Its execution is not. Two caregivers can tug the same seat and reach opposite verdicts, and nobody writes the result down.
Existing aids narrow the gap without closing it. Many restraints ship with bubble recline indicators, and several designs include mechanical belt-tensioning aids built into the base. Both are per-product, qualitative, and silent about the actual number that matters: how far the seat travels under load. Inspection stations staffed by certified technicians give authoritative answers, but appointments are scarce, and a seat verified in March can work loose by August without anyone noticing.
Smartphones already serve as credible vibration instruments: UC Berkeley's MyShake network has demonstrated that phone accelerometers can record earthquake waveforms well enough for seismology, which sets a useful lower bound on what the same sensors can resolve in a parked car. What does not exist is a unified, quantitative, phone-based protocol that measures installation tightness directly, calibrates against installation type, and keeps a dated record. This disclosure fills that gap.
Detailed Description
1. System Overview and Measurement Protocol
A complete verification session runs as a guided protocol inside a smartphone application and needs no accessory hardware. Users declare the installation type (LATCH or seat belt), the restraint orientation (rear-facing or forward-facing), and the restraint model from a local library. From there, the application walks through up to three measurement modalities in sequence: the quasi-static push test, the tap-test modal analysis, and, for seat-belt installations, the acoustic webbing pluck test. Results fuse into a composite installation integrity score on a 0 to 100 scale, accompanied by per-modality margins and a pass, marginal, or fail verdict anchored to the 25.4 mm belt-path criterion.
2. Quasi-Static Push Test: Displacement Measurement
The phone rests face-down on the restraint shell at the belt path, positioned with an on-screen overlay that uses the camera to confirm placement. After a three-second stillness calibration that captures accelerometer bias and the gravity vector, the application prompts the user to apply a firm lateral push through the phone with the heel of the hand, hold for one second, and release. Sampling the triaxial accelerometer at 100 Hz or higher, the system subtracts gravity, high-pass filters the residual at 0.5 Hz to suppress integration drift, and double-integrates to recover displacement along the push axis. Zero-velocity updates at the stillness intervals before and after the push bound the drift further, a technique borrowed from pedestrian inertial navigation. Peak displacement during the loaded interval is the headline number: at or below 25.4 mm the installation passes this modality, above it the installation fails, and the margin is reported in millimeters either way. Because a single hard shove is operator-dependent, the protocol repeats the push three times and reports the median, discarding trials where the peak applied acceleration falls outside a plausible band. Fore-aft pushes run as an optional second axis, and the gyroscope captures yaw rotation for installations that pivot around a single tight anchor.
3. Tap-Test Modal Analysis
A fingertip tap to the restraint shell excites its structural modes, and a tightly coupled restraint rings differently from a loosely coupled one. With the phone held against the shell or resting on it, the accelerometer (sampled at 1 kHz or above where the hardware allows, otherwise the 44.1 kHz microphone) records the ring-down. A Hann-windowed FFT of the first 500 ms isolates the dominant natural frequency; fitting an exponential envelope to the decaying peaks yields the damping ratio through the logarithmic decrement. Tight installations exhibit higher natural frequency, because system stiffness rises, and lower damping ratios, because loose joints and rattling interfaces dissipate energy. Each installation type carries its own baseline band learned from reference measurements: LATCH installations couple through rigid anchors and ring higher than belt installations of the same seat, and forward-facing restraints, braced against the vehicle seatback, ring higher than rear-facing ones. A measurement that falls below its band by more than a calibrated margin flags a loose installation even when the push test is borderline, which makes the tap test a useful second opinion rather than a mere repeat.
4. Acoustic Belt Webbing Pluck Test
For seat-belt installations, belt tension is directly measurable from sound. During the pluck test, the user plucks an exposed span of the vehicle belt webbing near the latch plate while the phone's microphone records at 44.1 kHz. A plucked span's fundamental frequency follows the classical vibrating-string relation f = (1/2L) * sqrt(T/mu), where L is the free span length, T is the tension, and mu is the linear mass density of the webbing. With L measured by the user against an on-screen ruler (or estimated from the restraint model library) and mu treated as a webbing constant measured once per webbing specification during bench calibration, the system solves for T. Bench calibration maps tension to installation quality: a properly tightened belt installation holds webbing tension well above the slack baseline, while a loose routing produces a dull low thud instead of a clear tone. Recordings without harmonic structure get rejected, which indicates a damped or obstructed span rather than a clean pluck.
5. Installation-Type Baseline Models
Every measurement is interpreted against baselines specific to the declared installation type, because a number that signals danger in one configuration is normal in another. Prior bands for the four common configurations (LATCH rear-facing, LATCH forward-facing, belt rear-facing, belt forward-facing) ship with the application, derived from reference installations verified by certified technicians, and the application refines those bands on-device as the user logs repeat sessions. Transfer across restraint models is handled conservatively: unknown models start with wide bands and a provisional label until enough sessions narrow them. No measurement ever leaves the phone unless the user opts into sharing anonymized aggregates.
6. Composite Installation Integrity Score
Three modalities fuse into a single 0 to 100 installation integrity score. Displacement carries the largest weight, because it measures the regulated quantity directly; modal analysis and webbing tension contribute as corroborating evidence, with weights that shift when a modality is unavailable (booster seats, for example, skip the pluck test when no exposed webbing span exists). Fusion stays deliberately transparent: the application shows each modality's sub-score and margin, so a failing verdict always arrives with a reason, not just a number. Thresholds map to plain verdicts: 80 and above is a pass, 60 to 79 is marginal with retest recommended within a week, and below 60 is a fail with guided correction.
7. Longitudinal Loosening Detection
Installations loosen. Webbing creeps under cyclic loading, LATCH connectors settle into cushion foam, and temperature swings change belt tension across seasons. Because each session is timestamped and stored locally, the application trends every metric over time and flags statistically significant drift: a displacement series climbing toward the 25.4 mm limit, a natural frequency sagging quarter over quarter, or a webbing tension decaying after summer heat. Alerts fire before the limit is crossed, not after, which converts the system from a one-time checker into a maintenance reminder. Seasonal reminders prompt retests after long road trips and at the start of winter, when heavy coats change how children fit the harness (a separate misuse axis the system does not measure, and says so).
8. Guided Corrective Feedback and Retest Loop
A fail verdict is only useful if it teaches. When displacement fails on the lateral axis, the application animates the specific correction: kneel into the restraint to compress the vehicle cushion while pulling the LATCH strap or belt tail, then retest. When the modal test fails but displacement passes, the guidance targets secondary looseness: check the top tether, confirm the recline foot is locked, verify the belt lockoff is engaged. Each correction is followed by an immediate retest of the failed modality, and the loop continues until the composite score passes or the user escalates to an in-person inspection. It never declares an installation safe in absolute terms; the application reports measured compliance with the belt-path criterion and states plainly what it cannot verify, including harness snugness, chest clip position, and recline angle.
9. Evidence Packet Generation
Every session compiles a timestamped evidence packet: the installation type declaration, per-trial displacement traces, the tap-test spectrum with extracted frequency and damping values, the pluck recording spectrogram where applicable, the composite score with sub-scores, and a photograph of the installed restraint captured in-app. Each packet exports as a single PDF a Child Passenger Safety Technician can review asynchronously, which extends the reach of scarce inspection capacity: a technician can triage ten packets in the time one in-person check consumes, and reserve appointments for the ambiguous cases. Packets carry no location data, and the photograph is optional and framed to show the restraint rather than the occupant.
10. Figures Description
- Figure 1: Phone placement at the belt path with push direction arrows and measurement axis definitions for lateral, fore-aft, and yaw compliance.
- Figure 2: Example displacement time series showing stillness, push, hold, and release intervals, with the 25.4 mm threshold line and the median-of-three-trials computation.
- Figure 3: Tap-test ring-down waveform with FFT inset showing the dominant natural frequency peak and the exponential envelope fit used for damping ratio extraction.
- Figure 4: Webbing pluck spectrogram with fundamental and harmonic peaks labeled, and the vibrating-string tension relation annotated with measured span length.
- Figure 5: Longitudinal trend chart showing displacement creeping toward the limit across six months of sessions, with the pre-limit alert firing before the threshold is crossed.
Claims
- A system for quantifying child restraint installation tightness, comprising: a smartphone having a triaxial accelerometer and a processor; an application executing a guided quasi-static push test protocol in which the smartphone is placed on the restraint at the belt path and a user applies a controlled lateral push; a displacement computation module that removes gravity, filters, and double-integrates the accelerometer signal with zero-velocity updates to recover peak displacement; and a verdict module that compares the peak displacement against a 25.4 mm threshold and reports a pass, marginal, or fail determination with a millimeter margin.
- A system as in claim 1, wherein the push test protocol repeats the push a plurality of times and reports the median peak displacement, discarding trials whose peak applied acceleration falls outside a plausible band.
- A method for assessing child restraint installation tightness via modal analysis, comprising: recording a structural ring-down following a tap to the restraint shell using a smartphone accelerometer or microphone; extracting a dominant natural frequency via Fourier analysis and a damping ratio via logarithmic decrement envelope fitting; and classifying the installation as tight or loose by comparing the extracted values against installation-type-specific baseline bands, wherein higher natural frequency and lower damping ratio indicate tighter coupling.
- A method as in claim 3, wherein the installation-type-specific baseline bands distinguish LATCH-anchor installations from seat-belt installations and rear-facing orientations from forward-facing orientations, with bands refined on-device from repeat sessions.
- A method for estimating seat-belt webbing tension in a child restraint installation, comprising: recording an acoustic pluck of an exposed webbing span with a smartphone microphone; identifying the fundamental frequency of the span; and solving the vibrating-string relation for tension using the span length and the webbing linear mass density, wherein tension below a calibrated threshold indicates a loose belt routing.
- A system as in claim 1, further comprising a composite scoring module that fuses displacement, modal, and webbing-tension sub-scores into a single installation integrity score with per-modality margins displayed to the user.
- A system as in claim 1, further comprising a longitudinal trending module that stores timestamped session metrics locally and generates a pre-limit alert when a metric drifts toward its failure threshold across sessions.
- A system as in claim 1, further comprising a guided correction module that maps each failed modality to a specific re-tightening instruction animation and re-executes the failed measurement in a retest loop until the composite score passes or the user escalates to in-person inspection.
- A system as in claim 1, further comprising an evidence packet generator that compiles the installation declaration, sensor traces, extracted metrics, scores, and an optional restraint photograph into a timestamped exportable document for asynchronous review by a certified technician.
- A method for multi-axis installation compliance measurement, comprising: measuring lateral displacement via a lateral push test; measuring fore-aft displacement via a fore-aft push test; and measuring yaw rotation via a smartphone gyroscope during asymmetric loading, wherein the lateral, fore-aft, and rotational compliances are reported independently against axis-specific thresholds.
Prior Art References
- NHTSA: Car Seats and Booster Seats: child restraints reduce fatal injury risk by 71% (infants) and 54% (toddlers) in passenger cars
- FMVSS No. 213, 49 CFR 571.213: Federal child restraint systems standard
- American Academy of Pediatrics, "Child Passenger Safety," Pediatrics 2018: policy statement on restraint selection and correct use
- Safe Kids Worldwide: Child Passenger Safety Technician Certification: technician training and inspection station program
- Logarithmic Decrement: damping ratio extraction from decaying oscillation envelopes
- Mersenne's Laws: vibrating-string frequency, tension, length, and mass relations
- MyShake, UC Berkeley Seismology Laboratory: smartphone accelerometers as calibrated vibration instruments
- Inertial Navigation System: double-integration drift and zero-velocity update correction
- Modal Analysis: natural frequency and damping as stiffness and coupling indicators
- Child Safety Seat: restraint types, installation methods, and documented misuse patterns
Implementation Notes
Build notes for whoever implements this. Accelerometer sampling at 100 Hz suffices for the push test; the tap test wants 1 kHz or better, which many phone IMUs cannot sustain, so the microphone path (44.1 kHz) is the practical default for modal work and the accelerometer path is a fallback. Double-integration drift is the dominant error source in the push test: keep pushes under two seconds, enforce the stillness calibration, and high-pass aggressively, because a 0.01 m/s² bias integrates to 20 mm of phantom displacement in two seconds. Vehicle cushion compliance is the dominant confound overall: the system measures restraint-plus-cushion compliance, so baselines must be learned per vehicle seat or interpreted as relative change, and the application says this on first run. Phone placement variability is handled by the camera overlay; a 5 cm placement error shifts modal readings more than displacement readings, which is one more reason the displacement test carries the most weight. Harness snugness, chest clip position, recline angle, and restraint expiration stay outside what the system measures: the evidence packet lists these as unchecked items every session, because a passing belt-path score must never be mistaken for a fully verified installation.