System and Method for Bicycle Drivetrain Wear Assessment Using Acoustic Signature Analysis Fused with Pedaling Cadence
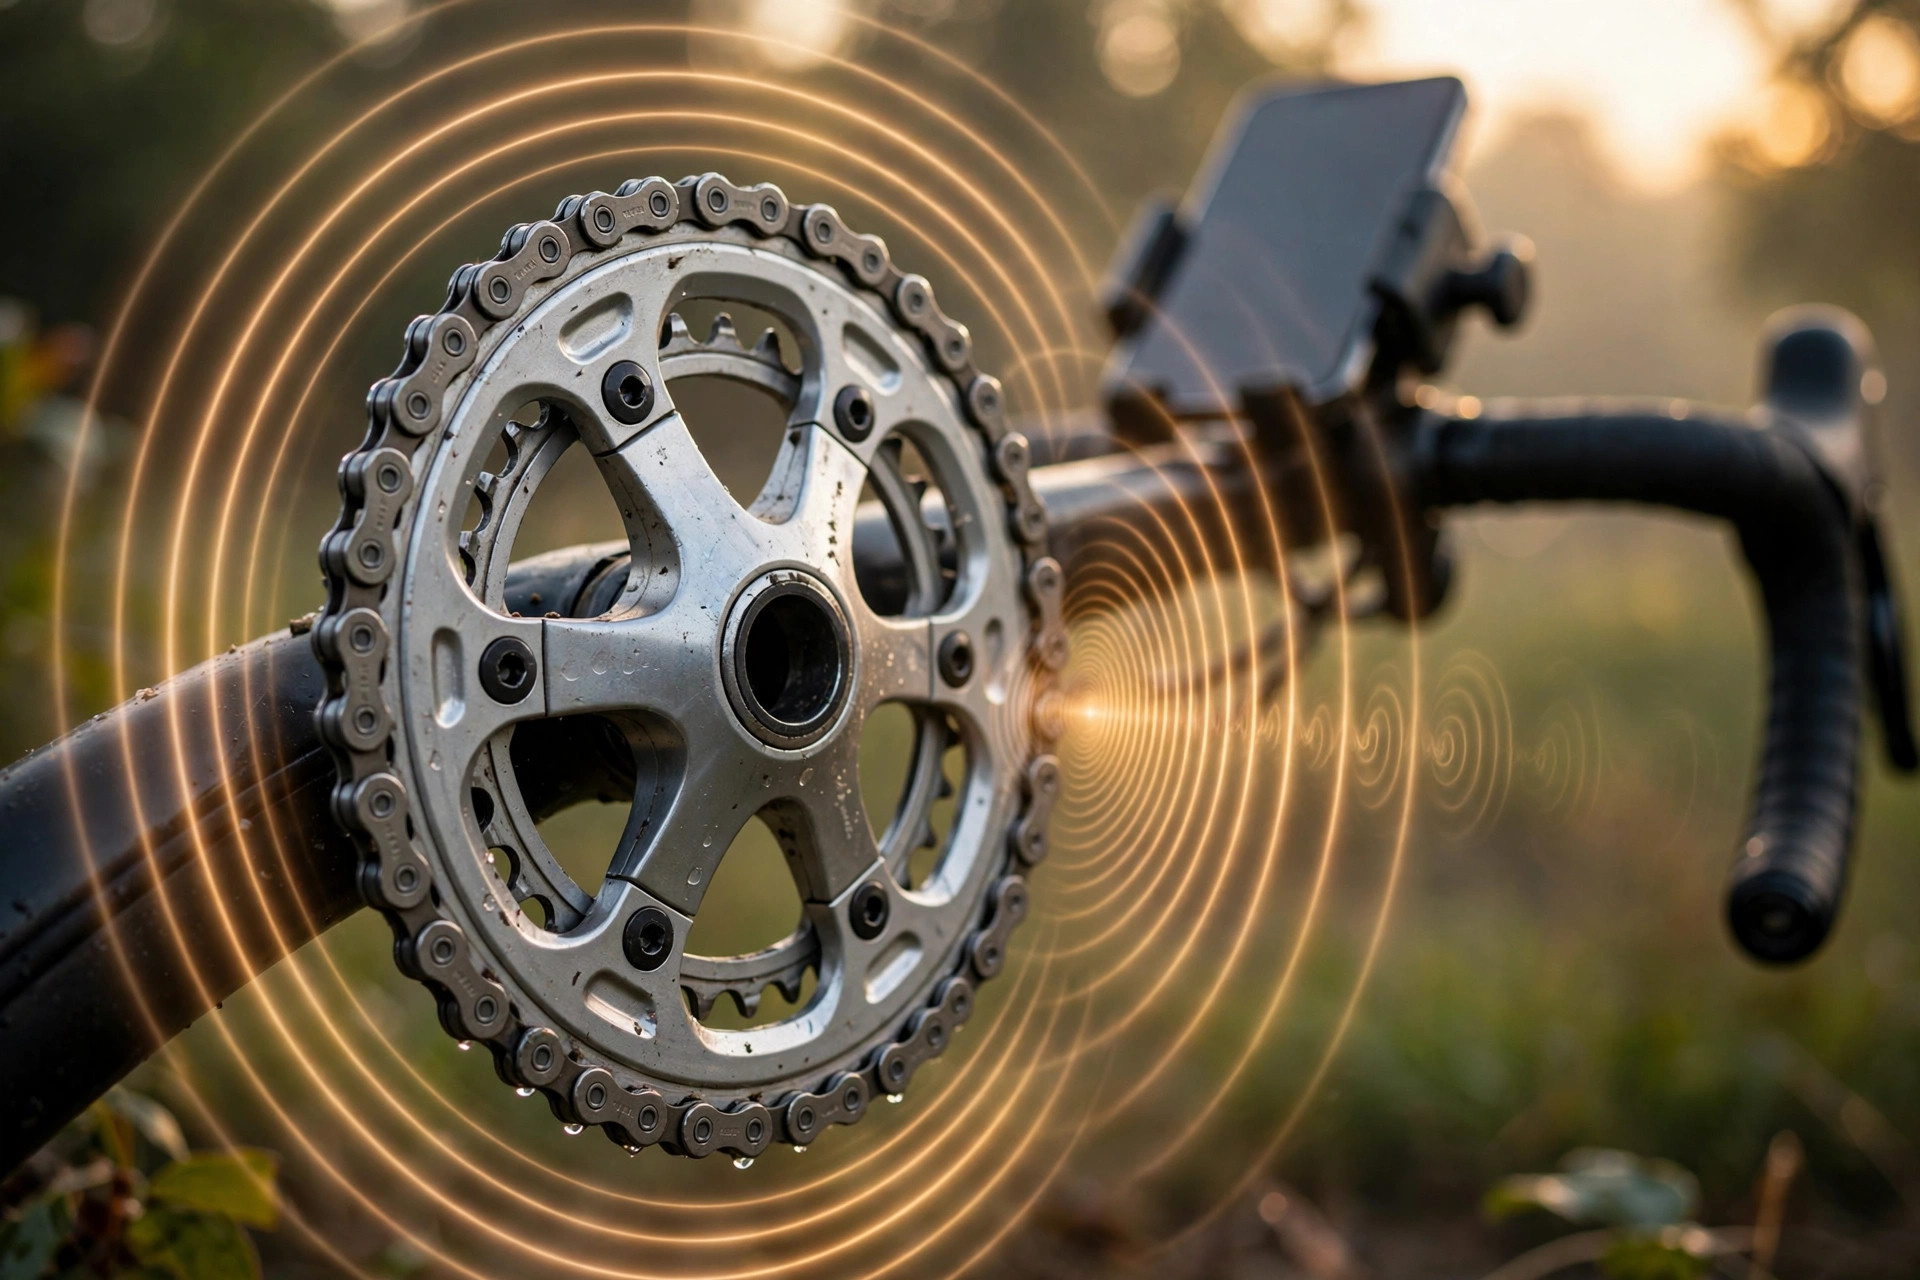
Your phone's microphone can hear your chain dying. This disclosure turns the phone already on your handlebars into a continuous chain-wear gauge, using cadence-anchored acoustic analysis: no installed hardware, no gauge, no shop visit.
Abstract
Disclosed is a system and method for assessing bicycle chain and drivetrain wear using acoustic signatures captured by a rider's smartphone, fused with pedaling cadence. A bicycle chain does not stretch; its pins and bushings wear, lengthening the effective pitch beyond the 12.7 mm standard until rollers seat late on sprocket teeth. Riders are advised to replace chains at 0.5% elongation (11- and 12-speed) or 0.75% (5- to 10-speed), yet almost no one measures often enough. A replacement chain costs $30-60; the cassette and chainring set a worn chain destroys costs $150-400 or more. The chain gauge works fine — the problem is it lives in the toolbox, not on the bike.
The disclosed system records drivetrain audio on the rider's phone, derives pedaling cadence from the phone's inertial sensors or a paired cadence sensor, and computes the chainring tooth-pass frequency (cadence multiplied by chainring tooth count) as the reference line of the drivetrain's acoustic signature. From the spectrum around that line the system extracts wear features: broadening and sideband growth of the tooth-pass engagement line as pitch error grows, elevated broadband chatter from worn rollers under load, and once-per-chain-revolution impulse trains from stiff links. An on-device classifier converts the feature vector into an elongation estimate, tracks it across rides, and issues replacement advisories at the established gauge thresholds, with trend projection and a safety flag for chainsuck (a worn chain jamming on the chainring and locking the drivetrain). No installed hardware is required beyond the phone the rider already carries.
Technical Field
This disclosure relates to bicycle maintenance, specifically to continuous assessment of chain and drivetrain wear using acoustic signature analysis on consumer mobile devices, fused with pedaling cadence to anchor the analysis to the drivetrain's mechanical frequencies.
Background
Bicycle chains wear from the inside out. Each link's pin and bushing lose material to grit and load, and the accumulated play lengthens the chain's effective pitch. A new chain measures 12.7 mm per link; at 0.5% elongation the average link has grown by 0.064 mm, enough that rollers no longer seat cleanly in the sprocket tooth valleys. The wear accelerates: a chain ridden past its limit reshapes the cassette and chainring teeth to match its elongated pitch, so a fresh chain then skips on the worn sprockets and the rider replaces the whole drivetrain. Chain gauges such as the Park Tool CC-2 and CC-4.2 give go/no-go readings at 0.5%, 0.75%, and 1.0% (the 1.0% mark serving single-speed chains), with manufacturer guidance to replace 11- and 12-speed chains at or before 0.5% and 5- to 10-speed chains at or before 0.75% (Park Tool CC-2 specifications).
The economics are lopsided. A replacement chain costs $30-60; a cassette and chainring set costs $150-400 or more on mid-range drivetrains. Checking wear takes seconds with a gauge, yet shop mechanics anecdotally report that most riders never check until shifting degrades or the chain starts skipping under load, by which point the expensive parts are already damaged. The failure mode with safety consequences is chainsuck: a worn, poorly articulating chain fails to release from the chainring at the bottom of the stroke, gets carried up and jams between ring and frame, locking the drivetrain, often with little warning to the rider.
The mechanics of chain drives are well studied. Spicer et al., Journal of Mechanical Design 2001 measured bicycle chain drive efficiency across power, speed, and lubrication conditions, finding that chain tension and sprocket size dominate losses and that efficiency sits in the 90-98% range depending on drivetrain condition. Acoustic and vibration condition monitoring is established practice for rotating machinery: acoustic emission analysis detects bearing faults from characteristic frequencies (Hidle et al., Sensors 2022), and audio-based inspection with machine learning reaches 96%+ fault detection accuracy on belt conveyor idlers (MDPI Sensors review, 2023). What the art lacks is the application of these methods to the bicycle drivetrain in a form riders will actually use: no one bolts an accelerometer to their bottom bracket, but nearly every rider carries a phone with a microphone and an IMU, and many already pair cadence sensors to bike computers.
The gap is a continuous, zero-installation wear assessment that: (a) captures drivetrain sound with hardware the rider already owns, (b) anchors the acoustic analysis to the drivetrain's true mechanical frequencies via measured cadence rather than assuming them, (c) separates wear signatures from wind, road, and freewheel noise, and (d) converts the result into the elongation percentages and replacement thresholds riders already understand.
Detailed Description
1. Sensing Configuration
The preferred embodiment is a smartphone in a handlebar or stem mount, placing the microphone 0.5 to 1.0 meters from the drivetrain with a mostly direct acoustic path. A jersey-pocket or hip-bag placement is supported with reduced signal-to-noise ratio. The phone records audio at 16 kHz (8 kHz Nyquist, covering the drivetrain's informative band below about 7 kHz) and inertial data at 100 Hz from the accelerometer and gyroscope. An optional Bluetooth cadence sensor or crank-based power meter supplies ground-truth crank RPM; without one, cadence is derived from the IMU as described in section 2. No sensor is attached to the bicycle itself.
2. Cadence Extraction and Drivetrain Kinematics
Pedaling produces a characteristic vertical oscillation of the rider-bike system at crank frequency. The IMU pipeline band-passes the vertical acceleration channel to 0.5-3.5 Hz (30-210 RPM), computes the autocorrelation, and takes the dominant lag as the crank period, yielding cadence fc in Hz. The design targets both the handlebar mount (frame-transmitted pedaling motion) and the pocket (body motion); neither placement has been validated empirically. When a BLE cadence sensor is paired, its reading supersedes the IMU estimate.
From cadence, the system derives the drivetrain's mechanical frequencies. The chainring tooth-pass (link engagement) rate is ftp = fc × Nring, where Nring is the chainring tooth count (user-entered once, or inferred as described in section 5). Chain speed follows as v = ftp × 0.0127 m. The chain revolution frequency is frev = v / Lchain, with Lchain = links × 0.0127 m, where the link count is entered by the rider once (116 links is typical for a road drivetrain). Worked example: at 90 RPM (1.5 Hz) on a 50-tooth ring, ftp = 75 Hz (75 roller-seating impacts per second), v = 0.95 m/s, and a 116-link chain (1.473 m) gives frev ≈ 0.65 Hz, so each link passes the chainring roughly every 1.5 seconds. These frequencies are the analysis's reference frame: every wear feature is measured relative to them, which is intended to keep the analysis consistent across gears, riders, and speeds, subject to empirical validation.
3. Acoustic Wear Features
Audio is analyzed in 4-second windows with 50% overlap, restricted to loaded pedaling segments (section 4). For each window the system computes a short-time Fourier spectrum and extracts four feature families:
Engagement line integrity. Each roller seating on a chainring tooth produces an impact; at ftp these sum to a narrowband line with harmonics. On a fresh chain the line is sharp: rollers seat at uniform pitch. As pitch error grows with wear, rollers seat progressively later around the ring's wrap arc, smearing impact timing and broadening the line while raising sidebands spaced at frev (the once-per-chain-revolution modulation of pitch error). The system tracks the line's Q factor (center frequency divided by 3 dB bandwidth) and the sideband-to-carrier ratio in a ±2 Hz band around ftp. Falling Q and rising sidebands are the primary elongation indicators.
Broadband chatter. Worn rollers and bushings have radial play that rattles under chain tension, raising the noise floor in the 2-7 kHz band during loaded pedaling relative to a per-rider baseline captured on a fresh chain, keeping the band clear of the 8 kHz Nyquist edge of the 16 kHz audio. The chatter index is the band power normalized by the engagement line power, which cancels out overall loudness differences between rides.
Stiff-link impulses. A link whose plates have corroded or gummed resists articulation and snaps through the chainring and derailleur pulleys once per chain revolution, producing an impulse train at frev. The detector applies a matched filter at the measured frev to the envelope of the 1-4 kHz band and flags periodic impulses exceeding 6 dB (amplitude, i.e., 2×) above the local envelope median. Stiff links are reported separately from elongation because a single stiff link warrants cleaning or replacement regardless of overall wear.
Chainsuck precursor. Before a full jam, a worn chain hesitates on release, producing irregular low-frequency thumps (80-300 Hz) phase-locked to crank rotation but aperiodic across revolutions. The system counts thump events per crank revolution over a ride; a rising trend triggers the chainsuck-risk flag, which is intended as a safety advisory rather than a maintenance suggestion (its reliability, like every parameter here, is untested).
4. Segment Gating and Noise Rejection
Only loaded, steady pedaling segments are analyzed. A segment qualifies when cadence stays within ±5% for at least 20 seconds and chain tension is present (no coasting). Coasting is detected two ways: cadence dropping to zero on the IMU, and the freewheel pawl-click signature, a distinctive 200-800 Hz buzz with pawl-pass periodicity, in the audio. Wind noise is rejected by discarding windows where sub-200 Hz power correlates with phone-reported speed (from GPS or IMU integration) above the drivetrain's expected contribution; the engagement line at 30-120 Hz typical ftp lies inside that wind band on a mounted phone, but its narrow bandwidth and exact cadence-locked frequency distinguish it from broadband wind noise. Gear changes are detected as step changes in the ftp-to-cadence ratio and blank a 3-second window around each shift.
5. Gear and Tooth-Count Inference
The ratio ftp/fc directly equals the engaged chainring's tooth count, quantized to the nearest integer. Over a ride the system observes the one to three chainring sizes the rider uses and stores them. The rear cog is not directly observable from audio, but it is not needed: elongation signatures are chainring-side phenomena and the chain's pitch error is independent of the selected cog. If the rider never enters tooth counts, the system self-calibrates the ring sizes within the first few rides and labels them Ring A/B/C.
6. On-Device Wear Classifier
The per-window feature vector (engagement line Q, sideband ratio, chatter index, stiff-link impulse strength, thump count, cadence, and segment duration) feeds a quantized gradient-boosted tree ensemble (under 200 KB, inference under 5 ms per window) that outputs an elongation estimate in percent. The model is trained on labeled data pairing ride audio with gauge-measured elongation. A single user calibration anchors the model to the rider's drivetrain: the rider enters one Park Tool gauge reading (e.g., 0.25%), and the system offsets its estimates so the current feature vector maps to that value, correcting for phone placement and frame acoustics. Only feature vectors and elongation estimates leave the device; raw audio never uploads.
7. Advisories, Trend Projection, and Fleet Mode
The app maintains a per-bike wear log. When the smoothed elongation estimate crosses 0.4% for 11- and 12-speed or 0.6% for 5- to 10-speed, it issues an early advisory with a trend projection ("at your current mileage rate, 0.5% in ~300 km"). At 0.5% / 0.75% it issues the replacement advisory, coupled with the cassette-protection rationale: the cost ratio of chain to cassette, computed from the user's component tier. The chainsuck-risk flag fires independently of elongation. In fleet mode, a bike-share or delivery operator aggregates per-bike wear indices from rider phones or dock-mounted microphones and schedules condition-based chain replacement, replacing calendar-based intervals that swap good chains early and miss abused ones.
8. Figures Description
- Figure 1: System block diagram: phone sensors (mic, IMU, optional BLE cadence) feeding the segment gate, cadence/kinematics module, feature extractor, on-device classifier, and advisory outputs.
- Figure 2: Example spectra at 90 RPM / 50T showing the tooth-pass line at 75 Hz on a fresh chain versus the broadened line with frev sidebands on a 0.8% elongated chain.
- Figure 3: Wear progression plot: engagement line Q, sideband ratio, and chatter index versus gauge-measured elongation from 0% to 1.0%, with the 0.5% and 0.75% advisory thresholds marked.
- Figure 4: Stiff-link impulse train in the 1-4 kHz envelope aligned to the computed chain revolution period, with matched-filter detection threshold.
Claims
- A method for assessing bicycle drivetrain wear, comprising: acquiring an acoustic signal from a microphone of a mobile device carried by a rider; determining pedaling cadence from an inertial sensor of the mobile device or a paired cadence sensor; computing a chainring tooth-pass frequency as the product of the cadence and a chainring tooth count; computing a chain revolution frequency as chain speed divided by chain length; extracting, from the acoustic signal, wear features measured relative to the tooth-pass frequency; and estimating chain elongation from the wear features.
- The method of claim 1, wherein determining pedaling cadence comprises band-pass filtering a vertical acceleration channel to a pedaling frequency band, computing autocorrelation, and selecting the dominant lag as the crank period.
- The method of claim 1, further comprising gating analysis to loaded pedaling segments by requiring cadence stability within a tolerance band and rejecting coasting segments detected via a freewheel pawl-click acoustic signature.
- The method of claim 1, wherein the wear features comprise a Q factor of the tooth-pass engagement line and a sideband-to-carrier ratio for sidebands offset from the tooth-pass carrier by integer multiples of a chain revolution frequency, and wherein falling Q and rising sideband ratio indicate increasing pitch error from pin and bushing wear.
- The method of claim 1, wherein the wear features comprise a broadband chatter index computed as noise-floor power in a kilohertz band normalized by tooth-pass line power during loaded pedaling.
- The method of claim 1, further comprising detecting stiff links by matched filtering an envelope of the acoustic signal at a computed chain revolution frequency and flagging periodic impulses exceeding a threshold above the local envelope median.
- The method of claim 1, further comprising detecting a chainsuck precursor by counting low-frequency thump events phase-locked to crank rotation and issuing a safety advisory when the thump rate trends upward independent of the elongation estimate.
- The method of claim 1, further comprising calibrating the elongation estimate with a single user-entered manual gauge reading that offsets model outputs to the rider's drivetrain and phone placement.
- The method of claim 1, further comprising issuing a replacement advisory when the elongation estimate crosses a gear-count-dependent replacement threshold (0.5% for 11- and 12-speed drivetrains, 0.75% for 5- to 10-speed drivetrains), with a trend projection of remaining distance to the threshold.
- The method of claim 1, wherein the chainring tooth count is inferred by quantizing the ratio of the computed tooth-pass frequency to the cadence to the nearest integer, without user entry.
- The method of claim 1, further comprising aggregating per-bicycle wear indices from a plurality of rider devices in a fleet mode to schedule condition-based chain replacement for shared bicycles.
- The method of claim 1, wherein the estimating is performed by a quantized classifier executing on the mobile device, and only feature vectors and elongation estimates are transmitted off-device, with raw audio retained locally.
Implementation Notes
This is a design disclosure: no prototype has been built and no field validation has been performed, so every quantitative parameter above (frequency bands, window lengths, thresholds, model sizes) is an untested design choice, not a measured result. The disclosure is intended to enable a person of ordinary skill in the art to build the system, and to place the core idea (cadence-anchored acoustic assessment of bicycle chain wear on a consumer phone) in the public record as prior art.
The strongest case against this system is acoustic variability. Phone placement changes the transfer function, wind dominates at speed, different frames ring differently, lubrication state dominates chain noise and shifts stepwise at every re-lubrication, and e-bike motors add their own whine on top of the drivetrain. The design answers each with a specific mechanism: single-gauge calibration absorbs placement and frame differences, segment gating and wind rejection discard bad windows rather than analyzing them, and the tooth-pass anchor makes the analysis relative to measured mechanical frequencies instead of absolute spectral templates. The second objection is that chain gauges already exist and cost $15. They do, and they work, but a gauge in a toolbox does not measure anything; the wear it would have caught is discovered at the shop, after the cassette is ruined. The phone is already on the bike. The third objection is accuracy: can audio really resolve 0.5% elongation, a 0.064 mm average pitch change? The claim here is not that any single window resolves it, but that the trend of Q factor and sideband ratio across dozens of rides is hypothesized to do so, provided stepwise confounds such as re-lubrication are modeled as offsets rather than mistaken for wear — a hypothesis a builder must confirm before relying on it. A builder should first verify this empirically: record a drivetrain at known gauge-measured wear states on a trainer (no wind, fixed placement) and check that the features separate 0.25%, 0.5%, and 0.75% before building anything else.
A builder implementing this disclosure should start with three empirical questions: (1) what is the signal-to-noise ratio of the tooth-pass engagement line in phone microphone audio across placements (handlebar mount, jersey pocket) and speeds, measured against a reference microphone near the chainstay; (2) how repeatable the elongation features are across rides on the same drivetrain, which determines whether trend projection is honest; and (3) whether per-window cadence wander within the ±5% segment gate smears the ±2 Hz engagement-line band enough to confound the Q-factor feature, or whether recentering each window on its measured cadence restores it. Everything downstream is then engineering, conditional on that verification result. Everything upstream of them is the idea, and the idea is now public.
Prior Art References
- Spicer, J.B. et al., "Effects of Frictional Loss on Bicycle Chain Drive Efficiency," Journal of Mechanical Design 123(4), 2001, pp. 598-605: Chain drive efficiency measurements; tension and sprocket size dominate losses
- Park Tool CC-2 Chain Checker specifications: Replacement thresholds: 0.5% for 11/12-speed, 0.75% for 5- to 10-speed, 1.0% for single-speed chains
- MDPI Sensors 2023 review: acoustic and vibration signal-based fault detection for belt conveyor idlers using machine learning: Audio-based fault detection reaching 96%+ accuracy (96.7% reported) on belt conveyor idlers; the method family this disclosure adapts to bicycles
- Hidle et al., Sensors 2022: acoustic emission analysis for bearing condition monitoring: Characteristic-frequency fault detection from acoustic emission in rotating machinery
- Johns Hopkins / ScienceDaily 1999: chain drive efficiency findings: Press summary of Spicer chain efficiency research; lubrication secondary to tension and sprocket size