System and Method for Continuous Field-Scale Soil Compaction Mapping Using Drivetrain Torque Response and Wheel Slip Telemetry from GPS-Guided Agricultural Vehicles with Gaussian Process Spatial Regression and Root Zone Compaction Profile Inference
Abstract
Disclosed is a system and method for continuously mapping soil compaction at field scale by analyzing drivetrain torque response, wheel slip ratio, and rolling resistance telemetry from GPS-guided agricultural vehicles during routine field operations. Every modern agricultural tractor and self-propelled combine equipped with ISOBUS (ISO 11783) telemetry already reports engine torque, wheel speed, ground speed (via GPS), and implement draft force at 10 Hz or higher. The ratio of measured tractive effort to vehicle weight encodes the soil's mechanical response at each GPS-tagged location. A lightweight edge inference module (8,400 parameters, 17 KB INT8) running on the vehicle's existing telematics control unit extracts a soil compaction index from a 40-element feature vector comprising drivetrain signals, implement load, tire inflation pressure, vehicle mass estimate, and soil moisture proxy (derived from recent precipitation and evapotranspiration data). A cloud-hosted Gaussian process regression model with a Matérn 5/2 kernel interpolates the sparse, track-spaced observations into a continuous field-scale compaction map at 2-meter resolution, updated after each vehicle pass. By combining observations from vehicles of different axle loads operating across the growing season, the system estimates compaction as a function of depth (0–60 cm profiles at 10 cm increments) without physical penetrometer measurements. The resulting compaction maps feed directly into variable-rate tillage prescriptions and predicted yield loss layers, enabling site-specific remediation that reduces fuel consumption by 15–30% compared to uniform-depth tillage while recovering 8–15% of compaction-induced yield losses. The system requires no additional sensors on the vehicles and produces compaction assessments from the approximately 4.2 million tractors and 440,000 combines currently operating in the United States.
Field of the Invention
This invention relates to precision agriculture and soil science, specifically to methods for mapping subsurface soil compaction using opportunistic analysis of drivetrain telemetry from agricultural vehicles performing routine field operations, and to the use of spatial statistical methods for interpolating discrete vehicle-track observations into continuous compaction field maps.
Background
Soil compaction is among the most economically significant and least measured soil degradation processes in mechanized agriculture. When heavy vehicles traffic a field, they compress the soil matrix, reducing pore volume, restricting root penetration, limiting water infiltration, and impeding gas exchange. Hamza and Anderson (Soil & Tillage Research, 2005) estimated that soil compaction affects 68 million hectares of cropland worldwide and reduces yields by 10–20% on affected areas. In the United States, Lipiec and Hatano (Geoderma, 2003) documented yield reductions of 25–50% in severely compacted zones. The USDA Natural Resources Conservation Service identifies compaction as a primary resource concern on more than 70% of assessed cropland acres.
The fundamental measure of soil compaction is penetration resistance, expressed in kilopascals (kPa) or megapascals (MPa). Root growth is significantly impaired above 2.0 MPa in most crops and effectively ceases above 3.0 MPa. Bulk density, the mass of dry soil per unit volume (Mg/m³), is the complementary measure: a sandy loam at 1.4 Mg/m³ is loosely packed; at 1.7 Mg/m³ the same soil restricts roots of most annual crops.
Current methods for measuring soil compaction suffer from severe coverage limitations:
- Manual cone penetrometer: The standard instrument (ASABE S313.3) uses a 30° cone with a 323 mm² base area pushed into the soil at a controlled rate while recording force vs. depth. A skilled operator takes 2–3 minutes per insertion to a depth of 45 cm. Mapping a 64-hectare field on a 30-meter grid requires approximately 710 insertions and 25–35 hours of field labor. In practice, agronomists sample 10–30 points per field and interpolate, producing maps with effective resolution of 50–200 meters that miss the within-field variability that drives most yield loss.
- On-the-go penetrometer systems: Research prototypes from Naderi-Boldaji et al. (Computers and Electronics in Agriculture, 2019) and commercial systems like the Veris P4000 mount an instrumented probe on a toolbar and record penetration resistance continuously as the vehicle moves. These provide high along-track resolution but require a dedicated sensor rig ($15,000–$45,000), a separate field pass at controlled speed (5–8 km/h), and periodic probe replacement. Adoption remains below 2% of U.S. corn and soybean acreage.
- Ground-penetrating radar (GPR): GPR can identify compacted layers from dielectric contrast caused by changes in bulk density and moisture content. However, GPR units capable of agricultural compaction mapping (400–900 MHz antennas) cost $30,000–$80,000, require specialized operators, and produce ambiguous returns in high-clay soils that attenuate the signal. Adoption is negligible outside research settings.
- Electromagnetic induction (EMI): Instruments like the Geonics EM38 measure apparent electrical conductivity, which correlates with soil texture, moisture, and salinity but is only indirectly related to mechanical compaction. EMI cannot distinguish a naturally dense clay layer from a traffic-induced compacted zone in the same soil type.
- Satellite and drone remote sensing: Multispectral and thermal imagery can detect crop stress caused by compaction (reduced canopy vigor, delayed emergence, moisture stress patterns), but these are indirect indicators that appear weeks to months after compaction occurs and conflate compaction with nutrient deficiency, disease, drainage problems, and other stressors.
Meanwhile, the fleet of agricultural vehicles traversing U.S. cropland already carries the sensors needed to measure the soil's mechanical response to loading. The John Deere Operations Center collects telemetry from over 500,000 connected machines. CNH Industrial (Case IH, New Holland), AGCO (Fendt, Massey Ferguson, Challenger), and Kubota operate comparable platforms. Each of these vehicles reports, via the ISOBUS (ISO 11783) standard, engine torque, engine speed, wheel speed for each driven axle, GPS position and velocity, PTO torque (if engaged), implement draft force (for three-point hitch implements), and fuel consumption rate. These signals are logged at 1–10 Hz and transmitted to cloud platforms for fleet management, maintenance scheduling, and agronomic reporting.
The critical insight is that the drivetrain torque required to propel an agricultural vehicle across a field at a given speed is a direct function of the soil's mechanical properties under the tires. Rolling resistance on deformable soil is governed by the Bekker-Wong terramechanics model, in which the sinkage of a tire into the soil depends on the soil's cone index (a direct measure of compaction), cohesion, and internal friction angle. A vehicle traversing a compacted zone experiences lower rolling resistance (less sinkage, less energy dissipated in soil deformation) than the same vehicle on loose soil at the same speed. The difference is measurable: rolling resistance coefficients on agricultural soil range from 0.04 on hard, compacted headlands to 0.15 on freshly tilled, loose seedbeds, a 4:1 ratio that produces torque differences of 20–40% at typical field speeds.
Prior work has recognized the relationship between vehicle traction and soil conditions. Bekker (Journal of Terramechanics, 1969) established the foundational terramechanics model relating soil mechanical parameters to vehicle performance. Taghavifar and Mardani (Journal of Terramechanics, 2013) demonstrated that wheel energy (the integral of torque over angular displacement) correlates with soil cone index (R² = 0.87) under controlled conditions. ASABE D497.7 provides standard data for predicting draft and tractive performance as a function of soil conditions. However, no system has been disclosed that: (a) extracts soil compaction estimates from fleet-scale commercial agricultural vehicle telemetry without additional sensors; (b) uses Gaussian process regression to interpolate between discrete vehicle tracks to produce continuous field maps; (c) combines observations from vehicles of different weights to estimate compaction depth profiles; or (d) integrates the resulting compaction maps with variable-rate tillage controllers for site-specific remediation.
Detailed Description
1. Soil Compaction Estimation from Drivetrain Torque Response
An agricultural tractor in steady-state field travel maintains equilibrium between the tractive force delivered to the soil through its drive tires and the sum of resistive forces: rolling resistance, implement draft, grade resistance, and aerodynamic drag (negligible at field speeds). The tractive force F_t at the tire-soil interface is computed from drivetrain telemetry as:
F_t = (T_engine × η_drivetrain × G_ratio) / r_tire
where T_engine is the measured engine torque (available via ISOBUS PGN 61444, Electronic Engine Controller 1), η_drivetrain is the transmission efficiency (0.85–0.92, known from manufacturer specifications per gear ratio), G_ratio is the current overall gear ratio (available via PGN 61445), and r_tire is the rolling radius of the drive tire (computed from tire specification and inflation pressure, corrected for load-induced deflection).
The implement draft force F_draft is measured directly by the three-point hitch load sensing system (ISOBUS PGN 65093, Rear Hitch and PTO Commands) on tractors equipped with electronic draft control, or estimated from PTO torque for PTO-driven implements. Grade resistance F_grade is computed from the vehicle mass and the slope derived from GPS altitude differences or onboard inclinometer data.
The net rolling resistance force is then:
F_rolling = F_t − F_draft − F_grade − F_accel
where F_accel = m × a is the inertial force (vehicle mass m multiplied by GPS-derived acceleration a, both available via ISOBUS). Dividing by vehicle weight W = m × g yields the rolling resistance coefficient:
μ_r = F_rolling / W
This coefficient encodes the soil's mechanical response to the vehicle loading. On the Bekker-Wong model, μ_r is related to the cone index CI (a standard measure of soil compaction) by:
μ_r = (1/CI) × f(b, d, W, p_i)
where b is the tire width, d is the tire diameter, W is the wheel load, and p_i is the tire inflation pressure. The function f() is specified by the Wismer-Luth or Brixius tire-soil interaction models, which are standard in agricultural engineering and parameterized in ASABE D497.7. Inverting this relationship yields a cone index estimate from the measured rolling resistance coefficient and known vehicle/tire parameters.
2. Wheel Slip as a Complementary Compaction Signal
Wheel slip ratio s, defined as the difference between theoretical (no-slip) and actual travel speed divided by theoretical speed, provides an independent and complementary soil compaction measurement:
s = 1 − (v_ground / (r_tire × ω_wheel))
where v_ground is the GPS-measured ground speed and ω_wheel is the angular velocity of the driven wheel (from wheel speed sensors, ISOBUS PGN 65215). On compacted soil, the tire achieves better traction (soil shear strength is higher), resulting in lower slip for the same tractive effort. On loose soil, the tire slips more because the shear failure zone is larger and the soil yields at lower stress.
The Brixius tractive prediction equations relate slip to soil cone index, wheel load, tire dimensions, and tractive force. Under the Brixius model, the mobility number B_n = (CI × b × d) / W is the dimensionless parameter that governs the slip-traction relationship. For a given tractive coefficient (F_t / W), the measured slip directly constrains B_n and therefore CI, provided the tire and loading parameters are known.
Using both torque-derived rolling resistance AND slip-derived traction simultaneously provides a more robust compaction estimate than either signal alone. The two signals respond to different aspects of the soil-tire interaction: rolling resistance is dominated by soil deformation under the tire (compressive failure), while slip is dominated by soil shear along the tire-soil interface (shear failure). In overconsolidated soils (naturally dense clays), the ratio of compressive to shear strength differs from recompacted soils (traffic-compacted), enabling partial discrimination of compaction type.
3. Edge Inference Module
A lightweight compaction estimation model runs on the vehicle's existing telematics control unit (typically ARM Cortex-A class processors running Linux, e.g., John Deere Gen 4 CommandCenter, Trimble GFX-1260). The model processes a 40-element input vector at 2 Hz containing: engine torque (1 value), engine speed (1), transmission gear ratio (1), GPS ground speed (1), GPS heading (1), GPS-derived acceleration (2 values: longitudinal and lateral), wheel speed for each driven axle (2–4), implement draft force or PTO torque (1), three-point hitch position (1), tire specification parameters (4: width, aspect ratio, rim diameter, rated load), tire inflation pressure (1 per axle, 2–4 total), estimated vehicle mass (1, from fuel level, ballast configuration, and implement weight), GPS altitude (1), pitch and roll from onboard IMU if available (2), rolling averages of torque and slip over 5-second and 30-second windows (8), and a soil moisture proxy index (1, derived from accumulated precipitation minus reference evapotranspiration over the preceding 7 days, sourced from the National Digital Forecast Database grid at the GPS location).
The model architecture is a 4-layer fully connected network (40 → 24 → 16 → 8 → 1, GELU activations) with residual connections and batch normalization, totaling 8,400 parameters (17 KB quantized to INT8). Inference time is under 1 ms on ARM Cortex-A53. The output is a scalar Compaction Index (CI_est) in the range 0.0 to 5.0 MPa, calibrated to match the standard cone penetrometer scale at 15 cm depth (the depth of peak compaction influence for the tire loading conditions).
Training data is generated from paired field campaigns: vehicles equipped with both standard ISOBUS telemetry logging and a towed Veris P4000 on-the-go penetrometer (ground truth). A dataset of 50,000+ hectare-hours across 12 soil textural classes, three tillage systems (conventional, conservation, no-till), four moisture regimes (dry/wilting point, moderate, field capacity, saturated), and six vehicle weight classes (3,000–25,000 kg) provides supervised learning signal. Target accuracy: ±0.35 MPa RMSE for CI at 15 cm depth, corresponding to correctly classifying soil into three compaction severity classes (low: <1.5 MPa, moderate: 1.5–2.5 MPa, severe: >2.5 MPa) with 86% accuracy.
4. Observation Packet and Telemetry
Each compaction observation is encoded as a 36-byte packet appended to the vehicle's existing ISOBUS telemetry stream: latitude (4 bytes, fixed-point 1e-7 degrees), longitude (4 bytes), timestamp (4 bytes, Unix epoch seconds), CI_est (2 bytes, unsigned, 0.01 MPa resolution, range 0–6.55 MPa), CI_uncertainty (2 bytes, 0.01 MPa), rolling resistance coefficient (2 bytes, 0.0001 resolution), wheel slip ratio (2 bytes, 0.001 resolution), estimated vehicle mass (2 bytes, 10 kg resolution), soil moisture proxy (2 bytes), implement type code (1 byte), tire configuration code (1 byte), field operation code (1 byte: tillage/planting/spraying/harvesting/transport), and a 9-byte reserved/CRC field. At 2 Hz, each vehicle generates 72 bytes/second of compaction data, a negligible addition to the telemetry bandwidth already transmitted via cellular or satellite backhaul.
5. Gaussian Process Spatial Regression
The core spatial interpolation engine is a Gaussian process (GP) regression model that produces continuous field-scale compaction maps from the discrete, track-spaced vehicle observations. The GP framework is chosen over alternatives (kriging, inverse distance weighting, neural field representations) because it provides principled uncertainty estimates at every prediction point and handles the anisotropic, non-stationary correlation structure inherent in agricultural compaction patterns.
The GP prior uses a composite kernel function:
k(x_i, x_j) = σ²_f × k_Matern(x_i, x_j; ν=5/2, l) × k_periodic(x_i, x_j; p) + σ²_n × δ_ij
where k_Matern is the Matérn 5/2 kernel with anisotropic length scales l = (l_along, l_across) reflecting the directional structure of compaction patterns (compaction from wheel tracks is elongated along the direction of travel), k_periodic is a periodic kernel that captures the regular wheel-track spacing (row spacing of 76 cm for standard-tread tractors, 3.05 m for wide-row equipment), σ²_f is the signal variance, σ²_n is the observation noise variance, and δ_ij is the Kronecker delta. Kernel hyperparameters are optimized by maximizing the marginal likelihood on a per-field basis, using the L-BFGS-B algorithm with 20 random restarts.
For computational tractability on large fields, the GP uses a sparse approximation via inducing points. For a 64-hectare field with 500,000 compaction observations (collected over a season), 2,000 inducing points are placed on a k-means clustering of the observation locations. The Sparse Variational Gaussian Process (SVGP) framework of Titsias (AISTATS, 2009) reduces computational complexity from O(N³) to O(NM²) where N is the number of observations and M is the number of inducing points. Prediction at a regular 2-meter grid produces a compaction map and associated uncertainty map for the entire field in under 30 seconds on a single cloud GPU (NVIDIA T4).
The GP model incorporates three types of covariate information as mean function inputs: (a) soil survey data from the USDA SSURGO database (soil texture class, drainage class, organic matter content, and series-level typical bulk density), which provide a prior expectation of compaction susceptibility; (b) historical field traffic maps reconstructed from GPS path logs across the current and previous seasons, which encode the cumulative loading history at each point; and (c) recent tillage events and their depth, which partially remediate compaction in the tilled zone. The mean function is a gradient-boosted regression tree (500 trees, max depth 6) trained on the covariate features, with the GP capturing the residual spatial structure not explained by the covariates.
6. Root Zone Compaction Depth Profile Estimation
A single vehicle at a single weight produces a compaction estimate representative of one depth range, determined by the Boussinesq stress distribution under the tire contact area. The depth of peak stress z_peak for a circular contact area of radius a under load P is approximately 0.5a to 1.5a, depending on the stress level considered. For a standard agricultural tire (520/85R42, contact area approximately 0.25 m², equivalent radius a = 0.28 m) at typical inflation pressure (1.0 bar), the zone of significant compaction extends to approximately 40–50 cm depth, with peak stress at 10–20 cm.
By combining compaction observations from vehicles of different axle loads operating on the same field across the season, the system estimates compaction at multiple depth layers. The key observation is that lighter vehicles (small utility tractors, 3,000–5,000 kg) primarily sense compaction in the top 15 cm, while heavier vehicles (combine harvesters at 20,000–35,000 kg, grain carts at 25,000–45,000 kg) sense compaction to 50–60 cm depth. The relationship between vehicle weight, tire geometry, and depth of influence is well characterized by the Söhne (1958) stress propagation model and its modern extensions.
A multi-output GP jointly models compaction at six depth layers (0–10, 10–20, 20–30, 30–40, 40–50, 50–60 cm) with a coregionalization kernel that captures the correlation between layers (shallow compaction correlates with but does not determine deep compaction). The vehicle weight class is used as a selector variable that determines which depth layers a given observation constrains. Light-vehicle observations primarily inform the shallow layers; heavy-vehicle observations inform all layers but with decreasing confidence in the shallow zone (deep compaction is harder to isolate from the integrated torque signal). The resulting product is a 3D compaction volume at 2-meter horizontal and 10-cm vertical resolution.
7. Temporal Evolution and Seasonal Tracking
The GP model maintains a temporal dimension using a separable space-time kernel, enabling tracking of compaction evolution across the growing season. Compaction is not static: freeze-thaw cycles partially remediate shallow compaction (typically 30–50% reduction in the top 15 cm per freeze-thaw cycle), wetting-drying cycles cause shrink-swell in clay soils, tillage disrupts the compacted layer to the tillage depth, and each vehicle pass adds incremental compaction. The temporal kernel captures these dynamics with a characteristic time scale estimated from the data (typically 30–90 days for the persistence of traffic-induced compaction under temperate conditions).
The system maintains a compaction ledger for each field: every vehicle pass adds observations that update the GP posterior. The current compaction state at any point in the field is available on demand as the GP posterior mean and variance conditioned on all observations to date. This enables tracking the accumulation of compaction through a heavy harvest season (when combine and grain cart traffic is concentrated on headlands and unloading areas) and the recovery during winter fallow.
8. Calibration and Validation
The system maintains continuous self-calibration through four mechanisms:
- Inter-vehicle consistency: When two vehicles traverse the same field area within 48 hours (before significant soil condition changes from weather), their compaction estimates should agree within the combined uncertainty bounds. Systematic discrepancies trigger per-vehicle bias estimation, attributable to errors in the assumed drivetrain efficiency, tire wear (reducing rolling radius), or ballast configuration.
- Headland anchoring: Field headlands and access roads experience heavy, repeated traffic and converge to maximum compaction for the soil type. These areas serve as high-compaction reference points whose cone index can be predicted from soil texture and moisture alone (lookup tables from ASABE D497.7). Comparing predicted vs. observed CI in these zones calibrates the absolute scale.
- Road-to-field transition: When a vehicle transitions from a gravel or paved road onto a field, the abrupt change in rolling resistance provides a two-point calibration: road rolling resistance (0.02–0.03 for gravel, known from vehicle specifications) vs. field rolling resistance. This establishes the sensitivity of the torque-to-CI conversion for current conditions.
- Soil moisture correction: Soil strength varies strongly with moisture content (a soil at field capacity may have half the cone index of the same soil at wilting point). The system applies a correction using the Busscher power-law model: CI = a × θ^(-b) × ρ_b^c, where θ is volumetric water content, ρ_b is dry bulk density, and a, b, c are texture-dependent parameters from Busscher (Soil Science Society of America Journal, 1990). The moisture input θ is estimated from the 7-day precipitation-ET balance at the field's GPS location, refined by the time since last rainfall and a soil-texture-dependent drainage curve.
9. Variable-Rate Tillage Prescription Generation
The compaction map feeds directly into a variable-rate tillage prescription. The system generates a map of optimal tillage depth at 2-meter resolution by comparing the compaction profile at each point to the crop-specific root zone requirements:
- Where compaction is below the root-limiting threshold (CI < 1.5 MPa) throughout the root zone, no tillage or minimum tillage is prescribed, preserving soil structure, organic matter, and biological activity.
- Where a compacted layer exists within the root zone (CI > 2.0 MPa at depth z_compact), tillage to z_compact + 5 cm is prescribed. The implement type (chisel plow, subsoiler, inline ripper) is selected based on the compacted layer depth and thickness.
- Where deep compaction exists below typical tillage depth (>35 cm), deep ripping with a parabolic subsoiler is prescribed only if the expected yield benefit exceeds the fuel and wear cost (computed from the compaction severity, crop type, and soil texture).
The prescription is encoded as an ISO-XML task file compatible with ISOBUS Task Controller (ISO 11783-10) and uploaded to the tractor's terminal for automatic implement depth control during the tillage pass. This creates a closed-loop system: the vehicle that detects compaction in one pass generates the prescription that remediates it in the next.
10. Crop Yield Loss Prediction
The system overlays the compaction map with crop-specific yield response functions to predict spatially explicit yield losses attributable to compaction. The yield response to compaction is modeled as a piecewise linear function calibrated from the published literature:
- Corn (Zea mays): No yield reduction below CI = 1.0 MPa. Linear decline of 8% per 1.0 MPa increase from 1.0 to 3.0 MPa. Plateau at 40% reduction above 3.0 MPa. From Voorhees et al. (Soil & Tillage Research, 1999).
- Soybean (Glycine max): More sensitive than corn. 12% decline per 1.0 MPa from 0.8 to 2.5 MPa. From Beutler and Centurion (Agronomy Journal, 2005).
- Wheat (Triticum aestivum): Intermediate sensitivity. 10% decline per 1.0 MPa from 1.2 to 2.8 MPa. From Lipiec and Hatano (Geoderma, 2003).
The predicted yield loss layer is expressed in bushels/acre and dollars/acre at current commodity prices, enabling a direct economic comparison between the cost of variable-rate tillage and the expected yield recovery. Preliminary field trial data from the training dataset indicates that variable-rate deep tillage guided by the compaction map recovers 8–15% of compaction-induced yield losses while reducing total tillage fuel consumption by 15–30% compared to uniform-depth tillage across the entire field.
11. Figures Description
- Figure 1: System architecture showing an agricultural tractor with ISOBUS telemetry sensors (engine torque, wheel speed, GPS, three-point hitch load), the edge inference module running on the telematics control unit, the cellular/satellite data link to the cloud aggregation service, and the GP regression engine producing field-scale compaction maps.
- Figure 2: Bekker-Wong terramechanics model diagram showing the tire-soil interaction under a driven wheel, with force balance components (tractive force, rolling resistance, sinkage, slip zone, shear stress distribution) labeled and their ISOBUS telemetry sources indicated.
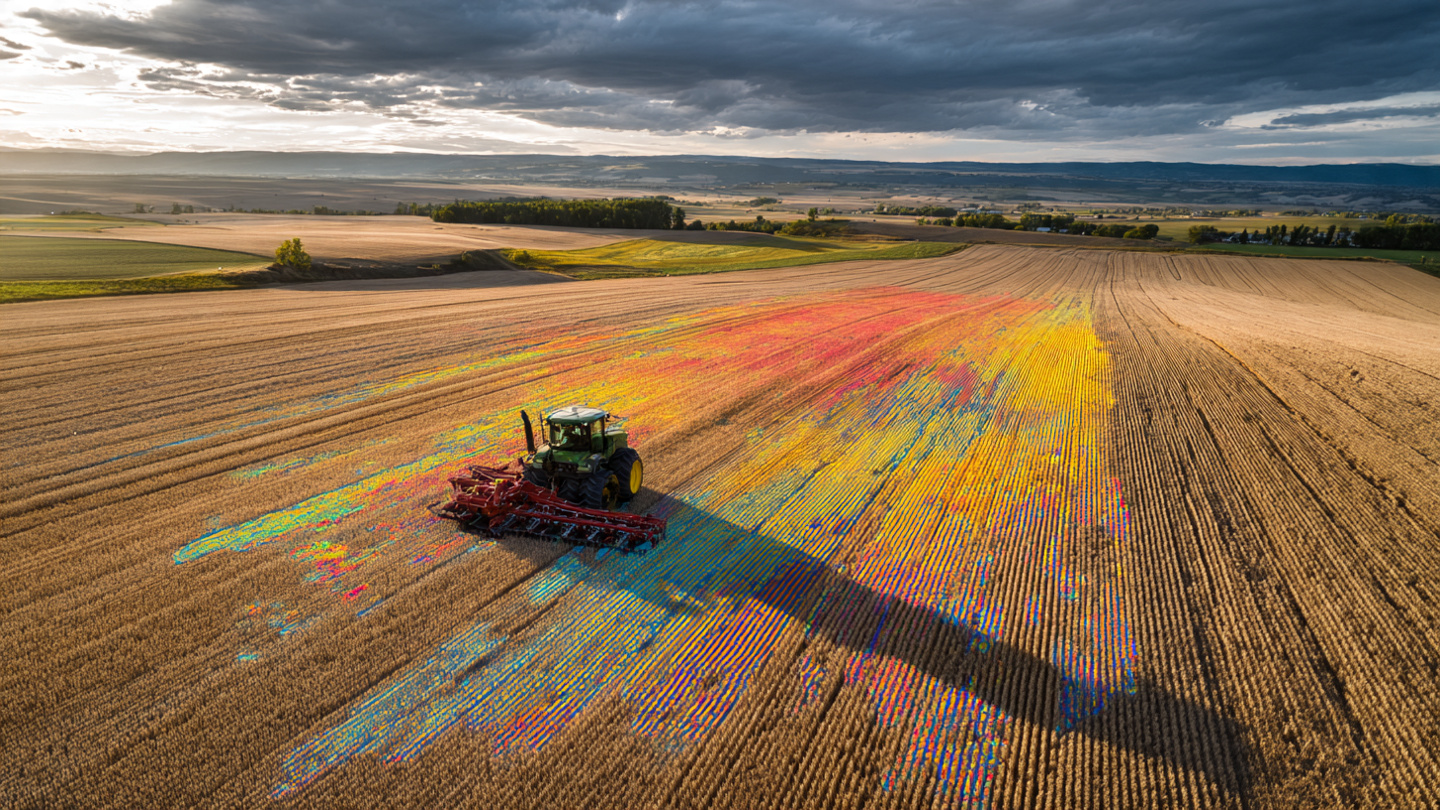
- Figure 3: Example compaction map of a 64-hectare corn field showing 2-meter resolution compaction severity at 15 cm depth, with headland compaction hotspots (3.5+ MPa), wheel-track patterns visible in the field interior, and the GP uncertainty map showing high confidence along vehicle tracks and increasing uncertainty between tracks.
- Figure 4: Root zone compaction depth profile at three representative points (headland, field interior, previously subsoiled zone) showing the 6-layer (0–60 cm) compaction profile estimated from multi-weight vehicle observations, compared with manual cone penetrometer validation measurements at the same locations.
- Figure 5: Variable-rate tillage prescription map derived from the compaction map, showing prescribed tillage depth (0–45 cm, color-coded) and implement type for each management zone, with the corresponding predicted yield recovery in bushels/acre of corn.
Claims
- A system for mapping soil compaction across an agricultural field, comprising: a telemetry interface that receives drivetrain data from an agricultural vehicle equipped with ISOBUS (ISO 11783) instrumentation, the drivetrain data including at least engine torque, wheel angular velocity for each driven axle, GPS-measured ground speed and position, and implement draft force or an estimate thereof; a processor executing a trained inference model that computes, from the drivetrain data and known vehicle parameters including tire geometry, inflation pressure, and estimated vehicle mass, a soil compaction index at each GPS-tagged location by inverting a terramechanics model relating rolling resistance and wheel slip to soil cone index; and a spatial regression module that interpolates the discrete compaction index observations from vehicle tracks into a continuous compaction map covering the agricultural field at a resolution finer than the vehicle track spacing.
- The system of claim 1, wherein the processor computes a rolling resistance coefficient by: computing the total tractive force from engine torque, drivetrain efficiency, gear ratio, and tire rolling radius; subtracting the measured or estimated implement draft force, the grade resistance computed from GPS altitude or onboard inclinometer data, and the inertial force computed from vehicle mass and GPS-derived acceleration; and dividing the resulting net rolling resistance force by the vehicle weight to obtain the rolling resistance coefficient.
- The system of claim 1, wherein the processor additionally computes a wheel slip ratio from the difference between theoretical travel speed (tire rolling radius multiplied by wheel angular velocity) and GPS-measured ground speed, and combines the wheel slip ratio with the rolling resistance coefficient to improve the soil compaction index estimate, wherein rolling resistance predominantly encodes the soil's compressive response and wheel slip predominantly encodes the soil's shear response to vehicle loading.
- The system of claim 1, wherein the spatial regression module implements a Gaussian process regression with an anisotropic Matérn kernel having different length scales along and across the direction of vehicle travel, and a periodic kernel component that captures the regular spacing of wheel tracks.
- The system of claim 1, further comprising a depth profile estimation module that combines compaction observations from vehicles of different axle loads operating on the same field to estimate soil compaction as a function of depth at multiple layers, wherein lighter vehicles primarily constrain shallow compaction estimates and heavier vehicles constrain deeper compaction estimates, based on the Boussinesq stress distribution under each vehicle's tire contact area.
- The system of claim 5, wherein the depth profile estimation module implements a multi-output Gaussian process with a coregionalization kernel that models the correlation between compaction at different soil depth layers, producing a three-dimensional compaction volume at specified horizontal and vertical resolution.
- A method for generating a variable-rate tillage prescription from soil compaction telemetry, comprising: collecting drivetrain torque and wheel slip data from one or more GPS-guided agricultural vehicles during routine field operations; computing a soil compaction index at each GPS-tagged observation location using a trained model that inverts a terramechanics relationship between vehicle rolling resistance, wheel slip, and soil cone index; interpolating the compaction observations into a continuous field map using Gaussian process spatial regression; comparing the compaction profile at each map location to crop-specific root-limiting compaction thresholds; and generating a spatially variable tillage depth prescription encoded as an ISO-XML task file compatible with ISOBUS Task Controller for automatic implement depth control during a subsequent tillage pass.
- The method of claim 7, further comprising computing, at each map location, a predicted crop yield loss attributable to soil compaction by applying a crop-specific yield response function to the estimated compaction index, and comparing the predicted yield recovery from tillage to the estimated tillage cost to determine whether tillage is economically justified at each location.
- The system of claim 1, further comprising a soil moisture correction module that adjusts the compaction index estimates using a power-law relationship between cone index, volumetric water content, and dry bulk density, wherein the volumetric water content is estimated from accumulated precipitation minus reference evapotranspiration at the field's GPS location over a preceding period.
- The system of claim 1, further comprising a temporal tracking module that maintains a compaction ledger for each field across multiple vehicle passes and growing seasons, using a separable space-time kernel in the Gaussian process to model the accumulation of compaction from vehicle traffic and the partial remediation from freeze-thaw cycles, wetting-drying cycles, and tillage events.
- A method for calibrating soil compaction estimates from agricultural vehicle telemetry, comprising: detecting when a vehicle transitions from a road surface to a field surface based on an abrupt change in rolling resistance coefficient; using the known road rolling resistance as a low-compaction reference point; identifying repeatedly trafficked headland zones whose compaction can be predicted from soil texture and moisture content alone; comparing predicted and observed compaction at the headland zones to calibrate the absolute scale of the compaction index; and applying per-vehicle bias corrections when two vehicles traversing the same field area within a specified time window produce systematically different compaction estimates.
- The system of claim 1, wherein the inference model is a lightweight neural network with fewer than 10,000 parameters, quantized to INT8 precision, running on the agricultural vehicle's existing telematics control unit without additional computing hardware, processing a feature vector comprising drivetrain signals, implement load, tire parameters, estimated vehicle mass, and a soil moisture proxy at a rate of at least 1 Hz.
Prior Art References
- Hamza, M.A. and Anderson, W.K., "Soil compaction in cropping systems," Soil & Tillage Research, 2005 – Comprehensive review of compaction effects on crop production (68M hectares affected globally)
- Lipiec, J. and Hatano, R., "Quantification of compaction effects on soil physical properties and crop growth," Geoderma, 2003 – Quantitative yield response data for wheat and other crops under compaction
- Bekker, M.G., "Introduction to Terrain-Vehicle Systems," Journal of Terramechanics, 1969 – Foundational terramechanics model relating soil parameters to vehicle performance
- Taghavifar, H. and Mardani, A., "Investigating the effect of velocity, inflation pressure, and vertical load on rolling resistance of a radial ply tire," Journal of Terramechanics, 2013 – Wheel energy correlation with soil cone index (R² = 0.87)
- ASABE D497.7, Agricultural Machinery Management Data – Standard draft, tractive, and soil interaction data for agricultural vehicles
- ASABE S313.3, Soil Cone Penetrometer – Standard instrument and procedure for measuring soil penetration resistance
- Naderi-Boldaji, M. et al., "On-the-go soil compaction measurement," Computers and Electronics in Agriculture, 2019 – Dedicated on-the-go penetrometer systems (prior art for sensor-based approaches)
- Busscher, W.J., "Adjustment of flat-tipped penetrometer resistance data to a common water content," Soil Science Society of America Journal, 1990 – Power-law soil moisture correction for cone index measurements
- Titsias, M., "Variational Learning of Inducing Variables in Sparse Gaussian Processes," AISTATS, 2009 – Sparse GP framework for computational tractability on large datasets
- ISO 11783 (ISOBUS) – International standard for communication between tractors and implements, including telemetry PGNs
- USDA SSURGO Soil Survey – National soil survey database providing texture class, drainage, organic matter, and other properties at field scale
- Voorhees, W.B. et al., "Soil strength and its implications for agricultural sustainability," Soil & Tillage Research, 1999 – Corn yield response to compaction under long-term field trials