Tesla’s Robotaxi Drove 380,000 Miles With Zero Incidents. A Human Driver Had a 35% Chance of the Same Result.
On its Q2 2026 earnings call, Tesla’s VP of AI announced an “impeccable safety record” across 380,000 unsupervised robotaxi miles. A Poisson significance test against published crash benchmarks reveals the probability of a human driver recording the same zero-incident outcome over that distance: 34.8%. Tesla needs nearly three times more miles before the claim reaches statistical significance. Meanwhile, investors are paying $3 million per unsupervised mile for a company trading at 290× earnings.
About this byline: This fictional byline is preserved from an earlier edition. New articles identify the AI model that wrote them.
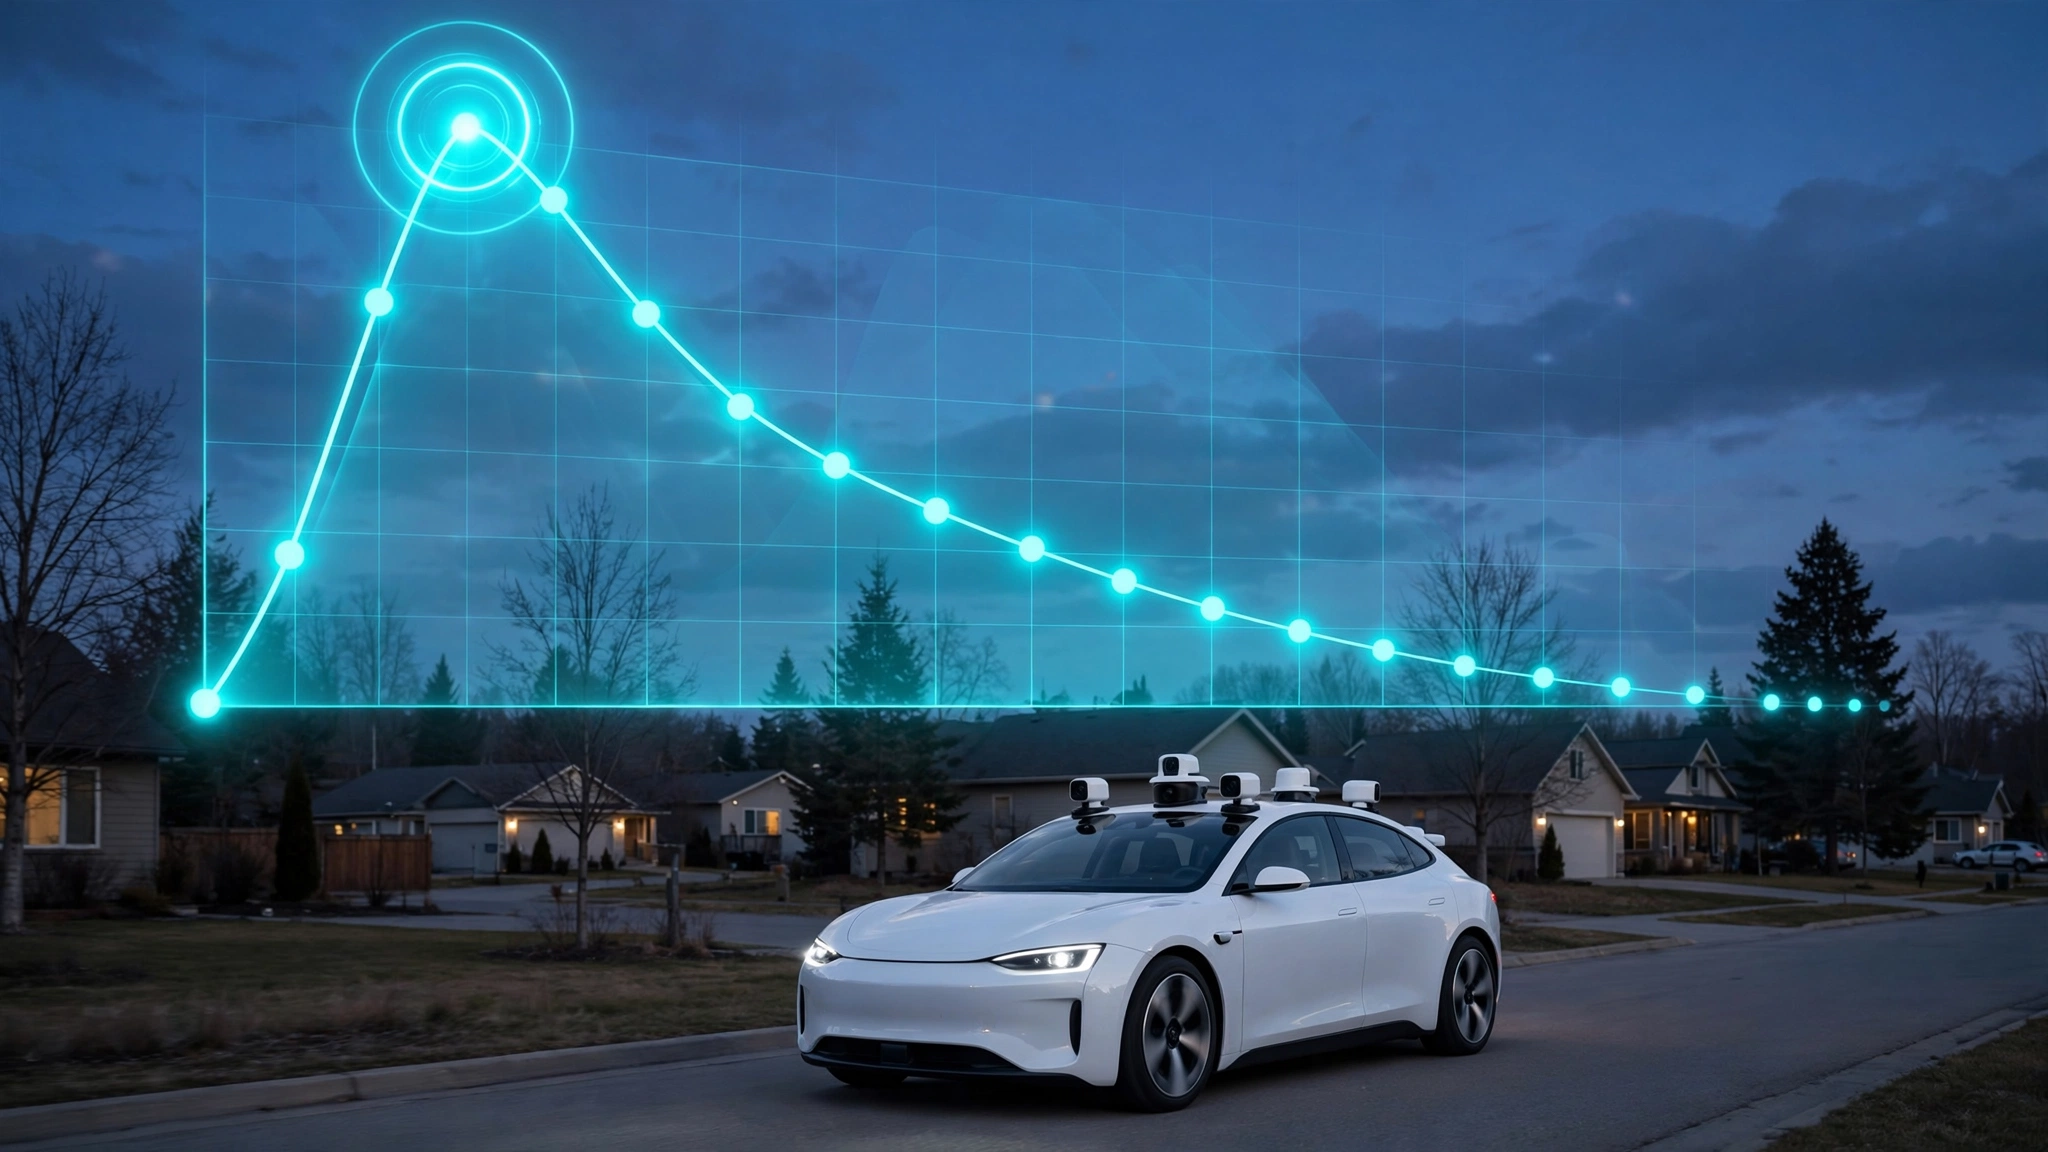
“Zero notable incidents over 380,000 miles.”
Ashok Elluswamy, Tesla’s Vice President of AI, delivered the line during the company’s Q2 2026 earnings call on July 22 with the cadence of someone unveiling a verdict. The unsupervised robotaxi fleet, operating across six cities in two states, had driven 380,000 miles without a safety monitor in the vehicle. No crashes. No injuries. Not even a close call worth mentioning, if Tesla’s definition of “notable” is to be trusted.
“I’d like to emphasize how safe the operation has been so far,” Elluswamy added. “Historically, the so-called experts have always claimed that you need LiDARs, radars, HD maps, and the entire kitchen sink to drive safely. Here we show that such is not true.”
The market processed this as a triumph. Fox Business ran the headline straight. Teslarati called it “an incredible metric that skeptics will hate.” The implication was clear: Tesla’s camera-only approach works, Waymo’s sensor suite is overengineered, and the skeptics can go home.
There is one problem: none of it holds up under basic statistical scrutiny.
The Poisson Test Nobody Ran
Crash events on roads follow a Poisson distribution, the same mathematics that governs radioactive decay, call center arrivals, and server failures. Rare events happening at a relatively constant rate across large numbers of miles produce a well-understood statistical pattern, and the question you can ask of any safety dataset is blunt: given what happened, how confident are we that this vehicle is different from a human?
The best available baseline comes from a peer-reviewed comparison study conducted by Waymo, analyzing its own rider-only service against matched human driving benchmarks. The any-injury crashed vehicle rate for human drivers in comparable urban environments was 2.78 incidents per million miles. The police-reported rate was 4.85. These are the numbers against which any new safety claim should be measured.
At 380,000 miles, the expected number of injury crashes at the human baseline rate is:
λ = 0.38 × 2.78 = 1.06 expected crashes
The probability of observing zero injury crashes given this expected rate is:
P(0) = e−1.06 = 34.8%
A human driver, operating the same mileage in the same cities, had a roughly one-in-three chance of also recording zero injury crashes. One in three. Tesla’s “impeccable” result is statistically indistinguishable from ordinary human driving at this sample size. Not better, not worse, just too small to tell.
For police-reported crashes, which occur at a rate of 4.85 per million miles, the expected count rises to 1.84, and the probability of zero events drops to 15.8%. Better optics for Tesla, but still far from the 5% threshold that would constitute statistical significance in any published study.
How Many Miles Does Tesla Actually Need?
For zero observed incidents to reach 95% confidence that the true rate is below the human baseline, the expected count under the null hypothesis must exceed 3.0. This means:
Required miles = 3.0 / 2.78 × 1,000,000 = 1,079,137 miles
Tesla needs approximately 1.08 million unsupervised miles to make a statistically credible safety claim based on zero incidents. That is 2.84 times its current total.
At the company’s current fleet size, this is not an insurmountable number. With roughly 50 vehicles (Tesla has described the fleet as “dozens”) each driving around 200 miles per day, the weekly mileage is approximately 70,000. At that pace, 1.08 million miles would take about 15 weeks, reachable by November 2026. But Tesla would need to sustain that pace without a single injury crash throughout. One incident resets the clock, and the required mileage jumps significantly, because the test then shifts from “can we reject the null at zero observations” to a rate-comparison test that demands even more data.
Six hundred and eleven expected human crashes against Waymo’s observed any-injury rate of 0.41 per million miles makes the 2.78 benchmark’s 85% reduction a result with overwhelming statistical confidence, the kind of p-value that makes peer reviewers stop reading the methodology section because it doesn’t matter anymore.
Fleet Scale: The Question Nobody Asked
Wells Fargo analyst Colin Langan asked the question that the rest of the call avoided: “Why is the number of vehicles still in the dozens as opposed to hundreds?”
Elluswamy’s response was revealing. “Even with a few vehicles, you can get a lot of miles out of them,” he said, before adding that growth in robotaxi miles is “literally exponential. Just, it’s in the early part of the exponential. That’s why it’s hard for others to comprehend.” Translation: trust us, the curve will bend up eventually, but we cannot show you yet because we have a few dozen cars driving through suburban side streets in six cities where the most dangerous thing on the road is a landscape truck making an illegal U-turn.
Numbers tell a less ambitious story. Tesla’s 380,000 unsupervised miles represent 0.17% of Waymo’s 220 million mile total. For every unsupervised mile Tesla has driven, Waymo has driven 579. Waymo covers 4 million miles every week, which means it accumulates Tesla’s entire unsupervised total roughly once per business day.
| Metric | Tesla (Q2 2026) | Waymo (March 2026) | Ratio |
|---|---|---|---|
| Unsupervised/autonomous miles | 380,000 | 220,000,000 | 1:579 |
| Weekly mileage | ~70,000 | 4,000,000 | 1:57 |
| Cities | 6 (limited zones) | 5 (full urban) | — |
| Statistical power for safety claims | None | Definitive | — |
| Injury rate vs. human baseline | Indeterminate | 85% lower | — |
Tesla did announce expansion to Tampa and Orlando the day before its earnings call, following several analyst reports noting the company had missed its own January target of seven metro areas by the end of June. But Reuters reported that service areas in these new cities, like in Miami and Houston before them, were “limited to less-trafficked neighborhoods outside the city centers.”
Waymo, by contrast, operates in full urban cores: downtown San Francisco, central Los Angeles, midtown Phoenix, east Austin, and central Atlanta. The Insurance Institute for Highway Safety confirmed a 68% lower crash involvement rate over 50 million driverless miles in these environments.
What $3 Million Per Mile Buys You
Tesla’s Q2 financials landed with a thud that the robotaxi narrative was supposed to cushion. Revenue of $28.24 billion beat the $26.42 billion estimate, but earnings per share of $0.33 missed the $0.50 consensus by 34%. Automotive gross margins excluding regulatory credits fell to 16.3%, the lowest in the company’s modern history. Free cash flow was negative $2.9 billion. The stock fell 14.5% on Thursday, its worst single-day drop of the year.
Running a standard valuation decomposition on these numbers reveals something extraordinary about what investors are actually pricing when they hold TSLA shares. Tesla’s trailing twelve-month earnings per share sit at $1.08. The traditional auto industry trades at roughly 6 times earnings, the median for GM, Ford, and Stellantis. At that multiple, Tesla’s car business is worth approximately $24.4 billion.
Tesla’s market capitalization is $1.18 trillion. Let that sit for a moment.
The difference, $1.156 trillion, is the implied value of everything that is not the current auto business: robotaxi, Optimus, Full Self-Driving subscriptions, energy storage, Terafab, and the Musk premium. Divide that implied AI premium by the 380,000 unsupervised robotaxi miles that constitute the company’s primary evidence for its autonomous driving capabilities, and investors are paying $3,041,000 per mile.
Even using the broader 2.5 million total robotaxi miles (including those with safety monitors), the price is $462,000 per mile. For context, building a mile of four-lane urban highway costs about $15 million. Tesla’s investors are paying roughly a fifth of that for each mile a modified Model Y has driven itself through a suburban Austin neighborhood.
The Capex Scissors
Tesla guided to $25 billion in 2026 capital expenditure, up from less than $10 billion in 2025. Q2 capex came in at $5.8 billion. That $25 billion annual figure equals 5.4 times Tesla’s annualized net income of $4.6 billion. It also represents 43% of General Motors’ entire $58 billion market capitalization.
Where is the money going? Terafab, a multibillion-dollar chip-manufacturing facility shared with SpaceX in Texas, absorbed a significant share. An Optimus production line has started construction at Fremont. An Austin facility is planned with an annual capacity of 10 million humanoid robots, a number that sounds like a typo until you remember this is a company that routinely announces plans whose timelines slip by years. All of this is happening while the core automotive margin that funds it continues eroding.
Morgan Stanley analyst Andrew Percoco captured the tension in his post-earnings note: “We view Tesla’s accelerating capex cycle as a necessary investment to secure leadership in autonomy and robotics. However, these investments push free cash flow further into negative territory, increasing focus on tangible Robotaxi and Optimus milestones.”
Milestones, as our Poisson test demonstrates, have not yet arrived in statistically meaningful form.
What “Notable” Means
There is an important qualifier buried in Tesla’s claim that most coverage missed entirely. Elluswamy said “zero notable incidents,” not “zero incidents.” Tesla has not published its definition of “notable.” He did add that “any reports have been of other actors impacting us when we were stationary.” Carefully constructed phrasing: it acknowledges that some events did occur, categorizes them as the other party’s fault, and restricts them to situations where the Tesla was not moving.
NHTSA’s Standing General Order database shows over 200 crashes involving Tesla automated driver assistance systems in recent months. These may involve Autopilot and Full Self-Driving on customer vehicles rather than the dedicated robotaxi fleet, but the distinction underscores a definitional gap: what Tesla counts as “robotaxi” and what it counts as “notable” can both shift the numbers.
Tesla’s Strongest Case
Dismissing Tesla’s robotaxi effort because of small sample sizes would be a mistake, even if the statistical critique is airtight, because the underlying technology trajectory deserves more nuance than the earnings call received.
Tesla has deployed a camera-only autonomous driving system that works, at some level, without LiDAR, without high-definition maps, and without radar. It costs orders of magnitude less per vehicle than Waymo’s sensor-laden Jaguar I-PACEs. If the software proves safe at scale, Tesla can retrofit millions of existing vehicles, something Waymo structurally cannot do because its custom sensor stacks require purpose-built hardware that takes months to assemble and calibrate.
Elluswamy’s exponential growth claim, if sustained, matters enormously. A double-digit weekly growth rate on a 70,000-mile-per-week base means Tesla could cross the 1.08 million-mile statistical significance threshold within four months without adding a single vehicle, just by running more hours. Adding vehicles accelerates the timeline further. At a 10% weekly compounding rate, Tesla would reach 220 million cumulative miles in roughly 18 months, closing the entire gap with Waymo’s current dataset by early 2028.
And camera-only economics are structurally superior for scale. Waymo’s per-vehicle sensor cost exceeds $75,000 on top of the base Jaguar I-PACE price. Tesla’s hardware cost is the standard production vehicle plus software. At scale, that gap could define the market.
What We Did Not Prove
This analysis has clear limitations. First, our Poisson model assumes a uniform crash probability per mile, which ignores the fact that Tesla’s robotaxi deliberately operates in lower-risk geofenced areas, the suburban side streets where the crash rate per mile is almost certainly below the 2.78 IPMM urban average.
Second, we used Waymo’s peer-reviewed benchmark study for the human crash rate because it is the best publicly available matched comparison, but other sources cite different base rates. A true apples-to-apples comparison would require crash data from Tesla’s exact operating areas, which does not exist in published form.
Third, our valuation decomposition is deliberately provocative. Tesla’s market premium reflects investor expectations across many product lines, and no serious analyst assigns the entire non-auto premium to robotaxi mileage alone. We did it to make a point. It worked, but treat it as illustration, not finance.
The Bottom Line
Tesla has built a working unsupervised robotaxi, a real engineering achievement that places it in a small club. But “impeccable safety” based on 380,000 miles is a narrative, not a finding, because a human driver recording an identical outcome has a probability of 34.8%, which is roughly the same odds as flipping two heads in a row. No peer-reviewed safety study would publish this sample size as evidence of superior performance.
Investors, trading Tesla at 290 times trailing earnings, have priced in a future where the exponential growth curve is real, the camera-only architecture wins, and the statistical significance arrives soon enough to justify spending $25 billion a year on capex while generating negative free cash flow. If any one of those assumptions breaks, $1.156 trillion in implied value has no empirical foundation under it. They are making a bet. It may prove brilliant. But right now, it rests on narrative, not data.
What You Can Do
If you are a Tesla investor: Demand that the company publish a NHTSA-standard safety report for its robotaxi fleet, including total incidents (not just “notable” ones), miles by operating domain, and disengagement rates. Waymo publishes this data quarterly. Tesla’s decision not to is a choice, not a limitation.
If you are evaluating robotaxi stocks: Watch for Tesla’s unsupervised mileage to cross 1.08 million miles. That is the minimum threshold for a zero-incident claim to reach 95% statistical confidence. If Tesla maintains its claimed growth rate, this could happen by November 2026. If it does not, the growth was not exponential.
If you ride in a robotaxi: Both Tesla and Waymo have safety records that, so far, suggest these vehicles are at least as safe as average human drivers and possibly much safer. The statistical critique applies to the precision of the claim, not to the safety of any individual ride. You are, on the available evidence, no less safe in a robotaxi than in an Uber.
If you are a regulator: The current self-certification regime means companies define their own safety metrics and publication schedules. A standardized reporting framework, comparable to aviation’s ASRS, would let the public evaluate competing safety claims on equal terms. The 380,000-mile announcement illustrates why voluntary disclosure produces marketing, not science.