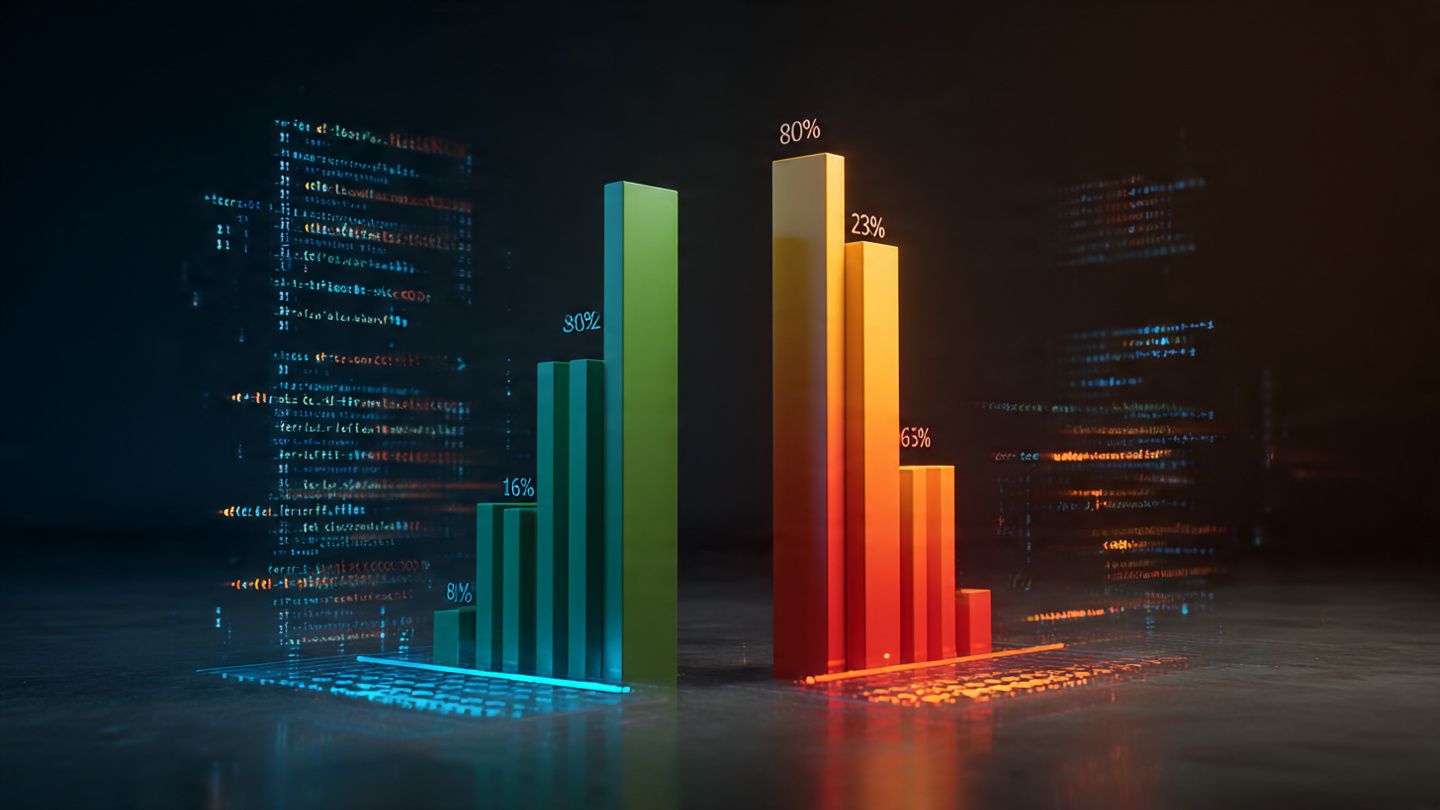
Five AI Models Hit 80% on Coding Benchmarks. The Real Number Is 23%.
Five frontier AI models cluster within 0.9% of each other at 80% on SWE-bench Verified, the industry's most-cited coding benchmark. On SWE-bench Pro, a contamination-resistant benchmark using real-world codebases, those same models drop to roughly 23%. That 3.5x gap is reshaping a $12 billion market built on the inflated number.
Three point five x.
That is the ratio between what AI coding models score on the benchmark companies cite in pitch decks and what they score on the benchmark designed to measure how they actually perform on real codebases. Five frontier models from four different providers now cluster between 80.0% and 80.9% on SWE-bench Verified, the leaderboard that dominates AI coding headlines. On SWE-bench Pro, built by Scale AI with contamination-resistant design, professional-grade codebases, and human-augmented task specifications, the best models solve roughly 23% of problems. Between those two numbers sits billions of dollars in misallocated corporate spending.
The Convergence at 80%
As of March 2026, the SWE-bench Verified leaderboard reads like a photo finish. Claude Opus 4.5 leads at 80.9%. Claude Opus 4.6 sits at 80.8%. Google's Gemini 3.1 Pro hits 80.6%. Open-weight MiniMax M2.5 reaches 80.2%. OpenAI's GPT-5.2 lands at 80.0%. Five models from four companies, all within 0.9 percentage points.
On its face, this looks like a ceiling. Four competing architectures, trained on different data, optimized with different methods, all converging on the same number. The obvious reading: AI can solve roughly 80% of software engineering tasks. Every marketing department at every AI coding tool vendor on Earth has drawn exactly this conclusion.
There is a different reading. SWE-bench Verified is a curated subset of 500 GitHub issues, mostly from Python utility libraries, with well-specified problem statements and clear test cases. OpenAI's own analysis notes that most issues in the original SWE-bench are estimated to take under an hour, and Verified pushes further toward short-duration tasks. Models have likely seen portions of these repositories during training. And the scores are self-reported by model providers using their own optimized scaffolds.
In other words, five models have gotten very good at solving a specific kind of problem, measured in a specific way, reported by the people selling the models.
Enter SWE-bench Pro
Scale AI released SWE-bench Pro with a different philosophy. The benchmark contains 1,865 tasks across 41 professional repositories, sourced from three categories: open-source code under strong copyleft licenses (creating legal barriers to training data inclusion), proprietary startup codebases (276 tasks that no model could have seen), and a held-out private evaluation set.
Problems are harder in ways that map to real engineering work. Reference solutions average 107.4 lines of code changed across 4.1 files. Tasks come from consumer applications, B2B platforms, and developer tools. Human experts augment issue descriptions rather than discarding under-specified problems, because production engineering runs on under-specified problems.
The results are dramatic. On the Pro public set (731 GPL-licensed tasks), top models resolve roughly 23% of problems. Scale AI's own page states it plainly: "top models score around 23% on the SWE-Bench Pro public set, compared to 70%+ on SWE-Bench Verified." Separate evaluations using full Pro benchmarks with vendor-optimized agents show higher numbers: GPT-5.3-Codex reaches 56.8% with its own scaffold, and on Scale AI's SEAL leaderboard with a standardized scaffold, Claude Opus 4.5 leads at 45.9%. Even at 45.9%, the gap between self-reported Verified (80.9%) and standardized Pro is nearly 2x.
The Scaffold Problem
A "scaffold" is the wrapper code that turns a language model into a coding agent. It decides how the model reads the repository, plans its approach, writes code, runs tests, and iterates. The same model can produce wildly different benchmark scores depending on which scaffold it uses.
Consider the most dramatic example: xAI self-reports 72-75% for Grok 4 on SWE-bench Verified. Independent testing by vals.ai using the SWE-agent scaffold shows 58.6%. That is a 14-17 percentage point gap from scaffold choice alone. Same model. Different wrapper.
This is not cheating. Vendors are optimizing their deployment environments, which is exactly what they will do for customers. But it means that headline benchmark scores reflect an upper bound achieved under ideal conditions with custom tooling. A company deploying the same model through its own infrastructure, with its own codebase structure and its own CI/CD pipeline, will not reproduce the headline number.
The Inflation Multiplier
Here is the original calculation that nobody in the industry seems to be running.
There are at least three independent sources of score inflation between what vendors report and what companies experience:
| Inflation Source | Measured Gap | Multiplier |
|---|---|---|
| Benchmark difficulty (Verified vs Pro) | 80.9% vs ~23% | 3.5x |
| Scaffold optimization (self-reported vs standardized) | 73.5% vs 58.6% (Grok 4) | 1.25x |
| Task scoping (hour-long vs multi-day) | 80% on short tasks, performance drops "sharply" on multi-file edits | Unknown but directional |
These factors compound. A CTO reading "80% solve rate" and planning headcount around it is operating on a number that may be inflated by 3.5x or more relative to what the model will actually resolve in their codebase.
Here is the dollar figure. Consider a team of 10 engineers at an average fully-loaded cost of $200,000 each, which is $2 million annually. If you believe the 80% narrative, you might conclude that AI can handle 80% of the ticket queue, and you can run the team with 4-5 engineers plus AI tooling. Potential savings: $1-1.2 million per year. If the actual resolve rate on your codebase is closer to 23%, AI handles the well-specified, single-file, short-duration tickets, and you still need 8-9 engineers for everything else. Actual savings: $200,000-400,000, mostly from autocomplete acceleration on routine work. Between assumed ROI and actual ROI sits a $600,000-800,000 gap per year, per 10-engineer team.
Where AI Coding Actually Works (and Where It Doesn't)
SWE-bench Pro's data reveals a jagged capability profile. Performance varies heavily by repository, with some repos staying under 10% for all models while others allow above 50% for certain models. Language matters too: Python and Go score higher, while JavaScript and TypeScript show more erratic results. Resolve rates drop sharply as fixes require more lines changed and more files edited.
This matches what practitioners report. GitHub Copilot now generates 46% of all code written by its 20 million users, but developers accept only 21.2-23.5% of its suggestions. Accepted code skews heavily toward boilerplate, test scaffolding, and formulaic patterns. A controlled GitHub experiment showed developers completing an HTTP server writing task 55% faster with Copilot. That is real value. But "complete a well-specified task faster" is a different claim from "solve 80% of your engineering problems autonomously."
Wall Street does not make this distinction. AI coding tools reached $4-5 billion in revenue in 2025 and are projected to hit $12-15 billion by 2027. GitHub Copilot holds 42% market share, deployed across 90% of Fortune 100 companies. Cursor captured 18% share with annualized revenue exceeding $500 million. These are real products delivering real value. What matters is whether the value matches the benchmark narrative that sells them.
Why the Convergence Is a Ceiling, Not a Stepping Stone
That five-model pileup at 80% on Verified deserves closer scrutiny. When multiple architectures trained on different data converge on the same score, one explanation is that they have all reached a performance ceiling determined by the benchmark itself, not by the underlying task.
SWE-bench Verified contains 500 problems. Models trained on trillions of tokens have almost certainly seen at least some of the relevant codebases during training. Problems skew toward well-specified issues in popular Python libraries. At some point, you are not measuring "can this model do software engineering" but "has this model memorized enough of the Python ecosystem to reproduce known fixes."
SWE-bench Pro exists precisely to test this hypothesis. Its copyleft licensing strategy and proprietary codebase subset create legal and access barriers against training contamination. That 3.5x drop in performance when those barriers are in place suggests that a meaningful fraction of the Verified score reflects familiarity, not generalization.
Consider how benchmark scores improved over time. According to marc0.dev's historical data, the top SWE-bench Verified score jumped from around 65% in early 2025 to 80.9% in March 2026. That 16-point gain over 14 months looks like rapid progress. But Pro was explicitly designed to resist the strategies that drive Verified scores up. Whether Pro scores will show comparable gains as models improve, or whether they will reveal that Verified progress was partly contamination-driven, remains an open question.
The Strongest Counterargument
Here is the most compelling case against this analysis: SWE-bench Verified and Pro measure different things, and the "right" number depends on how you deploy AI. Verified's task distribution, with well-specified issues, clear test cases, and single-repo scope, is closer to how smart engineering teams actually assign work to AI agents. You do not throw a vague multi-day project at an AI. You scope the ticket carefully, provide context, and let the model handle the tractable parts.
Under this framing, 80% is not inflated. It is the performance ceiling for the kind of work you would actually assign to AI, and the 23% on Pro reflects tasks you would never delegate in the first place. The true measure is not the raw benchmark score but the score on the subset of tasks that match your deployment pattern.
This is a reasonable position. It also means the 80% headline is even more misleading, because it implies breadth that the number does not contain. "80% of well-scoped, single-file, hour-long Python library fixes" and "80% of software engineering" are different claims. Marketing materials cite the latter.
Limitations
SWE-bench Pro is newer than Verified and has been evaluated by fewer models. Its approximate "~23%" figure is a top score as of early 2026, and model-by-model numbers vary depending on scaffold and evaluation methodology. Dollar-value calculations in this article assume a specific team structure and median Silicon Valley compensation and do not account for AI's value in code review, documentation, onboarding acceleration, and learning, all of which are real but harder to quantify. Copilot-style autocomplete and autonomous agent coding are different use cases with different performance profiles, and this analysis focuses primarily on the agent paradigm.
The Bottom Line
If you are making headcount decisions based on AI coding benchmarks, you are working with a number that is inflated by at least 3.5x. That five-model pileup at 80% on SWE-bench Verified is not a measure of software engineering capability. It is a measure of how well language models perform on a specific, potentially contaminated benchmark of short Python tasks under optimized conditions. SWE-bench Pro tells a less flattering story, and it is the story that maps to your codebase. AI coding tools are genuinely useful. They are not 80% of an engineer.