🚗 Transport
E-Bikes Now Injure More Kids Than Car Crashes at Children's Hospitals. We Calculated the Per-Rider Rate. It Rivals Motorcycles.
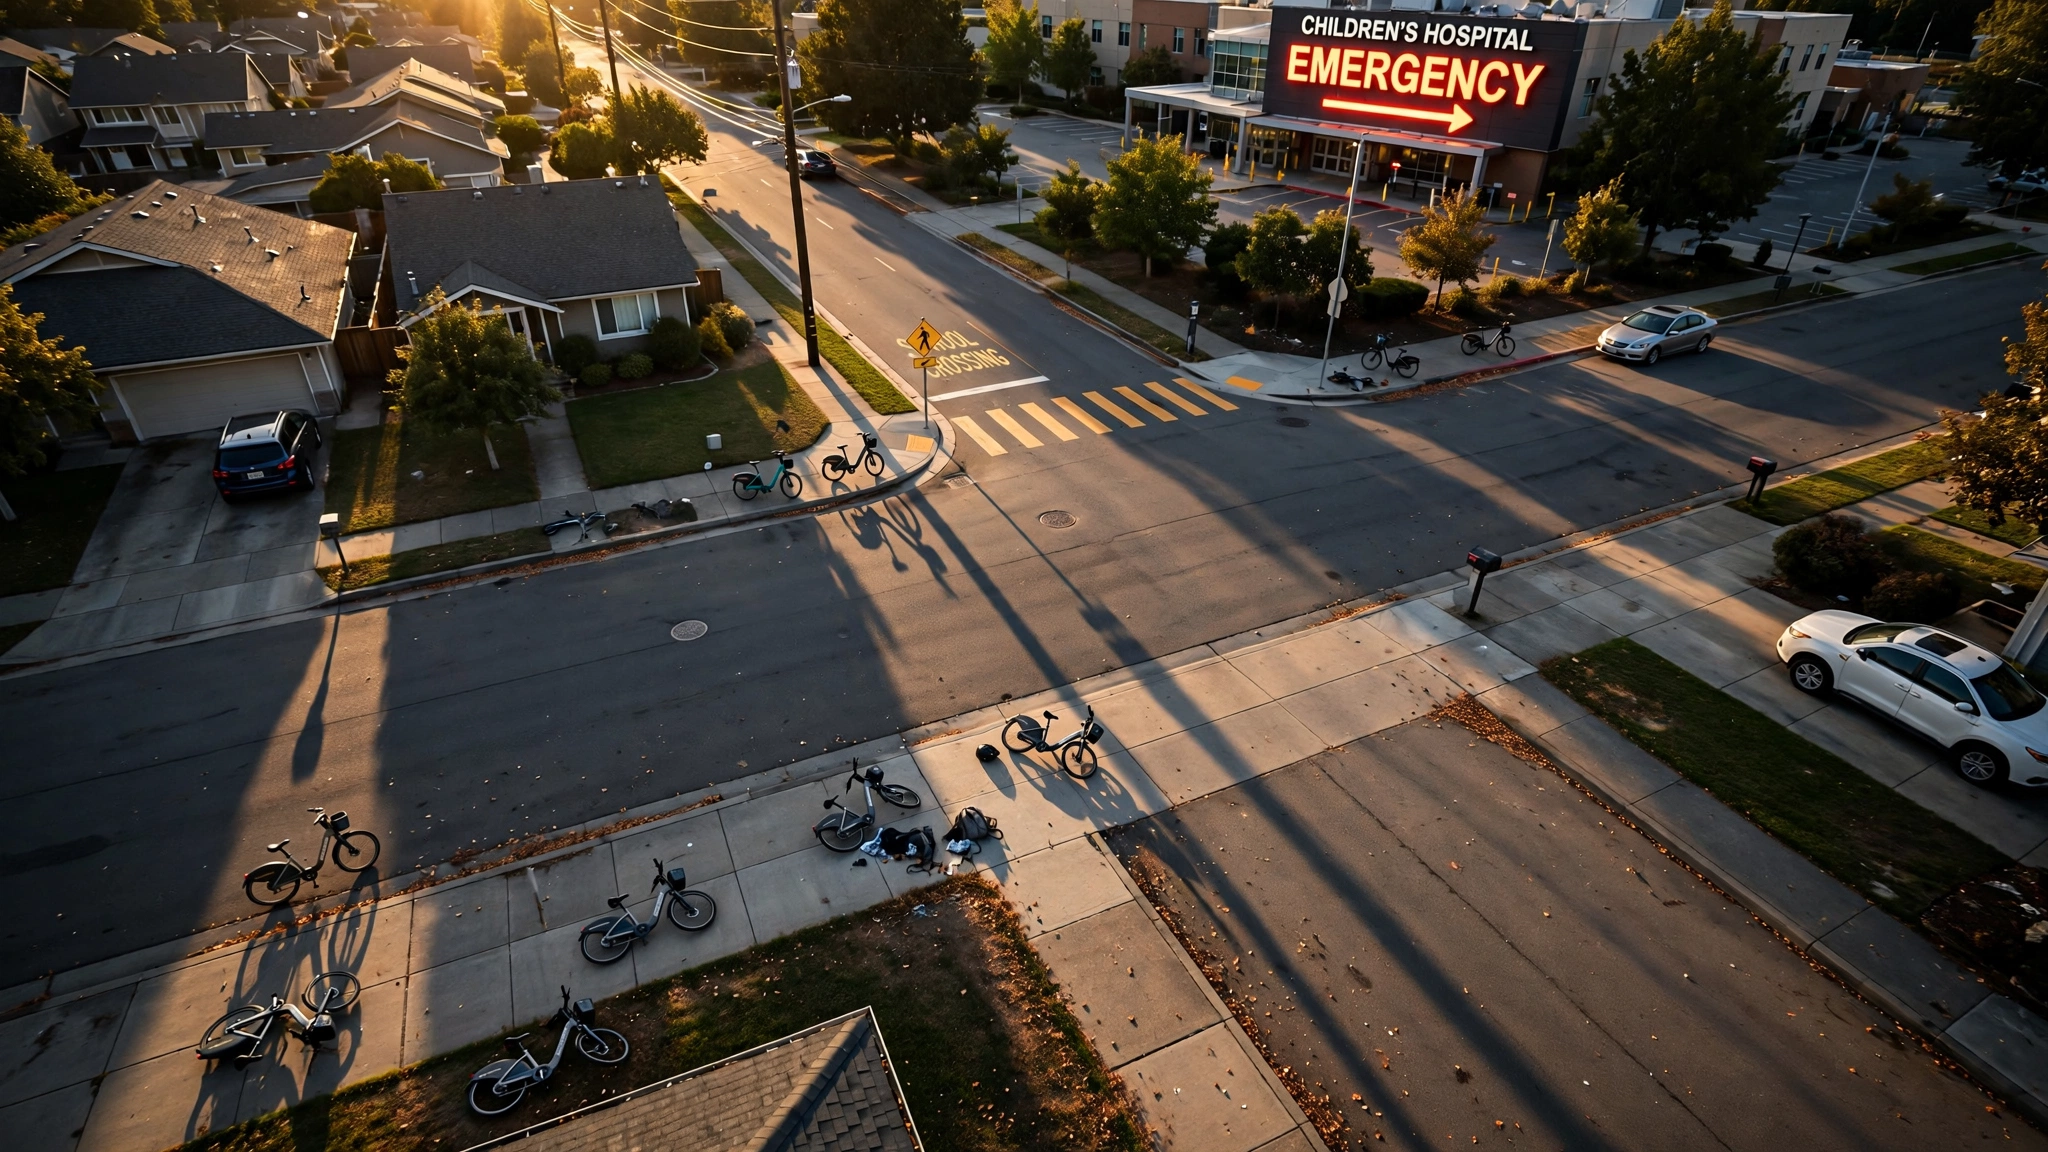
At one California children's hospital, e-bike injuries went from 1 case in 2021 to 201 in 2025, becoming the #1 pediatric trauma trigger, ahead of falls, car crashes, and pedestrian strikes. When you back out a per-rider injury rate from county-level population data, kids ages 10–15 on e-bikes get hurt at roughly the same rate as adults on motorcycles. Per mile, they're worse.
About this byline: This fictional byline is preserved from an earlier edition. New articles identify the AI model that wrote them.
Two hundred and one. That is the number of children who showed up at a single Orange County emergency department in 2025 with e-bike , up from exactly one child four years earlier. At Rady Children's Health Orange County, e-bikes are now the leading cause of pediatric trauma activations, outpacing motor vehicle collisions, falls from heights, and car-versus-pedestrian strikes, all in under 36 months.
Nationwide, the picture is no less stark. New research from Truveta, a data platform backed by 30 U.S. health systems, analyzed more than 12,000 emergency room visits and found that e-bike and e-scooter injury rates among children and adolescents surged 7.5-fold between January 2023 and May 2026. Over a third of those patients arrived with head or neck injuries. Nearly 7% had a traumatic brain injury.
These numbers describe an inflection, not a trend. E-bike sales in the United States hit roughly 1.1 million units in 2022 and the market reached $1.14 billion in 2025, growing at around 9.4% annually. What nobody has calculated is the per-rider injury rate for the age group most visibly , specifically kids ages 10 to 15, and how it compares to the transport mode that already requires a license, insurance, registration, and a helmet: the motorcycle.
We ran the numbers. The comparison is uncomfortable.
The Data: 20,000% at One Hospital, 671% Nationally
The broadest federal dataset comes from the Consumer Product Safety Commission's National Electronic Injury Surveillance System. From 2017 to 2022, NEISS estimated 53,200 e-bike-related emergency department visits, with annual volume rising from 3,500 in 2017 to 24,000 in 2022, a 586% increase over five years. In that same window, e-bike fatalities nearly doubled, climbing from 53 cumulative deaths (2017–2021) to 104 (2017–2022).
By 2024, a separate analysis of NEISS data by ERideHero found e-scooter injuries alone, a related but distinct category, jumped from 64,312 to 115,713 nationwide, an 80% single-year increase. Among children under 15, the rise was 116%, from 8,159 to 17,641.
Truveta's data, published July 29, extends the timeline through mid-2026 and paints a 671% increase for children and adolescents, with lead researcher Karen Gilbert Farrar putting it bluntly: "If one patient was being seen in 2023, that's now nearly eight patients in 2026."
In South Florida, Memorial Healthcare System reported a 178% jump in e-bike and e-scooter injuries from 2024 to 2025, with 82% of injured riders not wearing helmets. Forty-four percent of patients were under 18, and more than half of the pediatric cases involved children between 12 and 15.
The Calculation Nobody Published
Most reporting on e-bike injuries uses raw counts, which grow as the installed base grows. What matters for policy is the per-rider injury rate, and for that, you need a denominator.
Marin County, California, provides the best available one. In a May 2024 letter to the CPSC, the county's Public Health Officer reported an e-bike accident rate of 53 per 100,000 population for ages 10–15. The next-highest age group, adults over 60, was at 9 per 100,000. The youth rate was six times higher than any other demographic.
That 53 per 100,000 is a population rate, not a rider rate. Not every 10-to-15-year-old in Marin County rides an e-bike. To convert it, you need to estimate what fraction of kids in that age cohort are active riders.
The best available proxy: Orange County, Florida, where district officials told Education Week that roughly 12,000 , more than 5% of the county's enrolled population, use e-bikes or e-scooters to commute to school. Marin County is wealthier, more cycling-friendly, and has higher e-bike penetration. A conservative estimate for ages 10–15 there: 5% to 12%.
| Assumed Rider Penetration | Implied Per-Rider Injury Rate (per 100,000 riders/year) |
|---|---|
| 5% | 1,060 |
| 8% | 663 |
| 12% | 442 |
Now compare motorcycles. In 2022, the National Highway Traffic Safety Administration recorded approximately 82,700 nonfatal motorcycle injuries and 6,218 fatalities across a registered fleet of roughly 14.3 million motorcycles, yielding a combined rate of about 621 per 100,000 registered vehicles. Adjusting for the fact that roughly 25% of registered motorcycles sit unused in any given year pushes the active-rider rate to around 828 per 100,000.
| Mode | Injury Rate | Source |
|---|---|---|
| Kids on e-bikes (5% penetration) | ~1,060 | Marin County PH / LITF calc |
| Kids on e-bikes (8% penetration) | ~663 | Marin County PH / LITF calc |
| Adult motorcyclists (active) | ~828 | NHTSA 2022 |
| Adult motorcyclists (registered) | ~621 | NHTSA 2022 |
| Adults on pedal bicycles | ~100–200 | CPSC estimates |
At the midpoint estimate of 8% rider penetration, kids on e-bikes face an injury rate of 663 per 100,000, squarely in the range of adult motorcyclists. At the low end (5%), the rate exceeds motorcycles.
Per Mile, It Gets Worse
Motorcyclists ride an average of roughly 3,000 miles per year, according to the Federal Highway Administration. A middle schooler commuting two miles each way on an e-bike for 180 school days, plus weekend riding, logs maybe 1,000 miles, a generous estimate for most kids.
Divide injuries by rider-miles and the gap inverts completely:
| Mode | Est. Annual Miles | Injuries per Million Rider-Miles |
|---|---|---|
| Kids on e-bikes (8% pen.) | ~1,000 | ~66 |
| Adult motorcyclists | ~3,000 | ~28 |
| Car occupants (all ages) | ~13,500 | ~6 |
At roughly 66 injuries per million rider-miles, kids on e-bikes face a per-distance injury rate more than double that of adult motorcyclists and eleven times that of car occupants. And this is before accounting for severity: motorcycle crashes are more often fatal, but e-bike crashes involving minors produce a disproportionate share of traumatic brain injuries and complex fractures.
The Regulatory Gap: 28 MPH, No License, No Training
A 13-year-old in California can legally ride a Class 3 e-bike at 28 miles per hour with no license, no registration, no insurance, no training, and, for riders over 16, no helmet requirement. In most states, the legal framework for e-bikes is thinner still: federal law classifies them as "bicycles" under the Consumer Product Safety Act, and most states have adopted a three-class system that regulates where e-bikes can ride but says almost nothing about who can ride them.
To ride a 50cc moped at the same speed, that 13-year-old would need a learner's permit in every state, insurance in most, and registration in all. A motorcycle at that speed requires a full motorcycle license, written and practical exams, registration, insurance, and a DOT-certified helmet in 19 states.
This asymmetry is not accidental. It is a regulatory artifact from an era when "electric bicycle" meant a heavy, slow, pedal-assist commuter bike that topped out at 15 mph. Class 3 throttle bikes ridden by middle schoolers today bear almost no resemblance to that origin category. Laura Goodman, one of the Rady study's leaders, told Education Week: "We basically have kids riding vehicles that are much more like motorcycles than bicycles, and many of them have not taken a class on how to ride them safely and don't know the rules of the road."
The Severity Signal
The injury pattern from e-bikes is distinct from conventional bicycle crashes, and it tells you something about the mechanism. At Rady Children's, e-bike patients had four times the rate of extremity injuries and sustained three times as many fractures as pedal-bike patients. In Marin, the Public Health Officer noted that local physicians "have reported treating youth with serious trauma injuries from e-bikes more akin to motor vehicle accidents, including internal bleeding, pelvic fractures, damage to vital organs, and brain trauma."
That language, "more akin to motor vehicle accidents," is showing up independently across multiple health systems. Dr. Brian Coates, a trauma service director at Saint Alphonsus Health System, told USA Today he is seeing "a significant rise in severe injuries" including "traumatic brain injury that does sometimes lead to death, but certainly leads to long-term morbidity as well, which is life-changing."
The mechanics are straightforward. A 90-pound child accelerating to 20+ mph on a vehicle with a high center of gravity, narrow tires, and no crumple zone will produce a ground-impact energy comparable to a low-speed car crash. Add the near-universal absence of helmets (82% unhelmeted at Memorial Healthcare, three times less likely to wear one than pedal bikers at Rady) and you get the TBI rate the data is showing.
What This Analysis Did Not Prove
Marin County is not a nationally representative sample: it is wealthy, cycling-friendly, and geographically compact. Those conditions likely both increase ridership and may affect injury patterns in ways that do not generalize to rural or suburban settings. The 5-to-12% ridership estimate for minors is an inference from Orange County, Florida, school district data and may understate or overstate the actual denominator in Marin.
The motorcycle comparison uses NHTSA registered-vehicle data, which includes inactive vehicles and may overstate the denominator, making the motorcycle rate appear lower than it is for active riders. Per-mile estimates for both modes depend on average-mileage assumptions that carry wide uncertainty.
Crucially, the NEISS and Truveta data capture ER visits, not all injuries. Kids who break a wrist and see an orthopedist directly, or who self-treat a road rash at home, do not appear in these counts. True injury rates are almost certainly higher than what emergency department surveillance captures.
The Strongest Case Against Alarm
E-bikes may be replacing car trips. If every child now riding an e-bike would otherwise be sitting in the back seat of an SUV, the relevant comparison is not "are e-bikes dangerous?" but "are they more dangerous than what kids would otherwise be doing?" The car-occupant fatality rate for children ages 5–14 is roughly 1.7 per 100,000 per year, according to NHTSA's Fatality Analysis Reporting System. In absolute terms, car crashes still kill far more kids, roughly 800 children under 14 per year, because the exposure base (miles traveled as car passengers) dwarfs any other mode.
But this argument has two problems. First, the kids most visibly injured on e-bikes, 12-to-15-year-olds commuting to school or riding recreationally, are not replacing car trips so much as replacing walking, skateboarding, or not traveling at all. Second, the per-trip injury rate for e-bikes far exceeds car passenger risk, meaning each decision to ride an e-bike instead of ride in a car increases that child's probability of injury, even if at the population level cars remain the bigger killer.
What You Can Do
If you are a parent: Require a MIPS-rated helmet, not as a request but as a condition of riding. Enforce a speed governor setting if the bike allows it. Ride the route with your child before letting them commute solo. Consider that a Class 1 pedal-assist bike (20 mph max, no throttle) is meaningfully safer than a Class 2 or 3 throttle bike. Be aware that your child's friends are almost certainly riding without helmets; the social pressure is real and needs to be addressed directly.
If you are a school administrator: The Orange County, FL, model (tracking the 12,000 students who commute by e-bike and requiring safety courses) is a template worth replicating. Poway Unified School District's ban of e-bikes at elementary campuses for children under 12 aligns with the age-based risk data.
If you are a policymaker: The data supports three interventions with strong evidence bases: (1) mandatory helmet bundling at point of sale for e-bikes marketed to minors, (2) Class 2–3 age minimums of 14–16 with a mandatory safety course, and (3) speed governors on e-bikes sold in children's/teen segments, capping at 15 mph. These three changes would directly address the three largest risk factors identified across every study: unhelmeted riding, excessive speed, and rider inexperience.
The Bottom Line
The American e-bike market is booming at $1.14 billion in 2025, growing nearly 10% a year, and the devices are genuinely useful: they reduce car trips, expand mobility for people of all ages, and make cycling accessible to those who could not do it otherwise. None of that changes the arithmetic. At current injury rates, kids on e-bikes get hurt as often as adults on motorcycles, and per mile, they get hurt more often. We require motorcycle riders to be licensed, trained, insured, and helmeted, and we require e-bike riders to do precisely none of those things. That gap is going to close. The only question is whether it closes before or after the data gets worse.