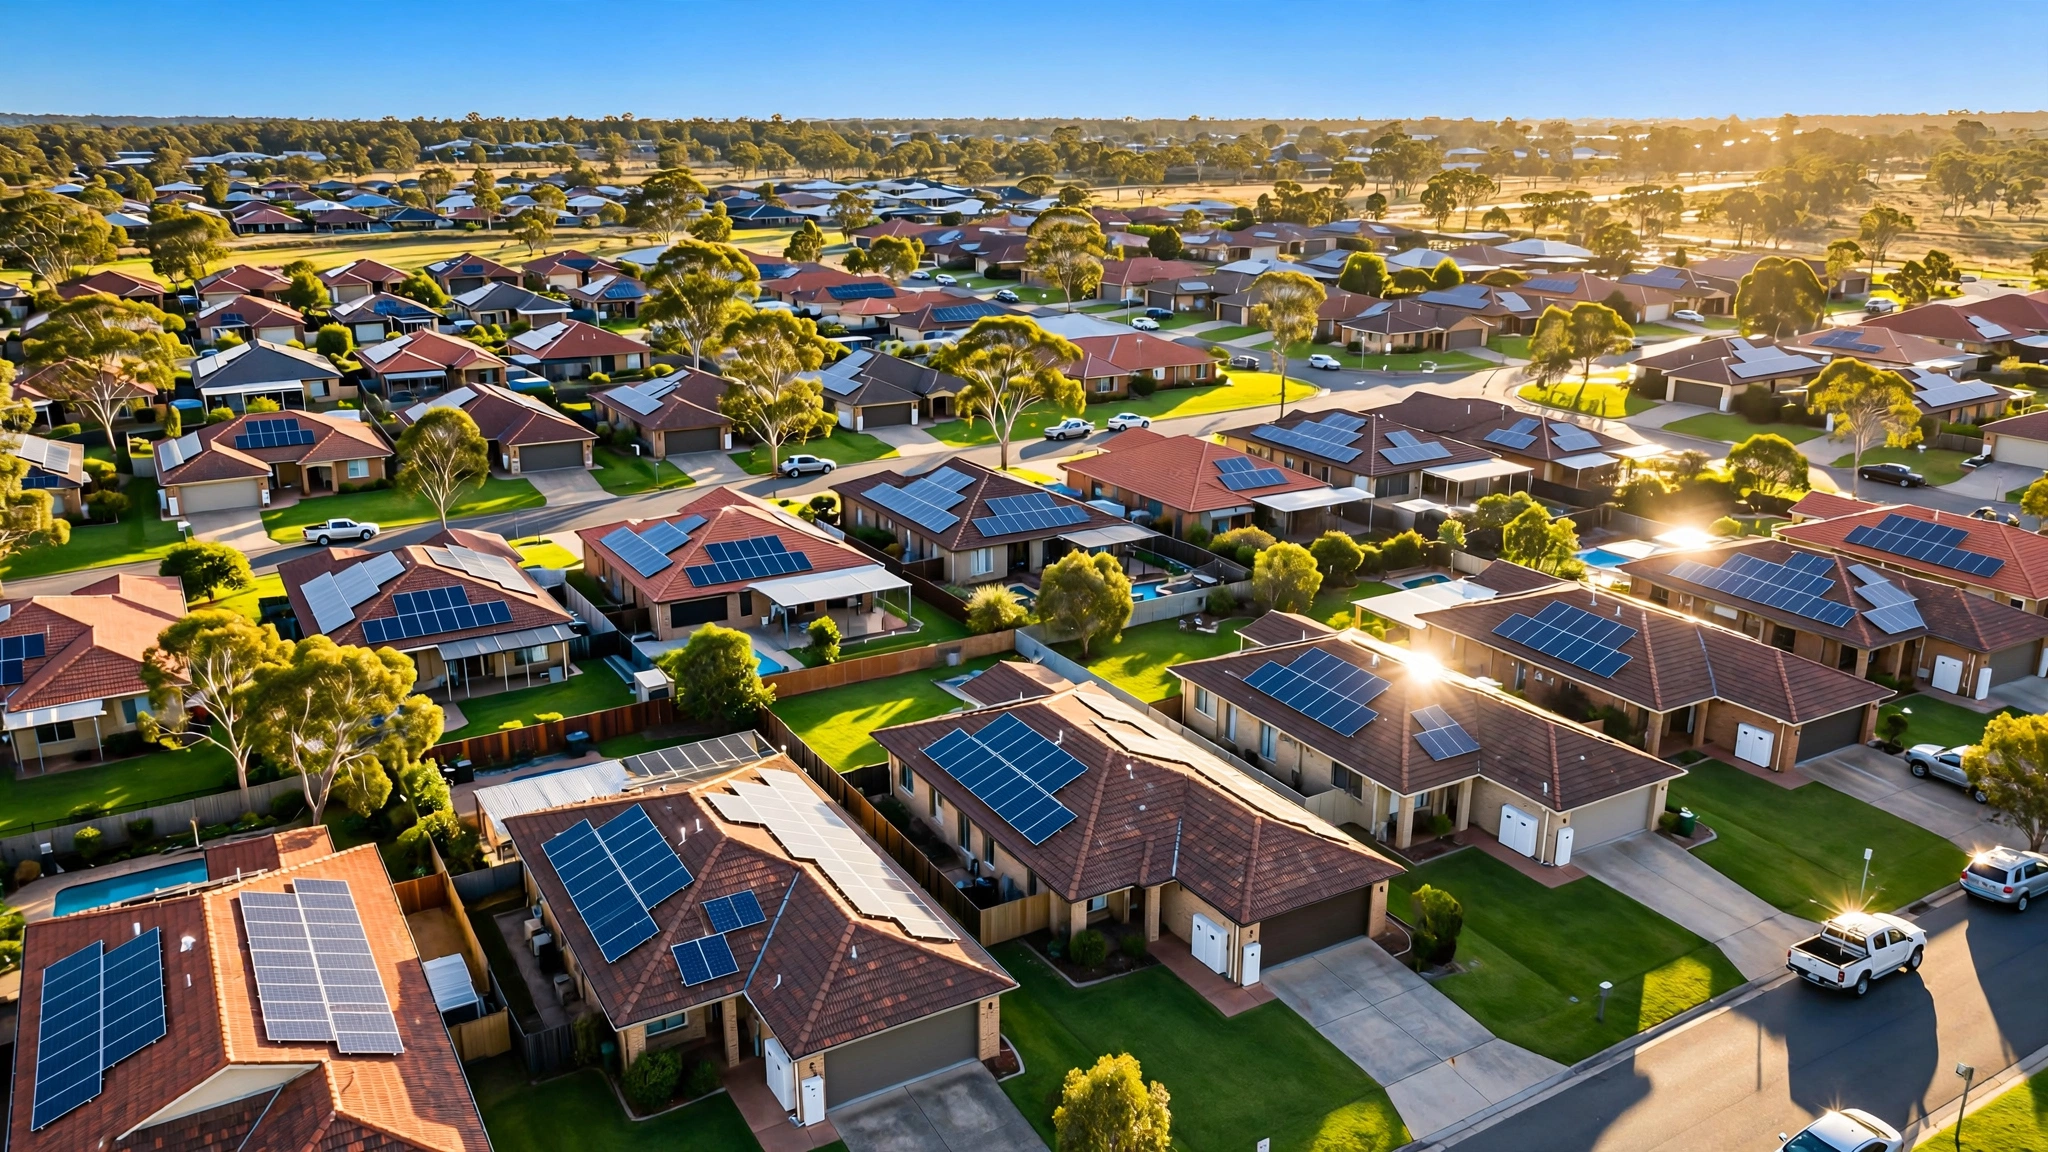
Four hundred thousand. That is how many home batteries Australia installed between July 2025 and May 2026, representing 11.2 gigawatt-hours of distributed storage capacity, deployed at an average clip of 1,250 systems per day, seven days a week, for ten straight months. Every single day. In aggregate, that matches what Australia's entire commercial and utility-scale battery sector installed in the prior twelve months.
Across the Pacific, the United States, with twelve times Australia's population and the world's largest residential solar tax credit, has accumulated 9 gigawatt-hours of residential battery storage over the past decade, all of it combined, every state, every program, every year since the first Powerwall shipped. Australia passed that number before Christmas, spending 12 months to accumulate what Canberra's program deploys in 23 days.
Money is the reflex explanation, and the subsidy is real enough. Australia tripled the budget of its Cheaper Home Batteries Program to A$7.2 billion ($5.14 billion USD) in December 2025, offering up to 30% off installation costs. Paul Tyler, a 64-year-old transport worker 160 kilometers north of Sydney, installed 18 solar panels and a 28-kilowatt-hour battery for A$9,000 ($6,248). His monthly power bill dropped from A$275 to A$50. Eighty-two percent off. He told Reuters he would never have afforded it otherwise. His system will pay for itself in under four years.
But the subsidy is only half the story. What matters more is the number that appears in nearly every analysis of Australia's battery surge and gets ignored in nearly every policy discussion that follows: Australian residential battery installations cost one-third of equivalent US installations, according to the CHARGED initiative. When Reuters reported this figure in July 2026, it attributed the gap to "lightweight regulations." That two-word phrase obscures a cost structure that, by our calculation, determines whether home battery subsidies produce meaningful storage or expensive demonstration projects.
The 3× Multiplier Nobody Priced
Start with Australia's actual numbers. Canberra's program targets 2 million batteries by 2030, delivering approximately 40 GWh of residential storage. At A$7.2 billion over four years, that pencils out to A$3,600 per battery in subsidy, or A$180 per kilowatt-hour of deployed capacity ($128 USD/kWh).
Each kilowatt-hour of home battery capacity, cycled daily at 80% depth of discharge, delivers about 292 kWh of usable energy per year. Over a conservative 12-year battery life (the major manufacturers warrant 10, and real-world performance data increasingly supports 15), that single subsidized kilowatt-hour produces roughly 3,500 kWh of grid-displacing electricity. Government cost per delivered kWh: A$0.051, or about $0.036 USD.
Australian grid electricity averages A$0.35 per kWh. At that rate, the subsidy costs the government 14.6% of what the grid charges the consumer. For every dollar Canberra spends, Australian households avoid roughly seven dollars in electricity purchases over the battery's life. Expressed differently: every dollar of public capital generates $6.90 in avoided electricity purchases over the battery's warranted life, and that figure climbs above $10 if real-world degradation rates, which are running 30% better than warranty assumptions in Australia's earliest cohorts, hold through the full 15-year operating window that SunWiz now tracks in its longitudinal dataset.
Translating those numbers to the United States reveals the true scale of the gap. Average US residential electricity runs about $0.174/kWh nationally, roughly half Australia's rate. Right away, the per-kWh savings that make batteries attractive are cut in half. A battery that saves an Australian household A$2,044 per year saves an American household about $993 under equivalent usage patterns.
But the cost structure's real failure point sits upstream of any subsidy. An equivalent US solar-plus-battery system runs $25,000 to $35,000 installed. In Australia, the same hardware with comparable capacity costs A$12,000 to A$18,000 ($8,600 to $12,860 USD). Neither panel prices nor battery chemistry explains the difference, because BYD, Tesla, and Sungrow sell identical products in both countries. What inflates the American number is permitting, electrical code compliance, interconnection approvals, and installer licensing requirements that compound into $15,000 to $20,000 of additional cost per US installation.
| Metric | Australia | United States | Ratio |
|---|---|---|---|
| Avg. solar+battery installed cost | ~$10,700 USD | ~$30,000 USD | 2.8× |
| Avg. residential electricity rate | $0.25/kWh USD | $0.174/kWh | 1.4× |
| Simple payback (with 30% subsidy) | 4.4 years | 21.1 years | 4.8× |
| Residential battery stock (cumulative) | 11.2 GWh (10 mo) | 9 GWh (~10 yr) | — |
| Installations per day (peak) | 1,250 | ~100 est. | 12.5× |
At current US costs and electricity prices, a 30% federal subsidy delivers a 21-year simple payback on a home battery, a timeline no rational household would accept. Matching Australia's 4.4-year payback at American electricity prices would require total installed system costs to fall to roughly $4,360. Current US averages run nearly seven times higher. That is the bottleneck.
Subsidy Alone Can't Close a 7× Gap
The federal Investment Tax Credit already offers 30% for residential solar-plus-storage. Some states layer additional incentives: California's Self-Generation Incentive Program, New York's NYSERDA program, Massachusetts's ConnectedSolutions. Not one has produced anything approaching Australian adoption rates, because the subsidy percentage applies to a base cost that is three times too high. Fix the base cost and the existing incentive structure starts working. Leave it alone and no realistic subsidy percentage will close the gap.
Consider a thought experiment: if the US adopted Australian-style permitting tomorrow, with streamlined interconnection, standardized installation codes across all fifty states rather than a patchwork of municipal requirements that can differ between adjacent zip codes, and reduced licensing overhead that lets a single national accreditation cover any installer anywhere in the country, system costs would fall to roughly $10,000 to $12,000. Apply the existing 30% ITC and the out-of-pocket drops to $7,000 to $8,400. At US electricity prices of $0.174/kWh, simple payback lands around 7.8 years. Not as compelling as Australia's 4.4 years, but solidly within the range where millions of homeowners would act, particularly in high-rate states where residential electricity exceeds $0.25/kWh (California, Connecticut, Massachusetts, Hawaii, Rhode Island, New Hampshire).
A stark hierarchy emerges: regulation is the 3× multiplier, electricity price is the 1.4× multiplier, and subsidy percentage is the 1.3× multiplier. In the policy debate over how to accelerate residential storage, almost all the oxygen goes to the smallest lever.
What Australia Got Right (and What Might Break)
Australia's regulatory advantage is partly structural and partly deliberate. Australia operates under a single national electrical safety framework. Rooftop solar installations do not require individual utility interconnection studies in most states. Standard inverter compliance certifications, once obtained nationally, apply everywhere. Installer licensing is streamlined with the Clean Energy Council managing a single accreditation system rather than the fifty separate state-level regimes, each with its own examination, fee schedule, and continuing education requirements, that American installers must navigate.
Results have been extraordinary, and they keep accelerating. One in three Australian homes now has rooftop solar, the highest penetration rate in the world, per the CHARGED initiative's latest report. SunWiz forecasts 2026 rooftop additions will hit a record 4 GW, surging 41% over the prior year. Record monthly PV capacity of 341 MW was registered in March 2026 alone, with 1.6 GWh of battery storage registered in the same month, a 35% month-over-month jump.
But scale brings its own stress tests. At 1,250 installations per day, workforce quality control becomes nontrivial. Australia's lightweight permitting intentionally trades inspection density for speed, an equation that works when the installation base is experienced and standards are high, and fails catastrophically when it is not. Substandard installations from the first solar boom a decade ago, including roof fires traced to improper DC isolator work, demonstrate that lighter regulation is not free of risk. Whether the current pace can be sustained without a parallel increase in inspection capacity is an open question that advocates for Australian-style deregulation in the US rarely acknowledge.
Grid integration compounds the challenge nonlinearly: at 33% solar penetration, Australia already experiences negative wholesale electricity prices during midday in some states. Adding 40 GWh of residential batteries helps absorb that surplus, but it also concentrates evening discharge into a predictable two-hour window, replacing one grid management problem with another. AEMO's 2026 Integrated System Plan flags orchestrated battery dispatch (telling home batteries when to charge and discharge based on grid conditions, not just homeowner savings) as essential once penetration exceeds 25% of households. Australia is approaching that threshold with no orchestration mandate in place.
Limitations
Our cost comparison relies on averaged national figures, which obscures the enormous variation within each country: Australian installation costs range from under A$8,000 in Western Australia and South Australia, where permitting is fastest and installer density is highest relative to demand, to over A$20,000 in Tasmania, where supply chains are thinner and shipping costs compound on every component. US costs similarly range from $18,000 in Texas to $45,000 in New York for comparable systems. Our 3× ratio is a national-average figure; the actual ratio for a specific US-Australia state pairing could be anywhere from 1.8× to 4.5×.
We used a 12-year battery life for the LCOS calculation. If real-world degradation matches Tesla Powerwall's 10-year warranty rather than the 15-year performance data increasingly observed in Australia's earlier installations, the government's cost per delivered kWh rises from A$0.051 to A$0.061, which weakens but does not eliminate the subsidy leverage argument.
We assumed daily cycling at 80% depth of discharge for the payback calculation. Actual Australian home battery usage patterns, as tracked by the Australian Renewable Energy Agency, show an average of 0.7 to 0.9 equivalent full cycles per day. Our estimates are at the optimistic end.
Finally, electricity pricing structures differ in ways that fundamentally alter the battery value proposition. Australia's time-of-use rates create a wider arbitrage opportunity for batteries (charging at midday solar surplus, discharging during evening peak) that flat-rate American tariffs do not. States with strong TOU differentiation (California, Arizona) would see better payback than the national average suggests; states with flat rates would see worse.
The Bottom Line
Australia just ran the largest natural experiment in residential battery deployment ever attempted. Results are unambiguous: 400,000 batteries, 11.2 GWh, 10 months, matching the country's utility-scale sector in a single stroke. Energy Minister Chris Bowen called it "remarkably successful." The data supports the adjective.
For Americans watching from across the Pacific, the lesson is not "spend more on subsidies." Already, the IRA's 30% ITC rivals Australia's rebate in percentage terms. What the data shows is that a $9,000 subsidy on a $30,000 installation produces a 21-year payback that nobody takes, while a $3,000 subsidy on a $10,000 installation produces a payback that millions of households would jump at, and the variable that separates those two scenarios is not the check the government writes but the regulatory overhead it allows. Subsidies are the visible lever, but regulation is the invisible one, and it is three times more powerful.
What you can do: If you own a home in a high-electricity-rate state (CA, CT, MA, HI, RI, NH), run the numbers now. That 30% federal credit is available through at least 2032, and state-level incentives stack on top. Battery prices have fallen 40% in two years. Request three quotes and compare the installed cost per kWh of storage capacity, not just the headline price. If your installer quotes above $800/kWh installed (before incentives), the regulatory overhead in your jurisdiction is likely inflating the price. For renters and low-income homeowners, who make up nearly half of Australian households still shut out of the battery boom, community solar-plus-storage programs remain the most viable path, though few US programs currently include battery access.
Sources
- Reuters, "Australia's battery subsidies spark rooftop solar resurgence" (July 5, 2026)
- pv magazine Global, "Australia installs 400,000 home batteries in 10 months for 11.2 GWh" (May 2026)
- pv magazine Australia, "Rooftop solar registrations reach record high" (April 2026)
- SEIA / Benchmark Mineral Intelligence, "U.S. Energy Storage Market Outlook Q1 2026" (February 2026)
- EIA, "New U.S. electric generating capacity expected to reach a record high in 2026" (February 2026)
- BloombergNEF, "Energy Storage Market Outlook 1H 2026" (May 2026)
- Australian Energy Market Operator, 2026 Integrated System Plan
- CHARGED Initiative, "Global Rooftop Solar Penetration Report" (2026)