A $30,569 Quote for 12 Openings. The National Average Is $7,183.
The average U.S. window replacement project costs $7,183, but in-home sales quotes routinely land 3 to 5 times higher on comparable jobs. The 25C tax credit died on December 31, 2025. Every 2026 quote is full price, and nobody sells the buyer an independent way to price the job.
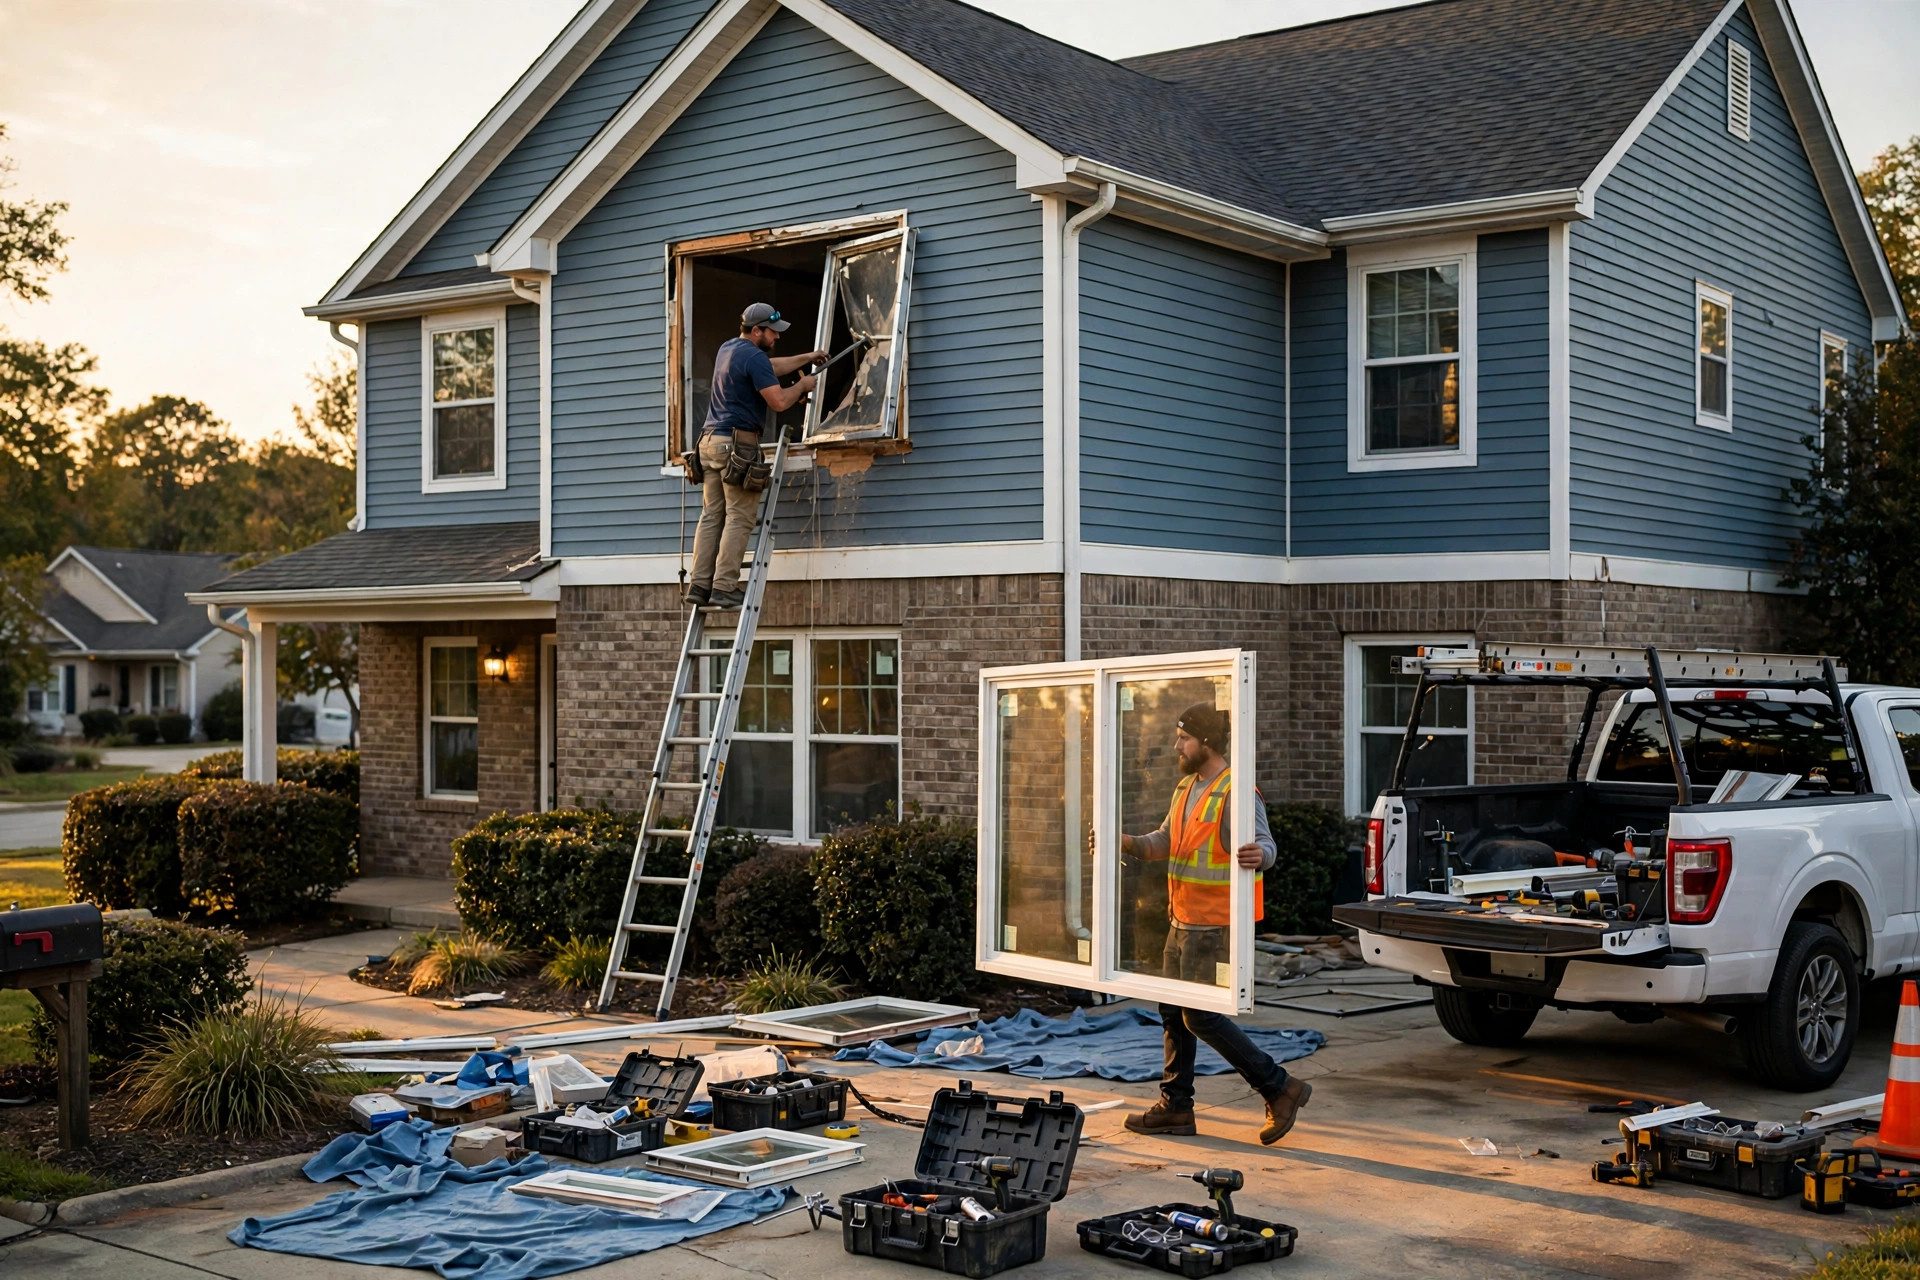
The Problem
In early 2026, a homeowner posted their Renewal by Andersen quote to an industry pricing forum: $30,569 for 11 windows and one patio door, roughly $2,550 per opening for the basic configurations described in the post. Renewal's own pricing guides put typical per-window costs at $1,800 to $3,500 installed, with full-home projects commonly reaching $30,000 to $80,000 or more.
Now the other number: a 2026 industry cost roundup puts the average installed window at $517, and the typical whole-project cost at $7,183. Same country, same openings, and a 4.9x gap between the premium in-home quote and the national average. (Caveat: the $517 average blends single-window repairs with full-house jobs, so the strict apples-to-apples gap is smaller, though still multiples. And $7,183 ÷ $517 works out to about 14 windows per average project, close to this 12-opening quote, so the comparison is roughly size-fair.)
The gap is not a mystery. It is a business model. Window replacement is one of the last big-ticket purchases still sold primarily at the kitchen table. A representative comes to the house, measures every opening, and presents a price on a tablet. Then comes the second price: the manager's discount, the today-only 40% off, the buy-two-get-one that expires when the rep leaves. This is a documented pattern, not rumor. A 2026 industry pricing guide describes the initial quote as deliberately higher than what the company expects to collect, with the "cooled off" discount engineered to feel like savings. The guide describes the tactic as legal and industry-wide. It works because the buyer has no reference price.
At the bottom of the market sits the mirror image. Window World built an empire on the widely advertised $189 installed window, a price point that defined the industry's low end for decades. Today that special runs closer to $349 installed, and the fine print does the real work: the teaser is a stripped-down builder-grade unit, sold only in packages of 6, 8, or 12, and per consumer-complaint reports, every upgrade that makes it an energy-efficient window (low-E coating, argon gas, grids) pushes the actual price toward the market median. The teaser gets the appointment, and the appointment gets the upsell.
What breaks this market is simpler: the quotes are not comparable. One bid lists a model number and NFRC ratings. The next lists adjectives: "premium vinyl, energy-efficient glass package." The installation method, pocket insert versus full-frame tear-out, which changes labor cost by hundreds per opening, is buried in the terms. Disposal, exterior capping, interior trim, and permits appear on some quotes and vanish from others. The buyer is comparing three numbers that measure different things, and the salesperson in the living room is the only person in the transaction who knows it. And the industry's favorite justification for the price, energy savings, collapses under its own math: at the premium tier the payback runs 52 to 303 years, as the calculation below shows.
Market Size
TAM calculation: Start with the Freedonia Group's industry study, which sizes the U.S. windows and doors market at $35 billion at the manufacturer level. Assume windows are roughly 60 percent of that ($21 billion), replacement demand is about 65 percent of window volume ($13.6 billion), and residential is about 75 percent ($10 billion). Installed project spend runs roughly 2.2 times manufacturer revenue once labor, trim, disposal, and dealer margin are included. That implies about $22 billion in annual installed residential window replacement spend (treat as accurate within ±40%; each multiplier carries real error, see Limitations). Cross-check: $22 billion divided by the $7,183 average project equals roughly 3 million projects per year, which is plausible against 145 million U.S. housing units on 20 to 30 year window lifecycles.
The buyable SAM is the intelligence layer, not the installation spend. The funnel: 200,000 quote uploads per year through a free benchmark tool, with 8 percent converting to a $99 audit report ($1.6 million). A certified installer program reaching 2,000 installers at $500 per month ($12 million). A verified-project marketplace doing $80 million in annual flow at a 1.5 percent take rate ($1.2 million). Combined SAM: roughly $15 million in software, certification, and take-rate revenue at maturity.
Year 3 target: 8,000 audits at $99 ($0.8 million), 800 certified installers at $500 per month ($4.8 million), and $30 million in verified project flow at 1.5 percent ($0.45 million), for about $6 million in Year 3 revenue.
The Product
A buyer-side quote intelligence platform. Not a lead generator, not a review site: an instrument panel for the person signing the contract. Every tool in this market is built to sell windows. Angi and Thumbtack monetize by selling the lead to installers. Review affiliates monetize through advertiser relationships. The manufacturers' own sites quote through their dealer networks. Nobody's revenue depends on the homeowner knowing the true price.
- Quote X-ray: Upload any quote as a photo or PDF. OCR and parsing normalize it to per-opening cost by window type, model number, glass package, and installation method, and flag missing line items: disposal, exterior capping, permits, interior trim. The X-ray turns three incomparable bids into one table.
- Regional benchmark: Anonymized per-opening pricing distributions by zip code, window type, and frame material, built from the upload funnel. It answers the only question that matters: is $2,300 per opening reasonable in suburban Columbus for a vinyl double-hung, or is it the 95th percentile?
- Discount theater detector: Identifies the inflated-anchor-then-discount pattern and shows what the "sale" price still costs against the market distribution. A 40% same-day discount on a $3,000-per-opening quote lands at $1,800, still 3.5 times the national average. The detector says so in plain numbers.
- Spec decoder: Translates the quote's adjectives into NFRC numbers (U-factor, solar heat gain coefficient, air infiltration, design pressure) and checks them against current ENERGY STAR criteria, so "energy efficient glass package" becomes a verifiable claim instead of a vibe.
- Installer scorecard: License verification, complaint rates, review velocity, and warranty terms compared side by side. The cheapest quote from an unlicensed crew with a one-year labor warranty is not the same product as the mid-priced quote from a certified installer with a lifetime warranty. The scorecard prices the difference.
- Rebate navigator: With the federal credit gone, remaining incentives are a patchwork of utility rebates. A zip-code lookup against the DSIRE database finds the ones the salesman will never mention, because they reduce the financed amount.
Unit Economics
| Metric | Value |
|---|---|
| Free tier (Quote X-ray + regional benchmark) | $0 (acquisition funnel) |
| Quote audit report (one-time) | $99 |
| Certified installer badge | $500/month per installer |
| Verified project take rate | 1.5% |
| OCR + data cost per audit | $4 |
| Consumer CAC (per uploaded quote, pre-conversion) | $18 |
| Installer CAC | $900 |
| Gross margin | 85% |
| Startup cost (18-month runway) | $650K |
| Break-even | 21 months |
Methodology note: Consumer CAC of $18 assumes the free benchmark tool ranks for "window replacement cost [city]" queries, which carry intense commercial intent and are currently served by thin affiliate content. Installer CAC of $900 reflects acquisition through distributor partnerships and trade associations rather than paid ads. The 85 percent gross margin reflects a software-plus-public-data model: the expensive input (quote data) arrives free through the upload funnel, and the heaviest cost is the audit review labor on flagged reports. Break-even at 21 months assumes the installer certification program reaches 400 paying installers by month 18. Two honest footnotes: at SAM scale the funnel costs 200,000 uploads × $18 = $3.6M against $1.6M in audit revenue, so the audit tier is deliberately a loss leader whose job is benchmark data density, with the $12M installer program funding the funnel. And the 18-month runway funds the build to month 18; months 18–21 are covered by early installer revenue or a small bridge.
Go-to-Market
Phase 1 (months 1-6): Launch the free Quote X-ray as a standalone tool. Every homeowner who just received a shocking in-home quote is a user with maximum intent and a document in hand. Distribute through SEO on cost queries and partnerships with home inspectors, who encounter window quotes during transactions when buyers have a 30-day clock and no context. Every uploaded quote feeds the anonymized benchmark database. The data flywheel is the whole game: each quote makes the benchmark smarter, which makes the tool more useful, which attracts more quotes.
Phase 2 (months 7-14): Monetize with the $99 audit report and launch the certified installer program in five metros. The pitch to installers inverts the usual dynamic: instead of buying leads and racing to the bottom, they pay a flat monthly fee for a badge that says their pricing is verified against the benchmark. Honest mid-priced installers, the ones currently losing to both the $189 teaser and the $3,000 in-home quote, become the product's best salespeople.
Phase 3 (months 15-24): Open the verified-project marketplace: escrowed deposits, milestone payments, and the 1.5 percent take rate. Add warranty and insurance partnerships, since documented installation quality is underwriting data. Expand to the adjacent in-home-sales categories that run the same playbook: entry doors, then siding, then roofing.
Competitive Landscape
| Company | What It Does | Buyer-Side Pricing? | Pricing |
|---|---|---|---|
| Renewal by Andersen, Window Nation, Power Home Remodeling | In-home sales and installation | No: they are the quote being evaluated | $1,500-$5,000 per window installed |
| Window World, Champion Windows | High-volume vinyl replacement | No: teaser pricing with upsell funnels | $225-$525 (Window World actual); $500-$1,200 (Champion) |
| Angi, Thumbtack, Modernize | Lead generation for installers | No: they sell the lead; pricier jobs are more valuable leads, which is a direct conflict | Free to consumer; installers pay per lead |
| Replacement Windows Reviews and affiliates | Reviews and cost guides | Partial: pricing data exists but no quote-level benchmarking; monetized through advertiser relationships | Free |
| Costco, Home Depot install programs | Bundled retail installation | No: opaque bundled pricing through third-party installers | Varies by market |
| This startup | Quote parsing, regional benchmarks, audits, certified installers | Core product: revenue comes from the buyer and flat-fee installer certification, never from a percentage of the job | Free benchmark; $99 audit; $500/mo installer |
The gap is structural. Every incumbent either sells the windows, sells the lead, or sells advertising against the confusion. Angi's cost guides are genuinely useful and genuinely free, but Angi makes money when the job is expensive, because expensive jobs produce valuable leads. The review affiliates publish real pricing data, but their revenue comes from the companies being reviewed. Nobody's business model depends on the homeowner paying the 50th percentile price instead of the 90th. That is the greenfield.
Why Now
Four forces are converging. First, the federal subsidy just died. The Section 25C Energy Efficient Home Improvement Credit, worth 30 percent of window costs up to $600 a year, was terminated by the One Big Beautiful Bill Act (Public Law 119-21, signed July 4, 2025) for property placed in service after December 31, 2025. Per the IRS, no credit is allowed for windows installed in 2026. The credit was the industry's favorite closer, the line that softened every sticker shock. Every 2026 quote is full price, buyers are doing the math themselves for the first time in years, and sales teams will lean harder on discount theater to fill the gap the credit left.
Second, the replacement wave is here. The suburban building boom of the 1980s and 1990s filled the country with builder-grade windows carrying 20 to 30 year service lives. Those windows are now 25 to 45 years old. The largest cohort of American housing stock is hitting replacement age simultaneously, which is why in-home sales operations are scaling and why quote volume is at a generational high.
Third, the quality signal got more technical. ENERGY STAR tightened its window criteria in version 7.0, and the remaining incentives are a patchwork of utility rebates that vary by zip code. When the only quality signal is a label with numbers on it, a product that decodes the numbers has real value, and a salesman who cannot explain U-factor has a real problem.
Fourth, the input got cheap. Phone-camera OCR plus model-number databases make quote parsing a commodity operation. The moat was never the parsing. It is the benchmark database, and the company that collects 200,000 real quotes first owns the reference price every future quote gets measured against.
Original Contribution: The Energy Payback by Quote Tier
A calculation we could not find published anywhere: Take the industry's number-one sales pitch, energy savings, and run it against the actual quote tiers. ENERGY STAR's own published estimates put the savings from replacing single-pane windows with certified models at $101 to $583 per year, depending on climate and utility rates. At the $7,183 national-average project cost, the energy payback runs 12 to 71 years. Already longer than most people own the home. At the $30,569 Renewal quote for 12 openings, the payback runs 52 to 303 years.
Read that again: at the premium tier, the energy payback exceeds the window's service life by up to an order of magnitude. The industry's primary justification for the purchase cannot mathematically justify the premium quote, in any climate, under any utility rate in ENERGY STAR's own range. The honest reasons to pay $2,550 per opening are comfort, noise, aesthetics, and warranty. Energy savings is not among them, and no salesman will show you this table.
A second unpublished number: the Cost vs. Value report's standardized midrange vinyl job, ten windows at $22,073, or $2,207 per opening, versus the national survey average of $517 per opening. That is a 4.3x gap between the industry's own benchmark project and what the average American actually pays. Some of the gap is scope: the Cost vs. Value job is a defined midrange spec, while the survey average blends single-window repairs with full-house replacements. But even the "today only" math fails. A 40 percent same-day discount on a $3,000-per-opening quote lands at $1,800, still 3.5 times the national average. The discount is real; the anchor price was engineered, not market-tested.
Limitations
Several weaknesses in this analysis deserve plain acknowledgment. First, online quote data is self-reported and skewed toward the outraged. People post the $30,569 quote; they do not post the $8,000 quote they accepted. The true distribution is less dramatic than the forums suggest, though the direction is not in doubt.
Second, part of the spread is real scope, not theater. A full-frame tear-out with rot repair, lead-safe practices in a pre-1978 home, and custom-sized fiberglass units genuinely costs multiples of a pocket insert of stock-size vinyl. The X-ray's hardest job is normalizing scope, and early versions will misclassify it.
Third, the TAM derivation stacks four estimated multipliers (60 percent windows, 65 percent replacement, 75 percent residential, 2.2x installed). Each carries real error. Treat the $22 billion as accurate within plus or minus 40 percent, and stress-test the business at the low end.
Fourth, regional labor variation swamps national benchmarks. A 50th-percentile price in Birmingham is a 20th-percentile price in the Bay Area. The benchmark must be hyperlocal or it misleads, which means the database needs density in every metro before the product is trustworthy anywhere.
Fifth, ENERGY STAR's $101 to $583 savings range is dominated by climate, and it specifically covers single-pane replacement. A buyer in San Diego replacing double-pane windows saves below that range entirely, and no benchmark changes the payback math there. The product's value proposition is weakest exactly where windows are cheapest to ignore.
Sixth, the certified-installer badge is paid by the party being rated. Flat-fee softens the distortion versus per-lead or percentage models, but it is still a conflict: the company needs published audit standards and a real revocation policy, or the badge is just advertising.
Strongest Counterargument
The strongest case against this startup is that buyers are not actually optimizing on price, and the market knows it. Windows are a confusing, installed-once-a-decade purchase where the failure mode is catastrophic: a badly installed window rots the wall around it and voids the manufacturer's warranty, and the window itself was the cheap part. The in-home model persists because it sells the thing buyers actually want, which is certainty. One company measures, manufactures, installs, and warranties, which gives the buyer exactly one throat to choke. A price gun that steers buyers toward the cheapest installer could make outcomes worse, not better, and the first water-intrusion lawsuit traced to a "verified cheap" recommendation would end the company.
Part of the premium is also a genuine insurance premium, not theater. Renewal's in-house certified crews, transferable warranties, and a century-old manufacturer standing behind the install have real value against the alternative: a subcontractor crew paid per opening who will not exist in three years. The X-ray can show that $2,300 per opening is the 95th percentile. It cannot show whether the 95th percentile was worth it for the buyer who never thinks about their windows again.
And the free benchmark may not be a business. Angi and Thumbtack already publish cost guides, and they are free, because the guides are bait for the lead-gen machine. If the benchmark alone is the product, the incumbents can copy it in a quarter and distribute it to ten times the audience. The defensible business is the certified installer network and the audit, not the data. If the company falls in love with its benchmark and underinvests in the network, it becomes a feature of someone else's funnel.
The Bottom Line
American homeowners will spend roughly $22 billion this year replacing windows, in a market where the premium in-home quote runs 3 to 5 times the national average on comparable jobs, the standard sales process includes an advertised discount of up to 40 percent off an inflated anchor price, and every existing tool is monetized by someone who benefits from the confusion. The federal tax credit that used to soften the sticker shock died on December 31, 2025, so 2026 buyers are facing full price with no reference point. A buyer-side quote intelligence platform, free benchmark feeding a paid audit and a flat-fee certified installer network, is the missing instrument panel. The honest caveats stand: the spread partly reflects scope, the benchmark must be hyperlocal to be honest, and certainty has value that a price gun cannot measure. But the company that collects 200,000 real quotes first owns the reference price, and in a $22 billion market with no reference price, that is the whole business.
What You Can Do
- Normalize to cost per opening: get three or four bids and divide each total by the number of openings before comparing anything else, because totals lie and per-opening costs can be checked.
- Never sign on the first visit: the "today only" discount is a documented industry pattern that will still exist tomorrow, so sleep on every quote as a matter of policy.
- Demand NFRC numbers, not adjectives: get the U-factor, solar heat gain coefficient, and air infiltration rate off the label, since "premium energy package" is not a specification.
- Match the installation method across bids: a pocket insert and a full-frame tear-out are different jobs at different prices, so make sure every bid quotes the same one.
- Require full itemization of disposal, exterior capping, interior trim, and permits, because vanishing line items are where the real price hides.
- Check DSIRE for your zip code before you buy. With the federal credit gone, utility rebates are the only incentives left, and the salesman will not mention them.
- Run your own energy payback by dividing the quote by your best estimate of annual savings (ENERGY STAR's range is $101 to $583 for single-pane replacements); if the answer exceeds the years you will own the home, you are buying comfort and quiet, not savings.
- Do not optimize on price alone: a bad install rots the wall and voids the warranty, so use the benchmark to avoid overpaying, then pick the best installer near the middle of the distribution rather than the bottom.
Related
📰 The 'Free Roof' Is a $9,609 Lie. A Fixed-Price Marketplace Could Clean Up America's $19B Residential Roofing Market — the same in-home opacity playbook, one trade over: storm-chaser pricing and the insurance-claim markup
📰 The $29 Service Call Is a Lie. A Fixed-Price Marketplace Could Clean Up America's $2.6B Garage Door Repair Trade — the teaser-price funnel at smaller ticket sizes: how the $29 visit becomes a $900 upsell
📰 Commercial Waste Invoice Intelligence SaaS for Multi-Location Operators — the B2B cousin: unreadable invoices, unbundled fees, and the audit layer that prices them