5.9M Buildings Must Test Emergency Lights Every 30 Days. The Software That Proves They Did It Does Not Exist.
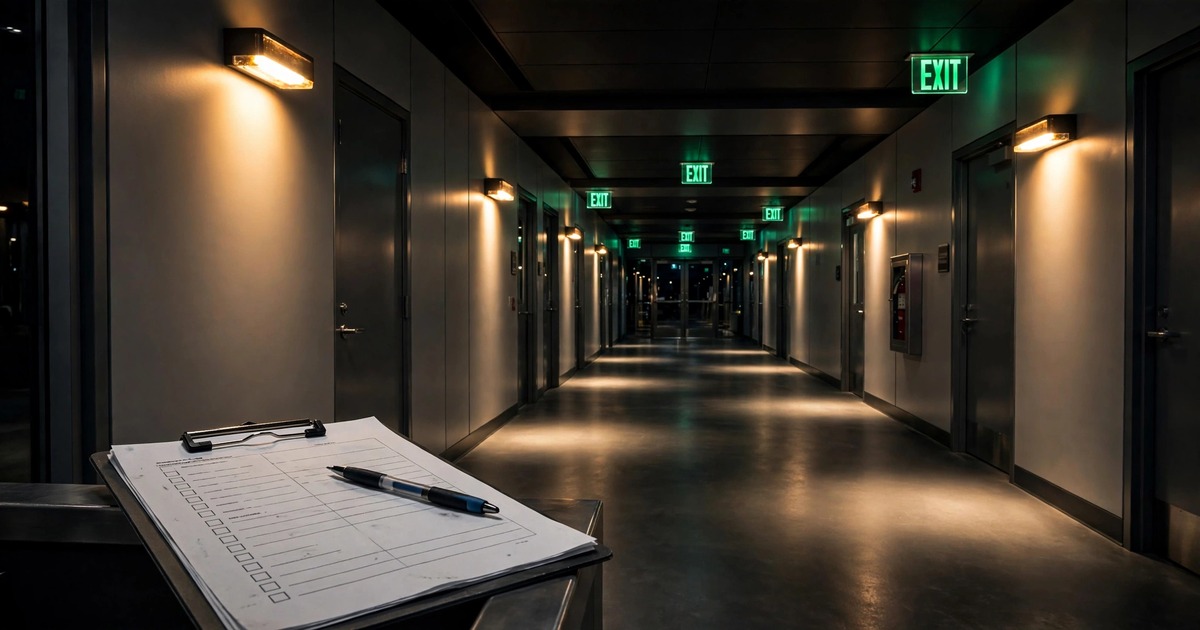
Every emergency light and exit sign in every commercial building in America must be tested 30 seconds every month and 90 minutes every year. The test must be logged in writing for the Authority Having Jurisdiction. The most cited violation in fire inspections is a dead emergency light that looked fine until the power failed. The entire workflow lives on paper logs, clipboards, and memory.
The Problem
The U.S. has 5.9 million commercial buildings (EIA CBECS 2018). Every one of them with two or more exits, or any occupancy over 100, or any educational or healthcare use, must have emergency egress lighting. NFPA 101 Section 7.9.3 is blunt: every emergency lighting system must be tested monthly for at least 30 seconds, and annually for 90 minutes. For battery-powered unit equipment, you press the test button and watch. For generator systems, you throw the transfer switch and run under load. For storage battery systems, you follow manufacturer procedure. Then you write it down, and that last part is where buildings fail.
A fire alarm panel reports trouble. A sprinkler gauge shows low pressure. A dead emergency light looks identical to a working one until the building goes dark. Wilson Fire notes this is the most commonly cited violation in commercial inspections precisely because nothing announces the failure. Smoke removes visibility within the first minutes of a fire, often before sprinklers activate. What remains is a marked path and battery-powered illumination. If the battery has degraded to 11 minutes of runtime, the egress path goes dark before evacuation completes in a hospital, a school, or a 20-story office tower.
The code is explicit about documentation. NFPA 101 requires written records maintained for inspection by the AHJ. Self-testing and self-diagnostic luminaires automate part of the process but still require monthly visual verification and annual record review. The International Fire Code adopts the same language by reference. OSHA 1910.37 mandates that exit routes be adequately illuminated and that exit signs be visible. Joint Commission standard LS.02.01.10 EP 28 cites hospitals when emergency lighting documentation is incomplete. CMS tags K-tags for the same deficiency. Yet the workflow is a janitor with a clipboard walking 300 fixtures across 4 buildings on the last Friday of the month.
Consider a real facility: a 120-bed skilled nursing facility has roughly 80 to 120 emergency lighting units and exit signs. Each must be tested 12 times per year for 30 seconds plus once for 90 minutes. That is 1,040 to 1,560 individual test events per year. Each event requires a date, time, fixture identifier, tester name, pass or fail, and corrective action if failed. Multiply by a regional operator with 40 facilities and you have 60,000 test events per year tracked in binders that a state surveyor flips through for 10 minutes before writing a citation. No software ties the fixture inventory to the test schedule to the battery replacement and ultimately to the AHJ report the inspector demands.
Market Size
Original TAM calculation: Start with building count. EIA CBECS 2018 counts 5.9 million commercial buildings in the United States. Add 920,000 multifamily buildings with 5+ units that fall under IFC emergency lighting requirements for common egress paths (Census AHPS). Add 130,930 K-12 schools (NCES), 5,500 higher education institutions, and 6,120 hospitals (AHA). Not all 5.9M commercial buildings require emergency lighting, but CBECS lighting tables show 4.76 million buildings report lighting as an end use with employees present, a strong proxy for occupied buildings subject to means-of-egress requirements.
Conservative addressable base: 3.5 million buildings that definitively require emergency lighting and exit sign testing. This excludes single-tenant small retail under 1,000 sq ft with direct exterior exits and similar edge cases where code exempts emergency lighting.
Average building has 12 to 40 emergency fixtures. Small office: 8. Mid-size retail: 15. School: 60. Hospital: 400+. Blended average across addressable base: 18 fixtures per building. Total fixtures: 63 million in the conservative base.
SaaS pricing: $49/month for single-building operators (up to 30 fixtures, basic test scheduling and AHJ report generation). $149/month for multi-building operators (up to 5 buildings, 200 fixtures, technician assignment, deficiency work orders). $399/month for enterprise (unlimited buildings, portfolio dashboard, CMS/Joint Commission K-tag mapping, API to work order systems). Blended ARPU at scale: $89/month, based on heavy skew toward small operators but higher retention on enterprise.
TAM at full penetration of 3.5M buildings at $89/month: $3.74 billion per year in ARR. That number is fantasy, but it frames the scale. Realistic Year 3: 4,000 paying buildings at $89/month = $4.27M ARR plus $180K in hardware referral (self-testing retrofit kits) and $120K in deficiency parts marketplace commission.
SAM, immediate: buildings where failed inspections carry financial consequences beyond a warning. Hospitals (6,120), skilled nursing facilities (15,300), K-12 schools (130,930), hotels (56,000, AHLA), and multi-site retail operators with 10+ locations (approximately 40,000 operators controlling 350,000 buildings). Total: ~557,000 buildings. At $89/month: $595M annual SAM. The compliance urgency is highest here because CMS, Joint Commission, state fire marshals, and insurance carriers audit these occupancies on fixed cycles and fine or withhold payment for documented deficiencies.
The Product
A compliance and documentation platform purpose-built for the NFPA 101 7.9.3 workflow. Designed to sit alongside existing facility management tools, not replace them. Six modules:
- Fixture inventory and QR tagging: Walk the building once. Scan or photograph each emergency light and exit sign. The app creates a fixture record with location (floor, room, corridor, photo), fixture type (unit equipment, central battery, generator-fed), battery type and rating, last replacement date, and a unique QR code printed on a weatherproof label. That QR code is the fixture's identity forever. Next month, the tester scans the code, not hunts for a description like "2nd floor hall near bathroom."
- Test scheduling engine: NFPA 101 7.9.3.1.1 requires monthly tests at 30-day intervals. Not "once a month," 30-day intervals. The engine generates a test route per building: ordered list of fixtures grouped by floor or zone for efficient walking, with due dates, assigned technician, and push notification 48 hours before the 30-day window closes. Missed tests escalate to the facilities manager. Annual 90-minute tests are scheduled separately with 30-day advance warning because they require after-hours power interruption coordination in occupied buildings like hospitals.
- Mobile test capture: Technician walks the route. At each fixture: scan QR, tap test button on fixture, confirm lamp illuminated for 30 seconds (timer in app), record pass or fail with one tap, photograph fixture illuminated if the customer or AHJ requires photographic evidence. Fail triggers immediate deficiency record: battery suspect, lamp failed, fixture damaged, charger fault. The entire route can be completed offline; sync happens when the technician returns to WiFi. A 40-fixture building test takes 25 minutes with the app versus 90 minutes with a clipboard and later data entry.
- Battery lifecycle and predictive replacement: This is the original contribution layer. Every emergency lighting battery has a predictable degradation curve. Lead-acid: 3 to 5 years. Nickel-cadmium: 5 to 7 years. The platform tracks battery age, number of discharge cycles (monthly + annual tests count), test duration degradation (a battery that held 92 minutes last year and holds 74 minutes this year is 6 months from failure), and ambient temperature exposure if the facility has BMS data. It predicts failure 60 to 90 days in advance and creates a purchase order. No more discovering a dead battery during a fire marshal inspection.
- AHJ and accreditation report generator: One click produces the written record NFPA 101 requires: building name, address, date, fixture ID, location, test type (monthly 30-sec or annual 90-min), result, tester name, corrective action. Formatted for fire marshal review. Separate templates for Joint Commission LS.02.01.10, CMS K-tag 0291, OSHA 1910.37, and IFC 1008.3.5. The report includes portfolio-level compliance percentage, overdue test count, deficiency aging, battery replacement forecast, and a 12-month trend line that surveyors love. For multi-site operators, a single PDF covers 40 buildings with a table of contents. For hospitals facing Joint Commission survey, the report maps each deficiency to the specific Life Safety Code citation.
- Self-testing luminaire integration: Newer fixtures from Acuity Brands, Eaton, Hubbell, and Signify include self-test and self-diagnostic options that automatically perform monthly and annual tests and report via DALI or wireless mesh. The platform ingests those automated results via API (Acuity's Atrius, Eaton's Connected Safety) and still requires the monthly visual verification NFPA 101 mandates even for self-testing units. The integration eliminates manual test execution for upgraded buildings but retains the documentation and battery lifecycle layers. This is the upgrade path that makes the product defensible as buildings modernize: manual testing today, automated ingestion tomorrow, same compliance vault.
Unit Economics
| Metric | Value |
|---|---|
| Single-building tier | $49/month, up to 30 fixtures |
| Multi-building tier | $149/month, 5 buildings, 200 fixtures |
| Enterprise tier | $399/month, unlimited, API, K-tag mapping |
| Blended ARPU (at scale) | $89/month |
| QR label kit (one-time) | $39 per building, 40 labels |
| Per-fixture cost to serve (cloud, support, SMS) | $0.11/fixture/month |
| Customer acquisition cost | $680 |
| Average fixtures per paying building | 22 |
| Gross margin (software only) | 87% |
| Average retention (serviceable market) | 34 months |
| LTV ($89 × 34 × 87%) | $2,632 |
| LTV:CAC | 3.9:1 |
| Payback period | 7.6 months |
| Startup cost (18-month runway) | $740K |
| Break-even | 19 months, ~850 buildings |
Methodology note: CAC of $680 assumes a sales motion concentrated at NFPA Conference, NFMT (National Facilities Management & Technology), and state fire marshal association meetings, supplemented by targeted digital to facilities directors via IFMA and ASHE channels, plus channel partnerships with fire protection service companies that already perform annual emergency lighting testing as a subcontracted service. These service companies test but do not document in a system the building owner can retain; a referral partnership converts their manual service into a software attach. 34-month retention reflects the stickiness of compliance documentation: once a building has 12 months of test history in the vault, switching to a clipboard means losing the audit trail a fire marshal expects to see trending. Gross margin of 87% is pure SaaS minus $0.11/fixture/month for cloud time-series storage, push notification delivery, and support.
Go-to-Market
Phase 1 (months 1-7): Build for the buyer with the sharpest pain: skilled nursing facilities and small hospitals. CMS tags F-tag 908 and K-tag 0291 cite facilities for incomplete emergency lighting documentation during annual surveys. A single citation can trigger a plan of correction, repeat survey, and public reporting on Care Compare. There are 15,300 SNFs and 1,350 critical access hospitals, each averaging 90 fixtures. They have a facilities director who currently tracks tests in a 3-ring binder. Offer a free fixture inventory for the first building: ship QR labels, have them scan, generate the first AHJ report free. Conversion trigger is the survey: when the state surveyor asks for 12 months of monthly test records and the administrator pulls a binder with 4 months missing, the $49/month sale closes itself. Target 200 buildings through 5 regional SNF operators and 2 fire protection service companies that already service these occupancies.
Phase 2 (months 8-14): Add K-12 and hospitality. Schools have the same problem at larger scale: a typical high school has 60 to 120 emergency fixtures across gyms, cafeterias, and classroom wings, and the maintenance tech who tests them rotates every 18 months, taking the institutional memory of where fixtures are with him. QR tagging solves the turnover problem. Hotels have 56,000 properties (AHLA) with 80 to 300 fixtures each and brand standard audits that check life safety documentation. Partner with 3 hotel management companies (100+ properties each) for portfolio rollout. Add multi-building tier with technician assignment and overdue escalation. Target 1,200 cumulative buildings.
Phase 3 (months 15-24): Enterprise and channel. Multi-site retail, restaurant, and fitness operators with 10+ locations have the same 30-day interval problem across hundreds of buildings and no centralized way to know which stores missed their monthly test. A regional facilities manager overseeing 80 stores cannot call each store every month. The portfolio dashboard shows overdue percentage, deficiency aging, and battery replacement forecast across the fleet. Close 2 enterprise operators at 200+ buildings each. At the same time, launch a certification program for fire protection service companies: they white-label the test capture app, their technicians perform the monthly tests, the building owner retains the compliance vault. The service company reduces its own liability by producing tamper-evident records. The startup acquires buildings at $0 CAC through channel.
Competitive Landscape
| Company | What It Does | Emergency Lighting? | Pricing |
|---|---|---|---|
| BuildingReports | Fire and life safety inspection reporting for service companies: sprinklers, alarms, extinguishers, 100+ templates | Has a generic emergency lighting template but no fixture inventory, no 30-day interval enforcement, no battery lifecycle, no QR routing | $2,000+/year per technician |
| SafetyCulture (iAuditor) | General inspection checklists, 100k+ templates, photo capture, offline | Generic checklist builder; user builds their own emergency lighting form; no NFPA 101 test logic, no AHJ formatting, no battery tracking | $24/seat/month |
| ServiceChannel / Accruent / FMX | Enterprise facility management and work order platforms | Can schedule a recurring work order called "test emergency lights" but has no fixture-level tracking, no mobile test capture workflow, no AHJ report | Enterprise custom |
| Acuity Atrius / Eaton Connected Safety | Connected emergency lighting hardware with automated self-test reporting | Automates testing for new fixtures from that manufacturer only; no support for mixed-vintage buildings with 15-year-old fixtures; still requires visual verification logging; no battery lifecycle across brands | Hardware + subscription, $8-15/fixture/year |
| Inspect Point / Formlink | Fire protection inspection for sprinkler contractors | Focused on NFPA 25 sprinkler and NFPA 72 alarm; emergency lighting is an afterthought add-on with no 30-day interval logic | Custom |
| This startup | NFPA 101 7.9.3 purpose-built: fixture inventory, QR routing, 30-day interval enforcement, mobile test capture, battery lifecycle, AHJ/Joint Commission/CMS report generation | Core product, every feature maps to a specific code citation | $49-399/month |
The gap is structural. Facility management platforms schedule work orders. Inspection platforms capture photos. Connected lighting manufacturers report on their own new fixtures. None of them enforce a 30-day interval, none track battery degradation across 18 fixtures from 4 manufacturers installed across 7 years, and none produce the specific written record a fire marshal, a Joint Commission surveyor, or a CMS surveyor expects to see. That specificity is the moat.
Why Now
Three forces converge. First, enforcement is tightening. Mordor Intelligence notes that compliance automation reducing NFPA 101 labor burden is a key white-space opportunity, especially for multi-site owners in healthcare, education, and public infrastructure. IIJA infrastructure spending ($279 billion obligated by April 2025) includes airport, transit, and public building upgrades where code-compliant emergency lighting is procured alongside LED packages. Updated ANSI/UL 924 (2025) and NEMA controlled-emergency-lighting clarifications raise the procurement bar toward listed, interoperable solutions that maintain required output. Inspectors know this and cite more aggressively when documentation is missing.
Second, the installed base is aging into battery failure. The LED conversion wave from 2015 to 2020 replaced incandescent emergency lighting with LED fixtures but kept the same lead-acid battery packs with 3 to 5 year lifespans. Those batteries are now in years 6 to 11. Facilities that converted to LED in 2017 and never replaced batteries have fixtures that illuminate for 8 minutes and die, but still pass a casual glance test because the green LED charge indicator glows regardless of capacity. Only a full 90-minute discharge reveals the degradation. CMS and Joint Commission have increased K-tag citations for this exact failure mode in the last two survey cycles.
Third, labor turnover makes institutional memory impossible. The median tenure for a maintenance technician in commercial real estate is 18 to 24 months. In skilled nursing, it is 14 months. Each technician inherits a building where emergency lights were "somewhere" tested by someone who left. QR tagging and a persistent digital inventory survive turnover. The next technician scans, tests, and the vault continues. Without it, every turnover resets compliance to zero and creates a 2 to 3 month gap where no tests occur while the new hire learns the building. That gap is when the fire marshal arrives.
Original Contribution: The Battery Degradation Gap Tax
A calculation nobody has published: How much does unrecorded battery degradation cost multi-site operators in emergency replacements and failed inspections?
Start with fixture count. A regional operator with 40 SNFs averages 90 fixtures per building, totaling 3,600 emergency lighting units. Lead-acid batteries at $18 to $35 each, average $24. Nickel-cadmium at $45 to $80, average $58. Mix 70% lead-acid, 30% NiCd for a blended battery cost of $34.20 per fixture per replacement cycle.
Reactive replacement pattern: without lifecycle tracking, batteries are replaced when they fail a test or a surveyor cites them. Industry data from battery distributors suggests reactive replacement costs 2.1× the planned replacement cost because of rush shipping ($12 to $18 per battery overnight), emergency service call ($150 to $250 per trip), and overtime labor when a surveyor requires same-day correction. Planned replacement during a scheduled preventive maintenance window costs the battery plus 15 minutes of in-house labor at $28/hour fully loaded, or $7. A reactive replacement costs $34.20 + $15 shipping + $200 service trip amortized across 2.3 batteries per trip ($87) + $14 overtime premium = $150.20. The premium is $109 per battery.
With 3,600 fixtures and a 4-year average battery life, 900 batteries per year require replacement. Reactive pattern at 80% of replacements (720) versus planned pattern at 20% (180) yields 720 × $109 = $78,480 per year in avoidable premium for a 40-building operator. Add failed survey cost: a K-tag citation requires a plan of correction, repeat documentation, and in SNFs can affect the Five-Star Quality Rating which drives census. One rating point is worth roughly $12,000 to $25,000 in annual revenue per facility in markets where families comparison-shop on Care Compare. Even one citation per year across 40 facilities attributable to emergency lighting documentation gaps costs $12,000 minimum in lost revenue plus $3,500 in administrative correction time.
Total gap tax for a 40-building operator: $78,480 in battery premium plus $15,500 in survey impact = $93,980 per year. Against a $149/month × 40 buildings × 12 months = $71,520 annual software cost, the operator nets positive on battery savings alone before counting avoided citations, insurance implications, or litigation defense value from tamper-evident test records after an incident.
Scale to the 15,300 SNFs nationally at 90 fixtures each: 1.38 million fixtures, 345,000 annual battery replacements, 276,000 reactive at $109 premium = $30.1 million per year in avoidable battery replacement premium industry-wide for SNFs alone, before counting hospitals, schools, and hotels.
Limitations
This analysis assumes a battery replacement premium and survey impact that varies dramatically by operator sophistication. A large REIT with a centralized facilities team and a CMMS already doing preventive maintenance may have planned replacement rates closer to 60% reactive, not 80%, which cuts the gap tax calculation by half. The $12,000 revenue impact per Five-Star rating point is an average across markets; in rural markets with one SNF option, families cannot comparison-shop and the rating impact on census approaches zero. The calculation also ignores the cost of the QR labeling and initial inventory, which for a 40-building operator is roughly 3,600 labels at $0.12 each plus 40 hours of walk time at $28/hour, or $1,552 one-time, small but not zero.
Self-testing luminaire adoption is a real headwind. Acuity Brands, Eaton, and Hubbell are aggressively pushing self-test fixtures that automate monthly and annual tests and report through building management systems. In new construction and major renovation, which accounts for roughly 180,000 commercial buildings per year (Census C30), new fixtures will be self-testing by default within 5 years as UL 924 2025 and energy code drive adoption. The startup's manual testing workflow is irrelevant for those buildings. The defense is that 5.9 million existing buildings have legacy fixtures with 10 to 15 year remaining lives, and self-testing fixtures still require visual verification and record retention per NFPA 101, which no BMS currently handles as a compliance vault. But the long-term trend is toward automated testing, and the startup must execute the integration module to remain relevant past year 5.
Enforcement variability cuts both ways. In jurisdictions with strong fire marshal programs (California, New Jersey, Massachusetts), emergency lighting documentation is checked on every inspection and citations are common. In rural jurisdictions with part-time volunteer fire inspection, emergency lighting may not be checked for years. Market penetration will be uneven, concentrated in healthcare, education, and hospitality where accreditation or brand standards drive compliance regardless of AHJ rigor, and thinner in general office and small retail where the fire marshal is the only enforcement mechanism.
The TAM calculation includes 3.5 million buildings at $89/month as a framing device, not a forecast. Actual paying market is limited to buildings with a facilities manager who feels inspection risk acutely, which skews toward institutional occupancies and multi-site operators. Single-tenant small office buildings with 8 emergency fixtures and an owner-operator who has never been inspected have low urgency and $49/month may still be a hard sell. Willingness to pay is correlated with accreditation pressure, not building count.
Strongest Counterargument
BuildingReports already has 15,000 technician users, a decade of fire inspection report templates, and a sales channel into every fire protection service company that would be the natural channel for emergency lighting testing. Adding a proper emergency lighting module with fixture inventory, 30-day interval enforcement, and battery tracking is a quarter of engineering for a team that already built sprinkler, alarm, extinguisher, and hood suppression modules. They have the distribution, the customer trust, and the AHJ report formatting experience. A standalone startup building only emergency lighting compliance is a feature they could add.
The counterargument is strengthened by the economics of inspection software. Fire protection service companies already pay BuildingReports $2,000+ per technician per year. They use it to generate the report they hand to the building owner and AHJ. If BuildingReports adds a competent emergency lighting module at $20/month more per tech, the service company has no reason to buy a separate $49/month single-building SaaS for the owner to maintain separately. The inspection company can test and report in one tool. The building owner's ongoing monthly documentation need between annual inspections is real but small: 11 of 12 monthly tests are not performed by the fire protection contractor, they are performed by in-house staff, and BuildingReports is a contractor tool, not an owner tool. That distinction matters but may not be enough to sustain a standalone company against an incumbent that owns the contractor channel.
The defense is that emergency lighting is an owner-maintained system, not a contractor-maintained system. Sprinklers and fire alarms are inspected annually or quarterly by licensed contractors and generate a report. Emergency lighting is tested monthly by the building's own maintenance staff, 12 times per year, with the contractor involved only if a fixture fails. The compliance workflow belongs to the owner, not the contractor. BuildingReports is sold to contractors. This startup is sold to owners and operators. The contractor channel is a lead source, not the customer. Whether that ownership distinction sustains a standalone business depends on whether building owners feel enough pain to buy software for a task they currently do with a clipboard, which is unproven. The pilot must validate willingness to pay, not just willingness to use a free inventory tool.
What You Can Do
If you manage facilities: Walk your building tomorrow with your phone and count emergency lights and exit signs. Photograph each one. Check the manufacture date on the battery compartment, usually stamped inside. If more than 30% are over 4 years old on lead-acid or over 6 years on NiCd, budget for bulk replacement this quarter, not reactive ones after the fire marshal visits. Then pull your last 12 months of test logs. If you have fewer than 12 monthly entries per fixture or no annual 90-minute entries, you have a documentation gap that is a citation waiting for a surveyor. A $49/month tool that prevents one K-tag is ROI positive on day one.
If you run a fire protection service company: Your annual emergency lighting inspection is a $300 to $800 service call that you perform, write a one-page letter for, and forget. The building owner needs 11 more monthly tests that you do not perform. Offering a QR-tagged fixture inventory plus a mobile app for their in-house staff to perform monthly tests, with your company receiving deficiency alerts for upsell on repairs, turns a one-time inspection into a recurring relationship and a differentiator against competitors who hand over a clipboard form. Ask your customers if they have 12 months of test records. Most do not. That is your attach point.
If you are building in this space: Your beachhead is skilled nursing facilities in California, New Jersey, or Massachusetts, states with rigorous survey processes and high citation rates. Partner with one regional SNF operator with 20+ buildings. Offer free fixture inventory for one building to prove the workflow, then convert the portfolio. Validate two things in the pilot: first, that in-house maintenance staff will actually scan QR codes and tap pass or fail on a phone, which is not guaranteed given technician demographics and phone policies; second, that the AHJ report format you generate satisfies a real fire marshal or surveyor on first submission without revision. If both hold, you have a product. If technicians refuse the phone workflow, you have a service business that performs the monthly tests for them, which is a different business with different unit economics.
The Bottom Line
5.9 million commercial buildings have emergency lights that must be tested every 30 days and 90 minutes once a year, with written records kept for the fire marshal. The most common fire inspection violation is a dead emergency light that looked fine because the green charge indicator glows regardless of whether the battery can actually hold 90 minutes. Facilities track 12 monthly tests plus one annual test per fixture per year, 1,000+ test events per building per year, in paper binders that lose 2 to 3 months every time a maintenance tech quits. Connected self-testing fixtures solve part of the problem for new construction, but 5.9 million existing buildings have legacy fixtures with 10+ years of remaining life and no compliance vault. At $49/month for a single building, the software costs less than one emergency service call for a battery that failed during a survey and pays for itself in avoided reactive battery premiums alone. The regulatory wave is not coming, it is here: NFPA 101 has required this since the 1980s, and enforcement is finally catching up to the code. Someone will build the compliance layer that turns a clipboard walk into a QR scan and a binder into a tamper-evident vault. The only question is whether it gets built as a standalone SaaS or as a feature a fire inspection incumbent adds once the market proves the need.
Related
📰 Building Recertification Compliance SaaS — another recurring building safety inspection with 30-year age triggers and $5K-$50K fines for missed deadlines
📰 Wildfire Smoke Employer Compliance SaaS — life safety compliance where documentation is the product, enforcement is accelerating, and clipboard workflows create liability
📰 Elevator Inspection Compliance SaaS — the compliance documentation pattern applied to 1M+ regulated devices with annual inspection mandates and state-specific reporting